The Bank of England’s Monetary Policy Committee voted to keep the base rate unchanged at 3.75%, meeting analyst expectations. The decision was reached via a narrow 5-to-4 split—with five members voting for a hold and four dissenting in favour of a 25-basis-point cut—underscoring a significant divide within the Committee regarding the economic outlook. The central bank continues to grapple with an inflation rate of 3.4%, which remains substantially above the 2% target. Conversely, the labour market has shown signs of cooling, with unemployment reaching 5.1%—the highest level in around three years—alongside a progressive weakening in consumer demand. The BoE reiterated that its forward guidance remains data-dependent, with future pivots resting on official economic releases.
Market reaction was notably bearish for the domestic currency; despite the decision technically maintaining a restrictive monetary stance, the British pound depreciated by 0.89% to trade at $1.3529 against the US dollar.
Technical analysis of the GBP/USD pair
From a technical perspective, the GBP/USD pair continues to trade within a well-defined bullish channel. However, current market structure reveals several key nuances:
Trend Context: In the long term, the British pound maintains its upward trajectory, remaining positioned above its 50, 100, and 200-period Simple Moving Averages (SMA). In the short term, however, the pair is struggling to clear significant structural resistance. Resistance Levels: Should the pair breach the immediate structural resistance at 1.3700, the next major target is the psychological ceiling of 1.4000, which aligns with the upper boundary of the bullish channel. A decisive move above this level would signal an extension into a new price territory. Support Levels: Should the short-term support at 1.3350 fail, the next critical floor is located at 1.3050, representing the lower boundary of the current bullish channel. A breach of the 1.3050 zone would significantly heighten the probability of a broader trend reversal or a deeper correction. Momentum Indicators: The Moving Average Convergence Divergence (MACD) is currently signalling a bearish crossover at historically elevated levels, suggesting the possibility for a short-term correction or a period of price stabilisation. Meanwhile, the Relative Strength Index (RSI) remains in neutral territory, reflecting the current market indecision. 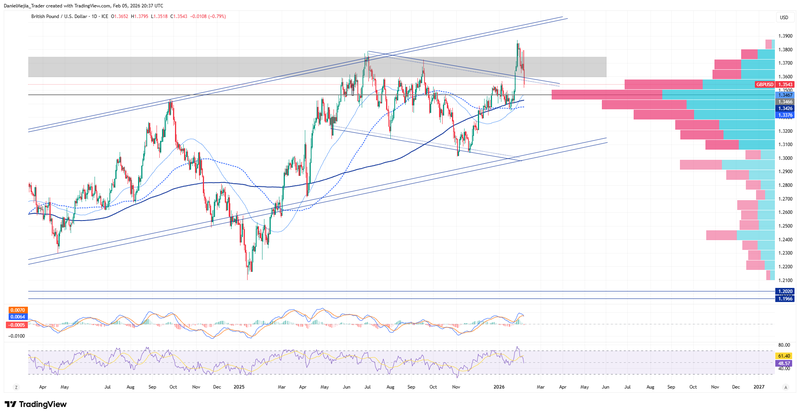
Figure 1. GBP/USD pair (2024-2026). Source: Data from the Intercontinental Exchange (ICE); own analysis conducted via TradingView.