Thank you for subscribing to my posts. If you’re not yet a paying supporter, please consider becoming one. That’ll allow you to DM me with questions and comments. Your contribution will help cover the cost of the data I use in my posts, which I fund out of my own pocket. Thanks so much for your support and feedback!
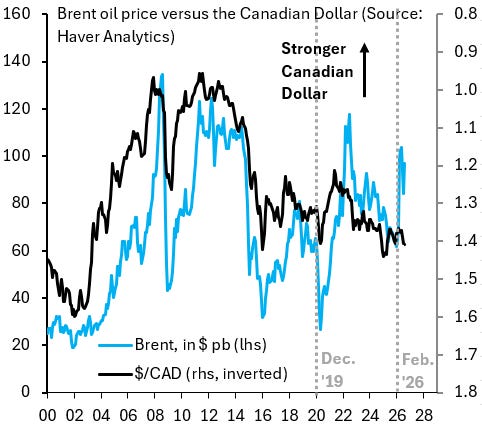
Historically, the Canadian Dollar trades closely with global oil prices, rising when they go up and falling when they drop. That makes sense given Canada’s status as a major oil exporter, but in recent years something isn’t right. The recent spike in oil prices hasn’t given the Canadian Dollar any lift and it doesn’t look like Trump tariff announcements are a good explanation for what’s going on either. Something about the Canadian Dollar has broken, which may explain why I get so many questions on it, including on yesterday’s live stream about shadow government bond yields. Today’s post takes a look at what’s going on. In recent months, the decoupling of the loonie from oil prices has reached a historical high.
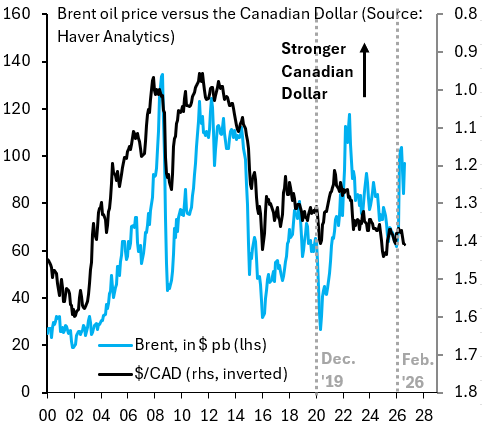
The chart above shows that the Canadian Dollar (black line) and Brent (blue line) have historically co-moved closely. The chart shows the front-month Brent futures price on the left axis and the inverted $/CAD exchange rate on the right, which means this line falls when the loonie weakens against the US Dollar. Take a look at the years since the pandemic. We’ve had two notable spikes in global oil prices – after Russia’s invasion of Ukraine in 2022 and now with the outbreak of the war between the US and Iran – yet neither of these have given a meaningful lift to the Canadian Dollar. Of course, it’s possible that other factors may have offset oil prices, so I look at this next.
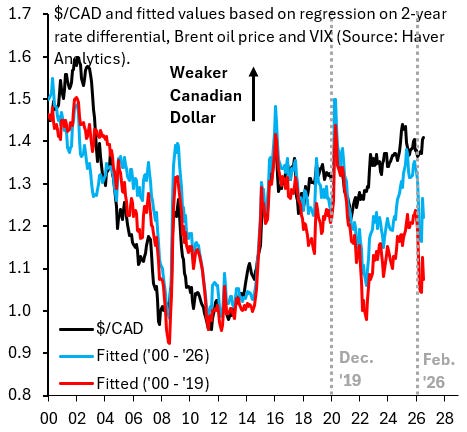
The chart above shows what you get when you regress the $/CAD exchange rate on the 2-year rate differential with the US, the Brent oil price and the VIX, which is the market’s expectation for volatility in the S&P 500 in the coming month. The 2-year differential controls for differences in monetary policy across the US and Canada, while the VIX controls for global risk appetite, which is important as the Canadian Dollar is a high-beta currency that can fluctuate sharply with gyrations in the S&P 500. The black line in the chart above is the actual $/CAD exchange rate, where the Canadian Dollar is weaker the higher this line is. The blue line is the fitted value for the $/CAD exchange rate if you run a regression for the full sample from 2000 to 2026, while the red line is what you get if you run the regression from 2000 to 2019. The reason for the shorter sample is that the correlation between oil and $/CAD clearly breaks around COVID, so the results from the shorter regression highlight just how big this correlation break is. Both regressions suggest that the Canadian Dollar should be a lot stronger than it currently is. I next quantify how significant this decoupling is in statistical terms.
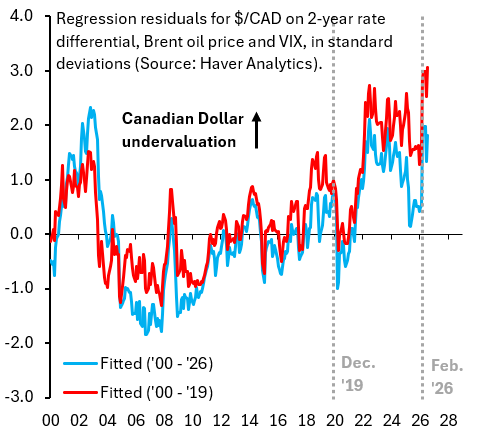
The chart above shows how significant the decoupling of $/CAD from my “fitted” regression lines is. The Canadian Dollar is between two and three standard deviations undervalued relative to where the 2-year differential, the Brent oil price and the VIX put it. The scale of this undervaluation is unprecedented. Something about the loonie has broken and – while it’s tempting to point the finger at Trump tariffs – those aren’t the driver. After all, tariff announcements don’t coincide with the decoupling of the Canadian Dollar from oil. Something bigger and more worrying is going on.
The last thing I’ll say is that the Canadian Dollar isn’t alone in this undervaluation puzzle. Other commodity currencies – that should be doing well given the rise in oil and other commodity prices – are beaten down as well. The Australian Dollar and the Brazilian Real, which I’ve written about extensively, are also in this camp. Something bigger is going on and the Canadian Dollar is just a small piece of the puzzle.