Participants
This is a secondary analysis of the ELICIT cohort16, following infants born between September 2017–18 longitudinally to 18 months of life. The ELICIT study was a randomized 2 × 2 factorial, double-blind, placebo-controlled trial with the aim of improving early life growth using a nicotinamide and/or antimicrobial (azithromycin, nitazoxanide) intervention. Nicotinamide was provided to breastfeeding mothers (250 mg daily tablets for six months post-delivery), followed by direct infant supplementation (100 mg sachets) from six to 18 months.
Here, data from the placebo group (n = 278) and infants receiving nicotinamide (n = 276, breastfeeding mothers provided 250 mg daily tablets for six months post-delivery, followed by direct infant supplementation (100 mg sachets) from six to 18 months) was studied. Urine was sampled at six months, and urine and blood were sampled at 12 and 18 months. A schematic, study design overview and analysis strategy are provided in Figs. S1, S2, and Supplementary Materials (Statistical Analysis Plan), respectively. This study included infants of various nutritional states, including stunted (length-for-age Z-score [LAZ] < −2), underweight (weight-for-age Z-score [WAZ] < −2), and normal growing infants (Supplementary Data. 1). The antimicrobial group was not considered for this analysis, as the biological samples were collected prior to the administration of a single-dose of the antimicrobials at six, 12, and 18 months and their long-term biochemical consequences cannot be excluded. Additionally, receipt of non-study antibiotics was common (54 − 86% infants).
Birth month influences infant metabolome
To determine whether the infant metabolome exhibits patterns dependent upon month of birth, targeted liquid chromatography-mass spectrometry (LCMS)-based metabolomics was performed on plasma samples from infants at 12 months of life from the placebo arm of the ELICIT study (n = 199). Samples were collected from infants born throughout the year (collected from September 2018 to September 2019), and a total of 628 plasma metabolites were measured. Cosinor analysis21 was used to identify molecules whose concentrations followed a seasonal waveform across the population based upon the infant’s month of birth (Fig. 1A–C). A cosine wave with a sloping mesor was fitted to the data using non-linear curve fitting solved by least squares, and statistically compared to H0 of solely a sloping line model using an extra-sums-of-squares F-test. A total of 46 circulating metabolites exhibited birth month dependent variation in their concentrations at 12 months (Supplementary Data. 2). This included choline, trimethylamine-N-oxide (TMAO), eicosapentaenoic acid (EPA), eicosadienoic acid, 17 phosphatidylcholines, six ceramides, three amino acids (aspartate, glutamine, glutamate), 5-aminovaleric acid (5-AVA), γ-aminobutyric acid (GABA), methionine sulfoxide, two cholesterol esters, 3-hydroxyglutaric acid, proline betaine, sphingomyelin C26.1, three hexosylceramides, three triglycerides, and octadecenoylcarnitine. Of these, seven remained significant (choline, TMAO, EPA, methionine sulfate, cer(d18:2/14:0), TG 20:0_34:1 and hex2cer(d18:1/18:0); Figs. 1B, S3)) following adjustment for covariates including enrollment WAZ, socioeconomic status, number of months of exclusive breastfeeding, and maternal factors (weight, height, age) and following correction for multiple testing (q < 0.15; n = 3 for q < 0.10). The birth month of infants with the greatest concentration of each metabolite is determined by the peak phase of the wave. These are provided for each metabolite in Supplementary Data. 3. For example, at 12 months, February-born infants had the highest circulating aspartate, while those born six months later in August had the lowest.
Fig. 1: Systemic and urinary metabolome variation at 6, 12 and 18 months is influenced by the month of birth.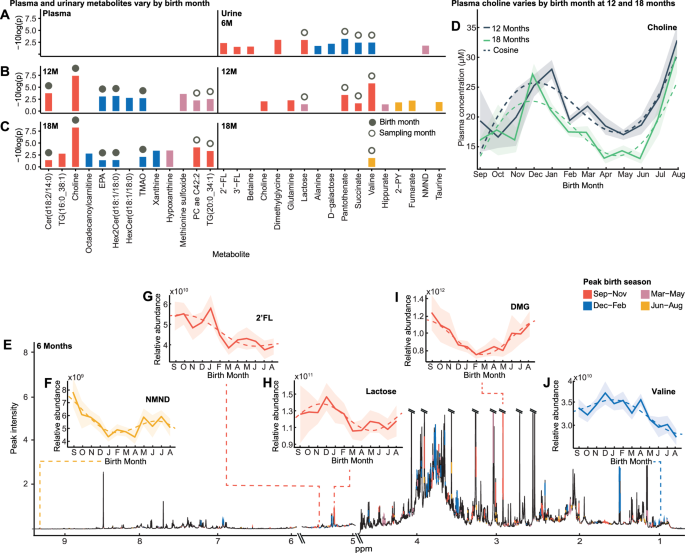
A–C Bar chart of 6-, 12- and 18-month urinary, and 12- and 18-month plasma metabolites that follow a seasonal waveform based upon month of birth, from cosinor analysis (plasma n = 199; urine 6-month n = 278; 12-month n = 270; 18-month n = 266; p < 0.05 & q < 0.15 following Benjamini-Hochberg correction at ≥ one sampling point by extra-sums-of-squares F-test; exact p-values are provided in Supplementary Data. 2, 3). Color indicates birth season of peak abundance (September-November, red; December-February, blue; March-May, pink; June-August, yellow). Solid circle represents birth-month-dependent metabolites (±1.5-month difference between birth month of peak abundance at two sampling points), unfilled circle indicates sampling-month-dependent (>four-month difference). D Mean plasma choline concentration by birth month (bold line; n = 199) at 12 (gray) and 18 months (green) following cosine distribution (dashed line) with 95% CI overlaid (shaded). E Median 1H NMR six-month urinary metabolic spectral profile (n = 278). Metabolites identified to significantly fit cosine waveforms based upon birth month are colored by birth season of peak abundance. Urinary metabolite relative abundance obtained by integrating the area under spectral regions. F–J Examples of urinary metabolites at six months that follow a cosine distribution (dashed line) by birth month. Mean relative abundance with 95% CI overlaid (shaded). Source data are provided as a Source Data file. EPA, eicosapentaenoic acid; TMAO, trimethylamine N-oxide; 2-PY, N-methyl-2-pyridone-5-carboxamide; NMND, N-methyl nicotinamide; 2’-FL, 2’-fucosyllactose; 3’FL, 3-fucosyllactose; DMG, dimethylglycine.
To determine if these metabolic cycles were driven by contemporary pressures at 12 months of life (i.e., time of sampling) or a legacy of the month of birth, plasma was sampled six months later at 18 months. Several plasma metabolites exhibited circannual patterns across the infants at 18 months (n = 27; n = 6 following FDR correction (q < 0.15; n = 5 for q < 0.10) and adjustment for confounders; Fig. 1C, Fig. S3 and Supplementary Data. 3). Metabolites whose peak phase remained static between sampling points (±1.5-months to account for season) were considered to be influenced by time of birth (Fig. S1). For instance, choline is birth-month-related as November-December born infants persistently had the highest circulating choline at 12 and 18 months, while those born May-June had the lowest (Fig. 1C). These patterns were maintained despite variable pressures across these sampling points, including food insecurity and rainfall. Conversely, metabolites influenced by sampling time were identified as those with a ~six-month (four-eight months) phase difference between the 12- and 18-month samples and so exhibit seasonal variation within individuals (Fig. S1). Interestingly, 12 plasma metabolites exhibited seasonal patterns at both sampling points including choline, TMAO, EPA, glutamate, eicosadienoic acid, cer(d18:2/14:0), hex2cer(d18:1/18:0), TG(20:0_34:1), octadecenoylcarnitine, methionine sulfoxide, and three phosphatidylcholines (PC ae C42:2, PC ae C42:3, PC ae C40:2). Of these, seven remained significant following FDR correction in at least one time point. Here, there were five birth-month-related metabolites including choline, TMAO, EPA, hex2cer(d18:1/18:0), and cer(d18:2/14:0), and two sampling-month-dependent metabolites, TG(20:0_34:1) and PC ae C42:2 (Fig. S3). After adjustment for covariates (enrollment WAZ, socioeconomic status, number of months of exclusive breastfeeding, and maternal factors (weight, height, and age), the variation in EPA and hex2cerd(18:1/18:0) was no longer significant at 18 months.
Additionally, untargeted 1H-nuclear magnetic resonance (NMR) spectroscopy-based metabolomics was performed on urine samples collected from the placebo group infants at six, 12, and 18 months of life (six-month, n = 278; 12-months, n = 270; 18-months, n = 266; Fig. 1A–C). At six months (Fig. 1E), 11 urinary metabolites were identified to exhibit variation across the infants based upon the month in which they were born. These included N-methyl nicotinamide (NMND; Fig. 1F), pantothenate (vitamin B5), breastmilk-related metabolites (HMOs (2’-fucosyllactose (2’-FL; Fig. 1G), 3’-fucosyllactose (3’-FL)), lactose (Fig. 1H), and D-galactose), betaine, dimethylglycine (DMG; Fig. 1I), valine (Fig. 1J), alanine, and succinate. Of these nine remained significant when and adjusted for the covariates enrollment WAZ, number of months of exclusive breastfeeding, maternal age and socioeconomic status (pantothenate, dimethylglycine, lactose, succinate, valine, 2’-FL, NMND, D-galactose, and 3’FL) and corrected for multiple testing (q < 0.15; n = 4 for q < 0.10; Figs. 1A, S4 and Supplementary Data. 3). Interestingly the seasonality was dampened in the HMO 2’-FL when adjusted for maternal body composition (weight, height). Additionally, at 12 months, the excretion of four metabolites significantly varied by birth month (q < 0.15; n = 4 for q < 0.10; Fig. 1B, Supplementary Data 3). The peak phases of three metabolites, valine, pantothenate and succinate, shifted by ~six months between sampling points and so were considered sampling-month-dependent.
A PCA model was constructed with the seasonal metabolites to compare infants born during different three-month windows (e.g., Sep-Nov, Dec-Feb, Mar-May, Jun-Aug) at six, 12 and 18 months. Permutational multivariate analysis of variance (PERMANOVA) confirmed significant metabolic differences between the windows (adonis p = 0.001–0.04, Fig. S5). Similarly, significant pairwise PLS-DA models were obtained comparing seasonal metabolites across infants born in opposing time windows (AUC 0.67–0.88; Fig. S5; metabolite VIP scores listed in Supplementary Data. 4). For metabolites identified as exhibiting seasonal variation across the population, the mean concentrations and abundances by birth season are provided in Supplementary Data. 5.
After stratifying by sex, no plasma or urine metabolites exhibited circannual patterns in the females, while two, 17, and six metabolites were noted in the males at six, 12 and 18 months respectively after FDR and covariate adjustment (enrollment WAZ, socioeconomic status, number of months of exclusive breastfeeding, and maternal factors (weight, height, age)) (Fig. S6, Supplementary Data. 6; for q < 0.10, 6 M n = 1; 12 M n = 11; 18 M n = 5). Here, plasma choline and TMAO and urinary D-galactose were noted to be birth-month-dependent metabolites in males, while urinary pantothenate and lactose were sampling-month dependent.
Metabolomic seasonality on cognition
To determine the developmental significance of this biochemical seasonality, we explored relationships with cognitive outcomes. Child development was evaluated at 18 months using the Malawi Development Assessment Tool (MDAT)22. This assessed gross and fine motor, language, and social skills. Cosinor analysis identified that language scores (R2 = 0.24) and total MDAT (R2 = 0.13) measured at 18 months varied across infants by birth month, where those born in January and February respectively had the greatest scores (Fig. 2A). When stratified by ‘Water and sanitation, Assets, Maternal education and household Income’ (WAMI) scores23, a measure of socioeconomic status, this pattern persisted only in those with the top 50% scores (R2 = 0.22). When stratified by sex, this variation was only observed in the female population (R2 = 0.31). Cross-correlation analysis identified seven seasonal 12-month plasma metabolites that significantly correlated with language scores six months later (Fig. 2B, Supplementary Data. 7). Those infants with the greatest language scores had the highest circulating TMAO (Fig. 2C), EPA (Fig. 2D), PC ae C42:2, TG(20:0_34:1), methionine sulfoxide, hex2cer(d18:1/18:0) and hexcer(d18:1/18:0) at 12 months.
Fig. 2: Influence of birth seasonality on cognitive outcomes and related metabolites.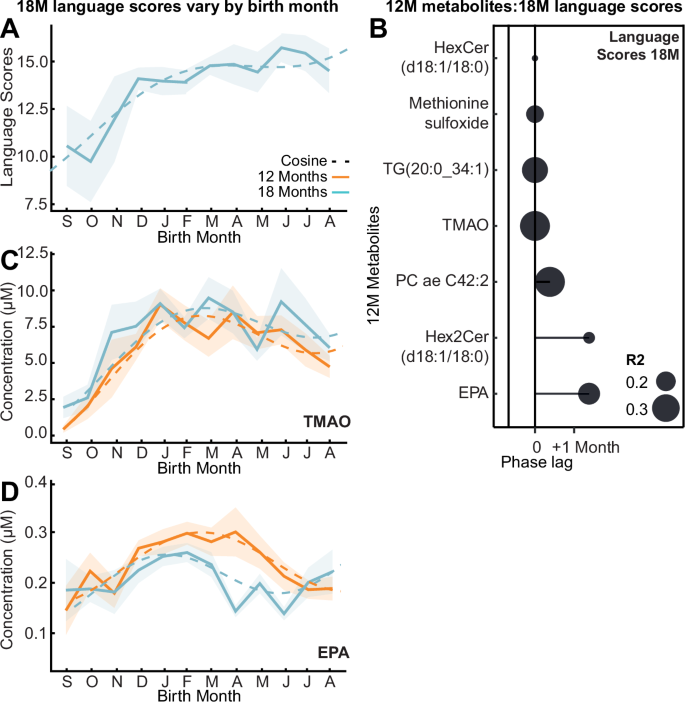
A Mean language MDAT (Malawi Developmental Assessment Tool) score by birth month at 18 months (bold line; n = 199) following cosine distribution (dashed line; p = 0.0006) with 95% CI overlaid (shaded). B Lollipop plot visualizing phase lags (months) between birth month of greatest 18-month language MDAT scores and greatest seasonal 12-month plasma metabolites (n = 199; Benjamini-Hochberg corrected q < 0.05; exact p-values are provided in Supplementary Data. 7) from cross-correlation analysis. Size indicates R2. C, D Mean concentration of plasma trimethylamine N-oxide (TMAO) and eicosapentaenoic acid (EPA) by birth month (bold line; n = 199) following cosine distribution (dashed line) at 12 (orange) and 18 months (blue) with 95% CI overlaid (shaded). Source data are provided as a Source Data file.
Environment shapes seasonal metabolites
Next, we explored whether fluctuating nutritional availability during early life contributed to this metabolic seasonality. Birth anthropometry reflects environmental and nutritional pressures faced by the mother-fetus prior to and during pregnancy and relates to long-term growth outcomes24. We have previously shown that infants born in the five-month preharvest period (November-March 2017–2018) had lower enrollment weights than those born in the seven months post-harvest (April to October)18. However, enrollment WAZ and LAZ did not follow 12-month seasonal waveforms, even after stratifying by WAMI.
As rainfall contributes to harvest yield, seasonality analysis was applied to Haydom rainfall data from the prenatal year (2016–2017), birth year (2017–2018) and to the 8-year average (2010–2018) (Fig. 3A). All measures significantly fitted a seasonal waveform with peak phases (highest rainfall) in January-February, reflecting annual climatic patterns. Similarly, monthly maternal food insecurity reports across an 18-month period from birth (reported as worry; expressed as % mothers) also followed a seasonal waveform peaking in January (Fig. 3B). These food insecurity patterns occur as harvest stocks deplete and food prices rise during the rainy season (November-May)14,25. Conversely, the dry season (June-October) associates with reduced food insecurity following the harvest of beans in March and maize in May (Fig. 3B). Interestingly, rainfall in the previous year cross-correlated with reported food insecurity (S.Text.1).
Fig. 3: Annual variation in environmental factors across pre- and postnatal periods contributes to metabolic seasonality.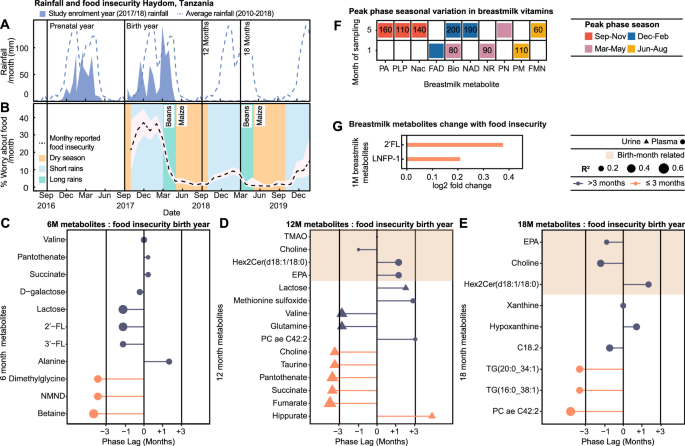
A Mean monthly (shaded) and 8-year average rainfall (dashed line) in Haydom, Tanzania. B Mean monthly food insecurity (% mothers worried about food availability; black line; 95% CI shaded) reported over an 18-month period following enrollment. Annual patterns of rain and harvests highlighted (dry season, yellow; short rains, blue; long rains, green). C–E Lollipop plots displaying phase lags between peak food insecurity during birth year (January 2018) and the birth month of greatest plasma and urinary metabolite abundance at 6 (n = 278), 12 (n = 270) and 18 months (n = 266; q < 0.05) from cross-correlation. Color indicates phase lag (>3 months, purple; ≤3 months, pink); shape indicates source (urine, triangle; plasma, circle), and size R2. Shaded area highlights birth-month-dependent metabolites. F Heatmap of 1- and 5-month breastmilk metabolites displaying seasonality based on sampling month from cosinor analysis (n = 292; q < 0.15). Colors indicate highest abundance sampling season (September-November, red; December-February, blue; March-May, pink; June-August, yellow). Values indicate phase lags (days) between peak food insecurity and peak metabolite abundance from cross-correlation (q < 0.05). G) Bar chart visualizing log2 fold change of 1-month breastmilk metabolite expression by reported food insecurity at sampling (No n = 40; yes n = 14). Differences assessed by two-sided Wilcoxon test with Benjamini Hochberg correction for multiple testing (q < 0.05; 2-fucosyllactose (2’FL) p = 0.0004; lacto-N-fucopentaose I (LNFP-1) p = 0.0006). Source data are provided as a Source Data file. FAD flavin adenine dinucleotide, FMN flavin mononucleotide, PLP pyridoxal phosphate, Nac nicotinic acid, Pa pantothenic acid, NAD nicotinamide adenine dinucleotide, NR nicotinamide riboside, PM pyridoxamine, PN pyridoxine, GABA γ-aminobutyric acid, 3’FL 3-fucosyllactose, NMND N-methylnicotinamide, EPA eicosapentaenoic acid, C18.2, octadecadienylcarnitine.
To explore the influence of maternal food insecurity at birth on these seasonal metabolites sampled at 6–18 months of life, cross-correlation analysis was performed. Phase lag represents the time difference between the month of peak food insecurity and the birth month of peak metabolite abundance (Fig. S1). Four birth-month-related metabolites (consistent pattern between sampling times) significantly correlated with food insecurity, including choline, TMAO, hex2Cer(d18:1/18:0), and the omega-3 PUFA EPA. Minimal phase lags (0–40 days) were observed between their peak abundances and peak food insecurity at birth, and this pattern persisted at 12 and 18 months for choline, hex2Cer(d18:1/18:0), and EPA (Fig. 3D, E, Supplementary Data. 8). These were all highest in infants born during peak food insecurity (November-February). Additionally, food insecurity at birth cross-correlated with several seasonal metabolites at six and 12 months with a range of phase lags (Fig. 3C, D, Supplementary Data. 8 and S.Text.2). Several metabolites displayed the highest abundance in infants born during periods of minimal food insecurity, with a ~six-month phase lag. At six months, this included the urinary excretion of NMND, a marker of nicotinamide availability used in NAD+ synthesis; betaine and DMG. Several metabolites also aligned with contemporary food insecurity at the time of sampling (Fig. S7A–C, Supplementary Data. 9 and S.Text.3).
Seasonal variation in breastmilk
In total, 81% of infants were exclusively breastfed up to six months of life, and seasonal food insecurity patterns acted indirectly on the infant via breastmilk throughout this period. We therefore explored breastmilk composition seasonality at the vitamin, HMO and metabolome-lipidome level. Of those exhibiting seasonality across the population, the mean metabolite concentration per season is documented in Supplementary Data. 10.
A total of 19 B vitamin-related metabolites were measured in breastmilk from 292 mothers, sampled at one- and five-months post-partum. Cosinor analysis identified four metabolites at one-month, and seven at five months that displayed seasonality based on sampling month, which persist following correction for multiple testing (Fig. 3F, Supplementary Data. 11). Of these, one metabolite exhibited seasonality at both sampling times, where biotin (vitamin B7) was consistently highest from mothers who delivered in April (sampled May at one month and September at five months), a period of increasing food availability following the bean harvest in March. Nicotinamide riboside (NR) and nicotinic acid (NAc), precursors involved in the NAD+ synthesis pathway, exhibited seasonality in breastmilk. NR at one-month, and NAD+ at five months, were highest in milk from mothers delivering in April (NR sampled May, NAD+ sampled September), whilst NAc was greatest in five-month breastmilk collected from mothers sampled in July.
The metabolomic-lipidomic signatures of a subset of breastmilk samples (54 individuals) collected at one- and five-months post-partum were characterized alongside their HMO profiles (19 compounds). Due to low sample size, cosinor analysis could not be implemented. Samples were therefore grouped by season of sampling (Sep-Nov, Dec-Feb, Mar-May, Jun-Aug) and variation was assessed by ANOVA or Kruskal-Wallis, and post-hoc tests (FDR adjusted). Mothers sampled between September – November were observed to have the greatest 2’-FL, lacto-N-fucopentaose I (LNFP-1) and glutamine in their milk at one-month postpartum. Additionally, 2’-FL and LNFP-1 were greatest in five-month milk sampled from mothers in June-August (Supplementary Data. 12). Interestingly, no birth-month-related metabolites (choline, TMAO, EPA, hex2cer(d18:1/18:0), and cer(d18:2/14:0)) were observed to fluctuate across the year in the breastmilk, suggesting intake via breastmilk does not directly drive these alterations (Fig. S8).
We next assessed the impact of the nutritional environment of the mother on the breastmilk metabolome. Cross-correlation was performed between seasonal breastmilk B-vitamin-related metabolites and contemporary food insecurity. (Fig. 3F, Supplementary Data. 13). Short phase lags (10–90 days) were noted between peak food insecurity and maximal breastmilk biotin, and NR at one-month and flavin mononucleotide, at five months. Metabolites most abundant in milk sampled during periods of high food availability (110–200 days phase lag from peak food insecurity) included pyridoxamine at one-month; pantothenic acid (vitamin B5), Nac, NAD, pyridoxal-5-phosphate, and biotin, at five months.
To assess the impact of food insecurity on the breastmilk metabolome and HMOs measured from the subset of mothers, we explored biochemical variation in the season-dependent metabolites associated with contemporary maternal food insecurity reports (No food insecurity [n = 40], reported food insecurity [n = 14]; Wilcoxon test q < 0.05; Fig. 3G, Supplementary Data. 14). At one-month, 2’-FL and LNFP-1 were lower in milk from mothers who did not report food insecurity. At five months, only three mothers from this subset reported food insecurity; therefore, statistical analysis was not performed. Additionally, to explore transmission of these seasonal patterns to the infant, cross-correlation analysis compared five-month breastmilk vitamins and six-month urinary metabolites. Significant correlations were observed with a range of phase lags (Fig. S9, Supplementary Data. 15). These included no phase lag between pantothenic acid in the five-month breastmilk and the six-month urine, with the greatest abundance of this vitamin noted in February/March-born infants. This demonstrates the imprinting of seasonal patterns in breastmilk composition on the metabolic signatures of the infant.
Breastfeeding has been associated with increased cognitive development26, therefore, relationships between season-dependent breastmilk metabolites and cognitive outcomes were explored (Spearman’s rank correlations; q < 0.05; Fig. S10, Supplementary Data. 16). Here, 18-month language scores were negatively associated with two seasonal breastmilk metabolites, 2’-FL and LNFP-1, at one and five months.
Metabolomic seasonal variation on growth
As with enrollment anthropometry, no significant seasonal waveforms were detected across anthropometric measures (LAZ, WAZ, HCZ [head circumference-for-age Z-scores], and MAZ [mid-upper arm-for-age circumference (MUAC) Z-scores]) by birth month from three-18 months (Supplementary Data. 17). We next assessed relationships between seasonal metabolites and growth measures (WAZ and LAZ) (Fig. S11, Supplementary Data. 18). Correlation analysis found a trend for a positive linear relationship between six-month urinary NMND and six-month LAZ (p = 0.007; q = 0.08). This was confirmed using time series analysis, where infants persistently in the top tertile for urinary NMND excretion at six-, 12-, and 18-months experienced a less pronounced drop in LAZ growth trajectory from zero-18 months of life (p = 0.001, 95% CI: p = 0.0002, 0.006; Fig. 4A).
Fig. 4: Nicotinamide availability influences infant growth and can be improved through maternal and infant supplementation.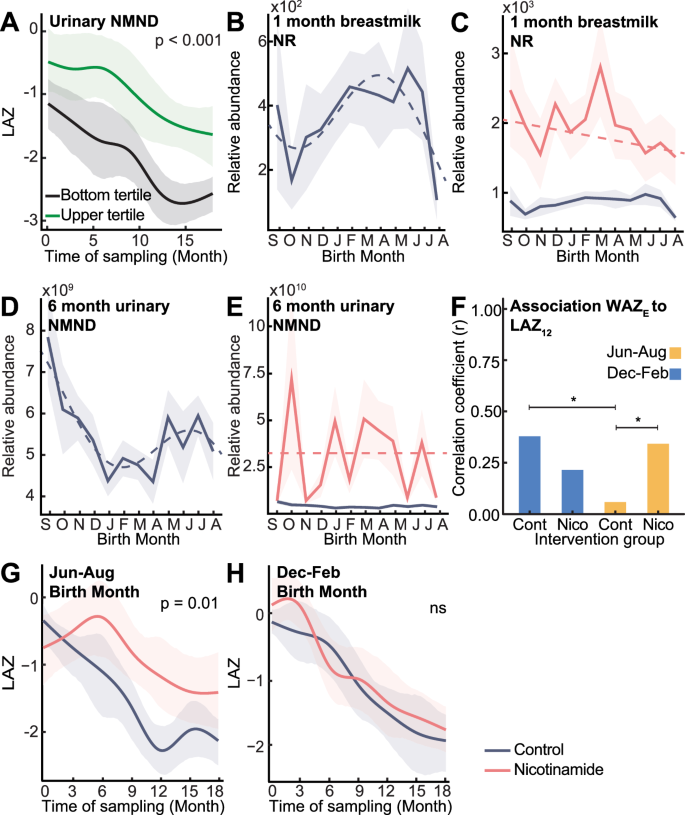
A Differences in 0–18-month LAZ (length-for-age Z-score) of non-supplemented infants persistently in upper (n = 22; green) and lower (n = 16; black) urinary N-methyl nicotinamide (NMND) tertiles (6, 12 and 18 months) assessed by time series analysis. Mean relative abundance of (B, C) 1-month breastmilk nicotinamide riboside (NR) and (D, E) 6-month urinary NMND following cosine (dashed line) with 95% CI (shaded) in control infants (NR n = 292, NMND n = 278; purple) and nicotinamide supplemented (NR n = 295, NMND n = 276; pink), colored by intervention group. F Correlation coefficient between enrollment WAZ (weight-for-age Z-score; WAZE) and 12-month LAZ (LAZ12) for control and nicotinamide-supplemented infants, colored by birth season (December-February, blue; June-August, yellow). Significance from Fisher’s Z-transformation comparing correlation coefficients (two-sided Z-test; December–February control vs June–August control, p = 0.025; June–August control vs nicotinamide, p = 0.044; * indicates p < 0.05; Nicotinamide December–February born n = 114, control n = 116; nicotinamide June–August born n = 55, control n = 55). G, H LAZ trajectories from 0–18 months for children in the top enrollment WAZ tertile (WAZ ≥ −0.13) born in June–August (nicotinamide n = 21, control n = 18) and December–February (nicotinamide n = 30, control n = 21) assessed by time series analysis. Group mean trajectories (solid line; colored by group) with 95% CI (shaded area); p-values from permutation test on the area between group mean curves (1000 permutations; June–August p = 0.013). Source data are provided as a Source Data file.
Supplementing infants with nicotinamide
Given the positive associations between urinary NMND and postnatal growth5, the impact of nicotinamide supplementation on infant anthropometry was assessed in this setting as part of the ELICIT RCT (nicotinamide group)16,17. Mothers (n = 298) received 250 mg daily nicotinamide tablets for six months post-delivery while breastfeeding, followed by direct infant supplementation (100 mg sachets) from six to 18 months. Maternal nicotinamide supplementation significantly increased breastmilk NR and ablated the seasonal variation of this metabolite (Figs. 4B, C, S12A-B). Additionally, six-month NMND excretion by the infants of supplemented mothers was increased, and the seasonality was lost (Figs. 4D, E, S12C). Despite these metabolic changes, nicotinamide supplementation did not alter anthropometry between the supplemented infants and those not receiving nicotinamide17.
We next explored the influence of seasonality on the effectiveness of supplementation. December-February-born infants experienced low food insecurity from three to nine months old. These infants show a strong relationship between enrollment WAZ and 12-month LAZ (n = 116; r = 0.38, q < 0.001; Figs. 4F, S13), indicating that when food is not limiting, the starting weight of the infant influences future growth. This observation was not significant when infants from the lower 50% socioeconomic status were compared (Fig. S13). Conversely, June-August born infants (n = 55) experience high food insecurity during this same developmental window as harvest stocks deplete. Here, no relationship between enrollment WAZ and 12-month LAZ was observed, independent of socioeconomic status (Fisher’s Z-test p = 0.025; Figs. 4F, S13). This indicates that when food is scarce, enrollment weight has a limited influence on future growth. However, nicotinamide supplementation in infants born during this window did restore a positive correlation between enrollment WAZ and 12-month LAZ (n = 55; r = 0.34, correlation q = 0.046; Fisher’s Z-test p = 0.044; Fig. 4F). This demonstrates that supplementation may have ameliorated the impact of limited nicotinamide intake on growth.
Importantly, the enrollment status of the infant determined the efficacy of nicotinamide supplementation. As enrollment WAZ was observed to influence future growth, infants were stratified into enrollment WAZ tertiles. A two-way ANOVA and Tukey post-hoc tests were performed to investigate how birth season influences the impact of nicotinamide supplementation on infant growth (change in LAZ from enrollment to 18 months). Considering only infants in the upper tertile for enrollment WAZ (WAZ ≥ −0.13), a significant interaction was observed between birth season and nicotinamide supplementation in association with infant growth (p = 0.024, Supplementary Data. 19), which was not present in those with lower enrollment weights. Time series analysis confirmed these findings, where nicotinamide supplementation in June-August born infants (i.e., those who enter increasing food insecurity at three to nine months of age) significantly reduced the drop in LAZ over 18 months compared to matched infants born in the same period not receiving supplementation (p = 0.013; supplemented n = 19, not supplemented n = 26; Fig. 4G). This improvement was not seen for December-February born infants (i.e., those experiencing decreasing food insecurity at three to nine months of age) with the same enrollment weights (supplemented n = 35, not supplemented n = 28; Fig. 4H). This highlights that the effectiveness of nutritional interventions can be influenced by the season of provision, shaped by environmental pressures and inherent metabolic states.