Type 2 diabetes (T2D) is becoming a major public health concern in Africa, congruent with the complex interplay of genetic, environmental and socioeconomic factors1,2,3. According to the International Diabetes Federation, it is predicted that, globally, people with T2D will rise by 51%, reaching 700.2 million by 2045 from 463 million in 20194. A substantial increase of 143% is anticipated in Africa, with numbers expected to rise from 19.4 million in 2019 to 47.1 million in 20454. Hemoglobin A1c (HbA1c), also known as glycated hemoglobin5, provides an estimate of the blood sugar level over a period of 2–3 months by measuring the percentage of hemoglobin with attached glucose6,7. An HbA1c level of 6.5% or higher on two separate tests typically indicates diabetes. Levels between 5.7% and 6.4% suggest prediabetes, and values below 5.7% are considered normal8. Combining proteomic and genomic data for blood-based protein quantitative trait loci (pQTLs) has identified hundreds of associations between genetic variants and protein levels9,10,11,12,13. A fraction of individuals with African ancestry in the diaspora has been studied in proteomics studies to date12,14, with continental Africans largely underrepresented.
To address this, we measured 2,873 proteins using the Olink PEA Explore assay in the plasma samples of 163 individuals with prediabetes or T2D (cases) (defined as HbA1c > 5.7%) and 362 normoglycemic controls (defined as HbA1c < 5.7%) (Table 1) from a subset of the Uganda Genome resource, hereafter referred to as Uganda Genome Resource Proteomics Data (UGR-PD). We performed differential protein expression analysis between the two groups and carried out proteomic genetic association analysis to identify sequence variants influencing protein levels. We subsequently examined the role of the identified pQTLs in T2D using colocalization and Mendelian randomization (MR) analyses.
Table 1 Clinical characteristics of the study participants
First, we studied the association between protein levels and cardiometabolic traits measured in the UGR-PD (Supplementary Table 1). A total of 208 proteins were associated with HbA1c, 42 with high-density lipoprotein (HDL) and 46 with low-density lipoprotein (LDL) at a false discovery rate (FDR) of 5% (Fig. 1). Some of the associations, such as ERCC1 found to be associated with HbA1c (Padj = 6.77 × 10⁻⁷) and HDL (Padj = 1.91 × 10⁻²), have been shown to affect glucose intolerance in a progeroid-deficient animal model causing an autoinflammatory response that leads to fat loss and insulin resistance15.
Fig. 1: Association of protein levels with clinical traits.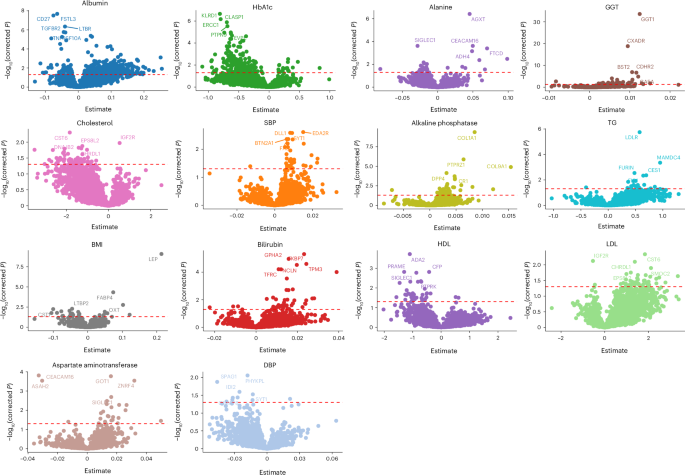
The y axis represents the association’s FDR-adjusted −log10(P); the x axis of each plot represents the effect size estimated using linear regression. The horizontal red dashed line indicates the multiple testing adjusted significance threshold with associations above the line considered statistically significant. GGT, gamma-glutamyl transferase; SBP, systolic blood pressure.
Next, we sought to identify differentially expressed protein (DEP) levels between cases and controls. DEPs were defined based on a twofold change (log2(fold change) > 0.5) in expression levels at an FDR of 5%. This led to the identification of 88 DEPs. Among these, 57 were significantly upregulated, with log2 fold changes ranging from 0.50 to 1.18, while 31 proteins were downregulated with log2 fold changes between −0.51 and −1.17 (Fig. 2a and Supplementary Table 2). EGF-like repeats and discoidin I-like domains 3 (EDIL3), associated with processes such as cell adhesion, migration and vascular development, showed the most significant upregulation with Padj 1.2 × 10⁻¹³. EDIL3 is differentially expressed in the adipose tissue of insulin-resistant and insulin-sensitive individuals16,17, and is involved in angiogenesis18,19,20. Impaired angiogenesis has been implicated in the progression of diabetic retinopathy and nephropathy21,22. The DEPs were primarily enriched in Gene Ontology terms such as chemokine receptor binding and chemokine and cytokine activity (Supplementary Table 3). We further compared cases and controls with regard to adipokines, biomarkers of obesity and proteins linked to pancreatic function before and after adjusting for obesity to disentangle obesity-driven signals from those independently associated with diseases status (Fig. 2b). In cases of the unadjusted model, leptin (LEP) was significantly upregulated compared to controls (log(fold change) = 0.759, Padj = 1.62 × 10⁻⁵). C-X-C motif chemokine ligand 5 (CXCL5) showed the highest upregulation in cases (log(fold change) = 1.056, Padj = 1.76 × 10⁻⁷). Resistin and interleukin-18 were significantly downregulated in cases compared to controls (log(fold change) Padj = −0.292, 8.51 × 10⁻³ and −0.367, and 5.89 × 10⁻⁴, respectively). Additionally, angiopoietin-like protein 2 was elevated in cases (log(fold change) = 0.426, Padj = 0.00153), while inflammatory markers such as tumor necrosis factor and interleukin-6 showed nonsignificant expression level differences between cases and controls. However, upon adjusting for obesity, CXCL5 and LEP were attenuated indicating that their expressions may be mediated by obesity (Fig. 2b).
Fig. 2: Proteomic profiling identifies differentially expressed proteins linked to type 2 diabetes.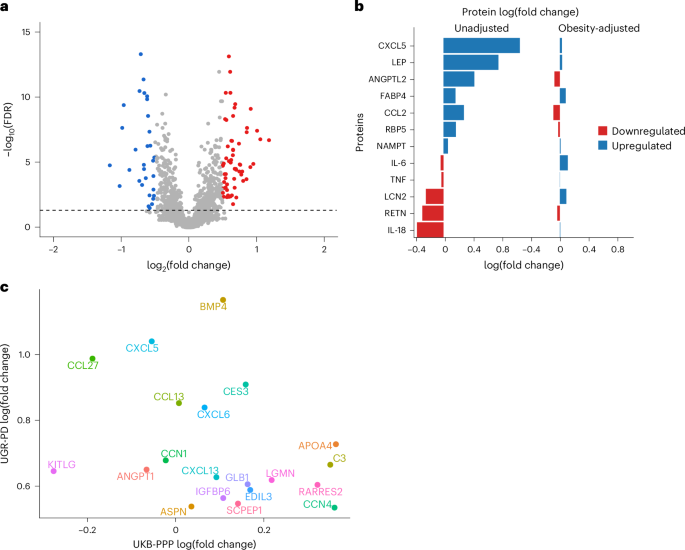
a, Volcano plot showing DEPs, with significantly overexpressed proteins annotated in red and downregulated proteins in blue, using a linear model implemented in limma. The black horizontal dashed line represents the −log10(FDR) cutoff corresponding to a 5% false discovery rate. b, Comparison of cases and controls with regard to adipokines and other proteins that are biomarkers of obesity and central adiposity before and after adjusting for obesity. The log(fold change), a measure of protein expression changes between patients with T2D and controls, was calculated as the base-2 logarithm of the ratio of the mean expression in patients with T2D to the mean expression in controls. c, Scatter plot of the comparison of the top significant DEPs with UGR-PD on the y axis and UKB-PPP on the x axis.
The comparison of significant DEPs in UGR-PD with the same set of proteins in the UK Biobank Pharma Proteomics Project (UKB-PPP) using the T2D definition described in ref. 23 (ncases (T2D) = 2,461 and ncontrols = 50,553) showed some population-specific differences (log(fold change)). For instance, proteins such as apolipoprotein F (APOF), tumor necrosis factor superfamily member 12 and lipoprotein lipase (LPL) are significantly upregulated in patients with T2D compared to controls in the UGR-PD but not in the UKB-PPP. lysophosphatidylcholine acyltransferase 2 and interleukin-8 are more strongly downregulated in patients with T2D compared to controls in the UGR-PD. Proteins such as prolylcarboxypeptidase, LEP, EDIL3 and apolipoprotein A-IV (APOA4) showed the same trend of expression between patients with T2D and controls in the two populations (Fig. 2c).
Among the significant DEPs in the UGR-PD, eight have T2D-associated genome-wide association study (GWAS) hits within 40 kb (Table 2), although none of the significant DEPs showed evidence of colocalization with T2D. The association of these proteins with T2D and the nearby GWAS signals strengthens the hypothesis that these proteins could have a causal or mediatory role in the pathophysiology of T2D in this population.
Table 2 Significant DEPs with a T2D GWAS hit within 40 kb of the transcription site of the gene encoding the protein
After quality control, we undertook pQTL analysis with up to 15.8 million imputed variants with a minor allele frequency (MAF) > 0.05 for 2,873 proteins. We identified 399 independent associations after multiple testing correction at P value thresholds of P < 1.46 × 10⁻⁶ and P < 2.2×10⁻¹⁰ for cis- and trans-pQTLs, respectively (Supplementary Table 4). We identified 346 (86.7%) cis-pQTLs and 53 (13.3%) trans-pQTLs. Seven proteins had both cis-pQTLs and trans-pQTLs. We also identified four trans-pQTLs located within a pleiotropic locus.
To determine the uniqueness of the pQTLs identified in the UGR-PD, we compared them against the pQTLs of 47 genome-wide pQTL studies (Supplementary Table 5). We identified six independent cis-pQTLs and 31 independent trans-pQTLs that were not previously reported in any population (Supplementary Table 6), and 362 pQTLs reported in prior studies (Supplementary Table 7). We compared our pQTL findings against the African ancestry data of the UKB-PPP and found that 16.7% (58 of 346) of the discovered cis-pQTLs and all trans-pQTLs have not been reported previously (Supplementary Table 8). We tested the conditionally independent UGR-PD pQTLs for replication in the UKB-PPP. Of the 399 pQTLs, we were able to test 392 in the UKB-PPP data. Of these, 303 replicated at P ≤ 1.2 × 10⁻⁴ (Bonferroni-corrected threshold) and 270 also had the same effect estimate direction (Supplementary Table 9).
We examined the relevance of the previously identified pQTLs with T2D and associated risk factors, such as lipid traits, blood pressure and cardiovascular disease, by cross-referencing with the GWAS Catalog and ref. 24. Of the 362 previously identified pQTLs (Supplementary Table 7), six were associated with T2D or T2D-related traits (Supplementary Table 10).
One hundred and fifty-one identified pQTLs overlapped or fell within a 500-kb window of T2D-associated GWAS variants (Supplementary Table 11). Only one of these pQTLs (rs6075339) colocalized with a T2D signal. rs901886 (ICAM5) located on chromosome 9 overlapped with multiple T2D-associated variants, including rs74956615 and rs34536443, which have been implicated in immune regulation and inflammation25,26, processes known to contribute to T2D pathophysiology. rs62068711 (DPEP1) on chromosome 16 also overlaps with rs12920022, a variant previously linked to T2D risk27, suggesting a potential role of dipeptidase-related pathways in glucose metabolism. Furthermore, a pleiotropic pQTL, rs532436, identified near SELE, IL-7R and ALPI in our study is also associated with a GWAS hit (rs529565) for ABO protein levels28. The association of rs532436 with multiple proteins (for example, ABO, SELE, IL-7R) suggests that this variant may affect upstream regulatory mechanisms (for example, transcription factor binding, chromatin accessibility) influencing the expression of multiple genes (Fig. 3).
Fig. 3: Three-dimensional Manhattan plot of identified cis-pQTLs.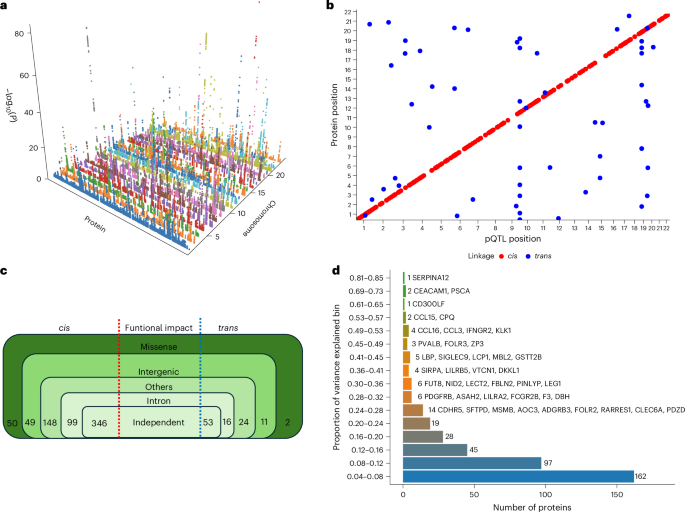
a, Proteins are shown on the x axis, chromosome location is shown on the y axis and the −log10(P) of each association is shown on the z axis. b, Scatter plot of pQTL variant location against the location of the gene encoding the target protein. Each dot represents an independent variant. cis-pQTLs are colored in red, while trans-pQTLs are colored in blue. A multiple testing correction threshold was used for both cis and trans-pQTLs. c, Summary of the identified pQTLs showing their functional consequences. d, Proportion of variance explained by the conditionally independent pQTLs categorized into bins.
Next, we performed colocalization analysis to determine the shared risk variants between pQTLs and T2D using a large multi-ancestry GWAS29. We found one colocalizing signal with strong evidence for a shared T2D risk variant. Specifically, we observed a posterior probability (PP4 = 95.5%) for colocalization between a T2D-associated variant and a pQTL (rs6075339) regulating the expression of the signal regulatory protein alpha (SIRPα) protein (Fig. 4a,b). Genetic studies have implicated SIRP signaling in diabetes pathogenesis. For example, a single-nucleotide polymorphism in human SIRPγ, encoding a SIRP family receptor that also binds CD47, was associated with type 1 diabetes30.
Fig. 4: LocusZoom plots of the colocalizing SIRPα pQTL and T2D risk variant.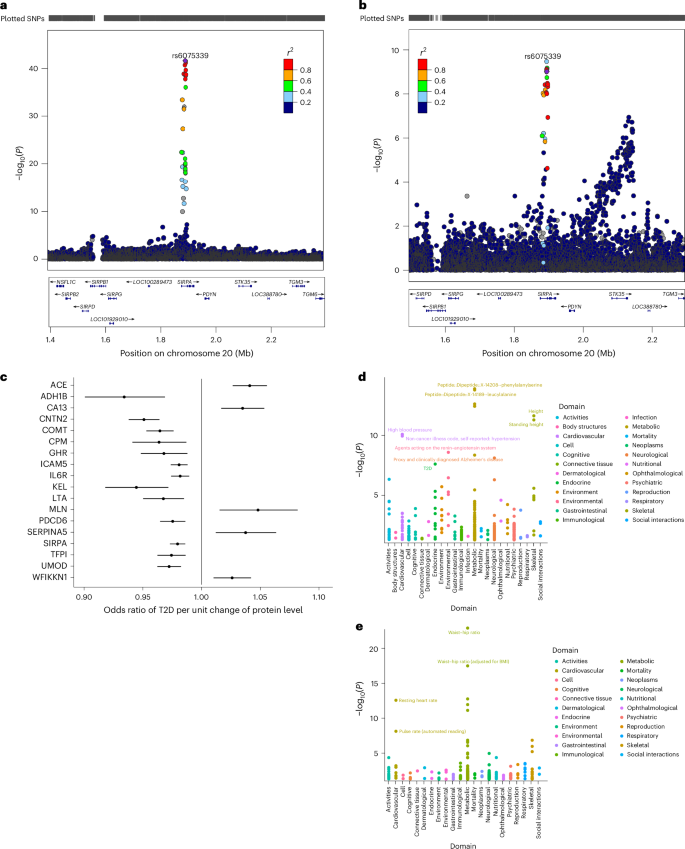
a,b, LocusZoom plots of the colocalizing SIRPα pQTL (a) and T2D risk variant (b). Top: T2D GWAS P values. Bottom: pQTL P values for the same region. c, MR forest plot for proteins causally associated with T2D. The effect estimates represent the odd ratio of T2D per unit change of protein level and the error bars represent the 95% confidence intervals around the estimated effects. These were estimated using a Wald ratio estimate. d,e, PheWAS plots for TFP1 (d) and ACE (e). SNP, single-nucleotide polymorphism.
We undertook an MR analysis to examine the causal relationship between the identified cis-pQTLs and T2D. We found 18 proteins to be causally associated with T2D. Our MR results showed that genetically increased angiotensin-converting enzyme (ACE), CA13, MLN, SERPINA5 and WFIKKN1 levels were associated with an increased risk of T2D. Proteins such as ADH1B, CNTN2, COMT, CPM, GHR, ICAM5 and ILR6 showed a protective effect on T2D risk (Fig. 4c and Supplementary Table 12). ACE is an essential component of the renin–angiotensin system and it has a crucial role in the development of insulin resistance31. By increasing insulin sensitivity and decreasing inflammation, ACE inhibitors, which are frequently used to treat hypertension, have been demonstrated in clinical studies and meta-analyses to lower the incidence of new-onset T2D in people at high risk32. the COMT variant rs4680 is associated with lower HbA1c and protection from T2D33. This corroborates our MR findings where the COMT pQTL rs4680 showed a protective effect against T2D. While no other significant pQTLs identified through MR were directly associated with T2D, several proteins (TFPI, LTA, GHR and ADH1B) encoded by genes within which these pQTLs reside have been linked to T2D or T2D-related traits (Supplementary Table 13).
In line with its established function in blood pressure regulation, the pQTL rs4363 showed significant associations with cardiovascular traits in the phenome-wide association study (PheWAS), such as high blood pressure and hypertension. Furthermore, its associations with Alzheimer’s disease (neurological domain) and T2D (metabolic domain) indicate wider in metabolic and neurodegenerative processes. It also showed some significant associations with anthropometric traits, such as height and standing height. rs3213739 exhibited significant associations with the waist–hip ratio (anthropometric domain) and the resting heart rate and pulse rate (cardiovascular domain), highlighting its role in body composition and metabolism (Fig. 4d,e and Supplementary Table 14).
Lastly, we assembled a list of 1,804 postulated effector genes for T2D from nine GWAS studies. If a gene coding for any of the proteins associated with the identified pQTLs in our study was found in the curated list, we defined such gene/protein as reported; if not, we classified them as previously unresolved. We identified 320 proteins previously unresolved as potentially linked to effector genes for T2D based on these GWAS signals (Supplementary Table 15).
Our work takes a first step toward addressing the underrepresentation of continental African individuals in genetics and proteomics studies. Thus, we were able to delineate the molecular landscape of 2,873 unique proteins in a context that might be pivotal to understanding drivers of T2D pathophysiology, identified 58 African-ancestry-specific cis-pQTLs that have not been reported previously and identified 18 proteins that are causally associated with T2D. The generalizability of these findings may be limited to the continent because the population was drawn from a single demographic group within Africa. Hence, there is a need to include more ancestrally diverse populations in future studies.
In this study, we used the Olink targeted proteomic assay, which has some limitations; for example, only a subset of the full proteome is studied and the affinity of aptamers may be affected by missense variants. While HbA1c is a highly standardized and accurate test with lower intraindividual variability compared to fasting glucose, in individuals of African ancestry, using HbA1c as a blood sugar level indicator may not provide the full spectrum of the metabolic conditions associated with T2D because of the prevalence of hemoglobinopathies, such as glucose-6-phosphate dehydrogenase (G6PD) deficiency. In individuals with G6PD deficiency, there is increased susceptibility to hemolysis, which may lead to reduced HbA1c levels potentially leading to missed T2D diagnosis34,35.
The DEP analysis of adipokines and metabolic proteins between cases and controls revealed differences in the role these proteins have in obesity, inflammation and pancreatic function. LEP was significantly upregulated in cases, which is consistent with its known association with adiposity and metabolic regulation36. Previous studies linked circulating LEP levels with insulin resistance and T2D development37; experimental models suggest that it may influence Beta cell function and glucose metabolism38,39.
Population-specific differences in protein expression were observed when DEPs were compared between the UGR-PD and UKB-PPP cohorts. Some proteins were upregulated in patients with T2D compared to controls in one cohort but not in the other. In comparison, other proteins were downregulated in one cohort but upregulated in the other. These differences suggest that factors beyond disease status may influence variation in protein expression. Ancestral genetic variation is one potential explanation, as genetic diversity affects gene regulation and metabolic pathways40. Additionally, environmental factors, including diet, lifestyle and exposure to infections, may contribute to disparities in protein expression profiles. Lastly, variations in T2D disease progression, comorbidities or medication use across the two cohorts could also have a role. Some significantly expressed DEPs had a T2D GWAS hit within a 500-kb window. However, none colocalized with T2D. The finding provides evidence that disease risk may be influenced by genetic variants close to T2D-associated proteins via protein-mediated pathways. Proteins like LEP, LPL, EIF5A and CCL25 have several GWAS hits within ±500 kb of them, which shows that these proteins may mediate genetic predisposition to T2D.
Some of the identified pQTLs were associated with T2D or relevant to T2D via association with other cardiometabolic traits, including lipid and blood pressure traits. Previous studies found rs532436 and rs505922 to be associated with T2D, HDL cholesterol levels, triglycerides (TGs) and diastolic blood pressure (DBP) 41,42,43 across diverse ancestral populations. In addition, rs77924615 has been linked to cardiovascular disease and blood pressure traits44,45, supporting its potential contribution to metabolic syndrome, a key risk factor for T2D. The association of rs10460181, rs2455069 and rs12721054 with lipid traits46,47,48 corroborate previous findings that lipid dysregulation has a vital role in developing insulin resistance and T2D49,50. According to the MR results, the COMT pQTL rs4680 had a protective effect against T2D. This is consistent with a study conducted in the Women’s Genome Health Study, which found that the high-activity G-allele of rs4680 was linked to lower HbA1c levels and a slight decrease in the risk of T2D in women of European ancestry33.
In conclusion, the associations and causally associated proteins identified offer promising avenues for developing targeted therapies and personalized treatment strategies for T2D, contributing to improved management and prevention of this global health challenge. Our findings demonstrate the utility and discovery opportunities afforded by including individuals of African ancestry in large-scale proteomic studies.