Introduction
As Tanzania approaches 2026, its economic trajectory is increasingly shaped by powerful global economic shocks emanating from financial markets, geopolitics, debt dynamics, and rapid technological change. According to the World Economic Forum’s Chief Economists’ Outlook (January 2026), the global economy is entering a period of heightened uncertainty that presents both significant opportunities and critical challenges for Tanzania’s developing economy.
Key FindingsDebt Relief Potential: 54% of global economists expect US dollar depreciation, which could reduce Tanzania’s $36.8 billion external debt burden by approximately $3.7 billion (10% depreciation scenario)Trade Opportunities: Sustained US-China trade tensions (US tariffs on Chinese goods at 47.5%) create openings for Tanzania as an alternative supplierTechnology Gap: Sub-Saharan Africa expected to lag 4.1 years behind developed economies in realizing AI productivity gainsEmployment Risk: 72% of economists expect job losses in the next 2 years, with 3.4 million Tanzanian jobs at risk over 10 years1. Economic Risks Outlook1.1 Asset Valuations and Market ImpactAsset CategoryExpected IncreaseExpected DecreaseImpact on TanzaniaUS Dollar20%54%Very High – Debt burden reductionGold46%54%Medium – Tanzania is 4th largest African producerAI Stocks (US)40%52%Medium – Technology price impactsCryptocurrencies38%62%Low – Limited exposureUS Dollar Depreciation Impact Analysis
Positive Impact
External debt servicing becomes easier – potential $3.7B real value reduction
Tourism Boost
Dollar-priced tourism services more affordable (17.5% of GDP)
Negative Impact
Import costs increase (Trade deficit: $5.8B in 2024)
1.2 Debt and Macroeconomic Crisis RisksCritical Debt Situation
Global context: Global public debt reached a record $102 trillion in 2024, projected to rise to 100% of GDP by 2029. Developing countries’ debt levels are growing twice as fast as developed economies.
Public Debt
$68.5 billion (38% of GDP)
External Debt
$36.8 billion (20% of GDP)
Debt Service
35% of government revenues
Tax-to-GDP Ratio
12.3% (below 15% minimum)
Macroeconomic Crisis Probabilities for Tanzania (2026)1.3 Debt Management Strategies (Next 5 Years)StrategyLikelihood (Emerging Markets)Implications for TanzaniaEconomic Growth64%Best Path – Target 7-8% annual growth to outpace debtHigher Inflation61%TZS will lose purchasing power; reduced real debt burdenTax Increases53%Direct taxes expected to increase; need to reach 15% tax-to-GDPDebt Restructuring53%High probability of needing to renegotiate termsCut Public Spending38%Public services will be strained1.4 Government Spending Priorities EvolutionSectorExpected Change (Emerging Markets)Current Investment NeedPriority LevelDefense74% increase~2.1% of GDP ($1.5B annually)Medium-HighDigital Infrastructure71% increase$3-5B over 5 yearsCriticalEnergy43% increase$8-10B to reach 5,000 MW by 2030CriticalHealth58% no changeCurrently 3.6% of GDP (below WHO 5% minimum)ConstrainedEducation32% increase3.4% of GDP (below UNESCO 4-6%)CriticalEnvironmental Protection61% expect decreaseClimate finance neededAt Risk1.5 Inflation OutlookRegional Inflation Pressure
89% of economists expect moderate to high inflation in Sub-Saharan Africa
Current Tanzania inflation: 4.9% (December 2025)Food inflation: 5.7% (38.5% weight in CPI)Transport inflation: 6.2% (14.3% weight in CPI)TZS depreciation: 5.3% vs USD in 2025
Weather Variability
2024/25 drought reduced maize production by 18%
Import Dependency
25% of food consumed is imported
Energy Costs
Petroleum products: 15% of import bill
Electricity Tariffs
Increased 7% in 2025
2. Trade and Investment Outlook2.1 Global Trade RestructuringUS-China Trade Context
The US-China trade truce (November 1, 2025) maintains a 10% “reciprocal” tariff but average US tariffs on Chinese goods remain at 47.5% (up from 20.7% in January 2025). This creates significant opportunities for alternative suppliers.
Trade Policy AreaExpected ChangeStrategic Implication for TanzaniaUS-China Tariffs64% no changeSustained opportunity to become alternative supplierRegional Trade Agreements69% increaseDeepen EAC/SADC integration; leverage AfCFTA (1.3B people, $3.4T GDP)Bilateral Trade Agreements94% increaseNew bilateral trade opportunities openingFDI into China52% decreaseReduced competition for capital; opportunity to attract diverted FDIFDI into US57% increaseAttract US investors seeking China alternatives2.2 Tanzania’s Current Trade Position (2024)
Total Exports
$9.2 billion
Gold Exports
$2.8 billion (30%)
Tourism Services
$2.9 billion (32%)
Agricultural Products
$1.9 billion (21%)
Manufacturing
$1.1 billion (12%)
Total Imports
$15.0 billion
Trade Deficit
-$5.8 billion
2.3 Export Opportunities from Trade RestructuringAgricultural Export PotentialCoffee: $320 million current (potential to double with value addition)Cashew Nuts: $450 million (world’s 4th largest producer)Tea: $85 millionStrategy: Process locally to capture more value (currently 80% exported raw)Target: Add $1.8 billion to export revenues by processing domestically2.4 Foreign Direct Investment OutlookCurrent vs Target FDI
Current FDI (2024): $1.1 billion (1.5% of GDP)
Target FDI (2030): $4-5 billion (4-5% of GDP)SectorCurrent FDI (2024)ShareTarget PriorityMining$450 million41%Expand to rare earths, graphite, heliumManufacturing$280 million25%Industrial parks, export processing zonesServices$220 million20%Digital economy, fintech, ICTAgriculture$150 million14%Value addition to raw materials2.5 Regional Growth ComparisonSub-Saharan Africa Growth Challenge
Only 13% expect strong growth in Sub-Saharan Africa (Tanzania’s region)
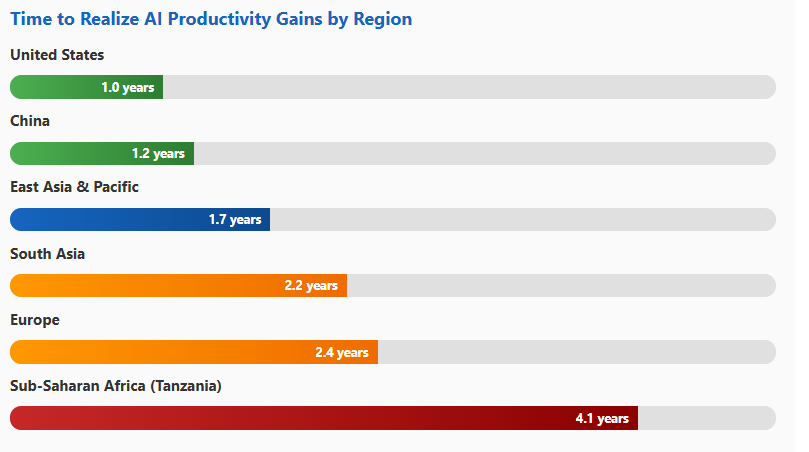
40% expect weak growth47% expect moderate growthIMF projects SSA growth at 4.4% (2026)Tanzania’s 5.2% (2025) is above regional average but below potentialMust achieve 7-8% growth to create 800,000 jobs annuallyRegionStrong Growth ExpectedComparisonSouth Asia66%India: 7.2% growth expectedEast Asia & Pacific45%Vietnam: 6.8% growth expectedSub-Saharan Africa13%Tanzania: 5.2% (2025), need 7-8%Europe3%Declining market for exports3. AI Adoption and Technology Gap Analysis3.1 Regional AI Adoption TimelineCritical Technology Gap
Sub-Saharan Africa (including Tanzania) expected to lag 4.1 years behind developed economies in realizing AI productivity gains
United States: 1.0 years (79% expect gains in 1-2 years)China: 1.2 years (81% expect gains in 1-2 years)Europe: 2.4 yearsSub-Saharan Africa: 4.1 years (only 13% expect gains in 1-2 years; 53% expect 5+ years)Time to Realize AI Productivity Gains by Region
Sub-Saharan Africa (Tanzania)3.2 Why Tanzania is Lagging in AI Adoption
Internet Penetration
32% (vs US 92%, China 73%)
Electricity Access
43% (vs US 100%, China 100%)
Mobile Broadband Speed
15 Mbps avg (vs US 90 Mbps)
Data Costs
$5.80/GB (vs US $1.20, China $0.80)
STEM Graduates
8,000 annually
AI Specialists
Fewer than 50 nationwide
Digital Literacy
Only 18% of population
R&D Spending
0.38% of GDP (vs US 3.2%)
3.3 AI Adoption by Industry SectorIndustryMedian Time to GainsFast Adoption (1-2 years)Critical Impact for TanzaniaIT & Digital Communications0.4 years97%ICT sector rapid transformationFinancial Services1.0 years76%Banking/mobile money revolution (62% adults have mobile money)Healthcare Services1.1 years71%Address doctor shortage (1:20,000 ratio vs WHO 1:1,000)Supply Chain & Transport1.2 years97%Logistics optimization, port efficiencyRetail & Wholesale1.4 years56%3.2M employed in sectorManufacturing2.1 years39%1.8M employed; productivity criticalEducation2.3 years31%10.6M primary students; teacher shortage 85,000Agriculture2.5 years38%CRITICAL: 29% of GDP, 65% of workforce (19.5M people)Mining2.5 years44%Gold: $2.8B exports (30% of total)3.4 AI Adoption by Firm SizeSME Adoption Challenge
99% of Tanzanian businesses are SMEs or micro-enterprises, which will take 2.5+ years to benefit from AI
Firm SizeNumber in TanzaniaMedian Time to AI GainsFast Adoption (1-2 years)Very Large (1,000+ employees)~50 (0.001%)1.4 years77%Large (250-1,000 employees)850 (0.03%)2.5 years46%SMEs (10-250 employees)47,400 (1.46%)2.5 years48%Micro-enterprises (<10 employees)3.2 million (98.5%)2.5 years48%3.5 Employment Impact of AIAI Employment Impact TimelineNext 2 years: 72% expect job losses (modest or significant)Next 10 years: 57% expect job losses; 32% expect job gainsNet Tanzanian impact: 3.4 million jobs at risk, 1.2 million new jobs created = 2.2 million net job displacement (7.3% of workforce)SectorCurrent EmploymentAI Risk LevelJobs at Risk (10 years)Agriculture19.5 millionLow-Medium1.5 million (8%)Retail/Wholesale3.2 millionMedium-High900,000 (28%)Manufacturing1.8 millionMedium450,000 (25%)Financial Services380,000High150,000 (40%)Public Administration620,000Medium180,000 (29%)Education470,000Medium-High160,000 (34%)Healthcare290,000Low-Medium50,000 (17%)ICT185,000High displacement + gainsNet +50,000Youth Employment Crisis Scenario
With 800,000 new job seekers annually and AI reducing entry-level positions:
2026-2030: 4 million new job seekersJobs created (business as usual): 2.1 millionJobs displaced by AI: 850,000Net new jobs: 1.25 millionJob deficit: 2.75 millionRisk: Youth unemployment could rise from 13.7% to 25%+4. Strategic Recommendations4.1 Immediate Priorities (2026-2027)Debt and Fiscal Management
Revenue Enhancement
Increase tax-to-GDP from 12.3% to 15% by 2027 (+$2.1B/year)
Expenditure Rationalization
Cut non-productive spending 10% ($850M savings/year)
Debt Renegotiation
Engage China on $9.8B bilateral debt restructuring
Forex Reserves
Increase from $5.3B (4.2 months) to $7.5B (6 months)
Inflation Control MeasuresEstablish Strategic Grain Reserve of 500,000 tonnesImprove crop production through irrigation ($300M investment)Reduce post-harvest losses from 30% to 20%Maintain flexible but managed exchange rate float4.2 Medium-Term Priorities (2026-2029)Agricultural Transformation ($2.5B over 4 years)InitiativeCurrent StatusTargetInvestmentImpactIrrigation Expansion450,000 hectares (10% of arable land)1.2M hectares by 2030$1.2B40% yield increase, double-croppingMechanization18,000 tractors50,000 tractors by 2030$450MReduce labor constraintsValue Addition80% exported raw50% processed locally$600M+$1.8B export revenues, 250K jobsDigital ExtensionLimited coverage2M farmers connected$250M15% farm-gate price improvementExpected Agricultural OutcomesAgricultural growth: Accelerate from 3.9% to 6% annuallyRural poverty reduction: From 31% to 20%Add $5.2 billion to GDP by 2030Industrial Development ($3.8B over 4 years)Special Economic Zones: 8 export-oriented industrial parks ($1.5B) – Target: Attract $3B FDI, create 400K jobsLocal Content: 30% requirement in government procurement ($300M SME upgrading)Export Promotion: Trade offices in 5 key markets, $500M export credit facilityManufacturing Infrastructure: Reliable electricity, water, port/rail connectivity ($1.8B)Expected Outcome: Manufacturing growth from 4.8% to 10% annually; exports from $1.1B to $3.5BTourism Development ($1.2B over 4 years)Infrastructure: Upgrade airports (Kilimanjaro, Mwanza, Mtwara), improve roads ($650M)Marketing: Global campaign, diversify source markets to Asia ($200M)Product Diversification: Beach tourism, cultural circuits, MICE facilities ($350M)Expected Outcome: Tourist arrivals from 1.8M to 3.5M; tourism contribution from 17.5% to 22% of GDP4.3 Infrastructure Investment ($12B over 4 years)Infrastructure Investment Allocation
Energy: $5 billion
Target: Increase capacity from 1,606 MW to 4,200 MW
Transport: $4.5 billion
Complete 3,000 km paved roads, expand SGR, upgrade ports
Digital Infrastructure: $1.5 billion
Fiber network 12K to 30K km; 4G/5G coverage 48% to 85%
Water & Sanitation: $1 billion
Serve additional 8M people; increase sanitation 32% to 55%4.4 Long-Term Priorities (2026-2035)AI and Digital Transformation ($8B over 10 years)PhasePeriodInvestmentKey InitiativesPhase 1: Foundation2026-2028$2B
• Nationwide fiber to all districts
• 95% 4G, 60% 5G coverage
• 3 hyperscale data centers
• Train 5,000 AI specialists
• Pilot projects in agriculture, health, educationPhase 2: Scaling2029-2032$3.5B
• Train 50,000 AI/data professionals
• AI literacy for 2M workers
• 5 more data centers
• AI deployment to 1M farmers
• AI adoption in 500 factoriesPhase 3: Maturity2033-2035$2.5B
• Support 1,000 AI startups
• Smart cities (Dar, Dodoma, Arusha)
• AI export industry
• World-class AI research universitiesExpected AI Outcomes by 2035AI contributes 8-10% to GDP growth50% of workforce AI-literateTechnology exports: $2 billion annuallyPosition as East African AI hubEducation and Skills Transformation ($6B over 10 years)Basic Education Reform ($2.5B): Eliminate 85,000 teacher shortage; introduce coding from primary; 75% secondary pass rate by 2030STEM Education ($1.5B): Increase STEM graduates from 8,000 to 50,000/year; 10 new technical collegesVocational Training ($1B): Modernize VETA for Industry 4.0; 50 new centers; train 500,000 youthAdult Reskilling ($1B): Digital literacy for 5M adults; reskill 500,000 in at-risk occupations6. Conclusion: Tanzania at a CrossroadsThe Critical Window: 2026-2028
Tanzania has only three years to lay foundations that will determine its economic trajectory for decades. The decisions made before and through 2026 will be pivotal in determining whether global economic turbulence becomes a catalyst for transformation or a constraint on future prosperity.
Major Risks Facing Tanzania
Debt Crisis
47% likelihood of sovereign debt crisis
Technology Gap
4.1 years behind in AI adoption
Employment Disruption
3.4M jobs at risk from AI over 10 years
Inflation Pressure
89% expect moderate to high inflation
Regional Growth Lag
Only 13% expect strong SSA growth
Skills Gap
Need 6x increase in STEM graduates
Key Opportunities Available
Trade Restructuring
Alternative supplier opportunities from US-China tensions
Regional Integration
69% expect increase in regional trade agreements
Investment Diversion
52% expect FDI decrease to China – opportunity for Tanzania
Digital Economy
Fintech and digital services rapid growth
Natural Resources
Gold, rare earths, agriculture in high demand
Dollar Depreciation
54% expect decline – reduces debt burden
Two Paths ForwardPath A: Falling BehindPath B: Breaking ThroughFails to address debt burden → Fiscal crisisDelays AI adoption → Technology gap widensNeglects education → Youth unemployment crisisBusiness as usual → 4-5% growth, insufficient jobsOutcome: Growing inequality, social instability, development stagnationImplements fiscal reforms → Sustainable debt, investment resourcesPrioritizes AI readiness → Competitive positioningTransforms education → Skilled workforceAccelerates structural change → 7-8% growth, inclusive prosperityOutcome: Middle-income status by 2035, shared prosperityRequired Actions by StakeholderFor Government:2026: Launch National AI Strategy, begin debt renegotiation, accelerate revenue collection to 15% of GDP2027: Deploy digital infrastructure, scale skills training, implement agricultural transformation2028: Achieve fiscal stability, demonstrate AI adoption success, reach 7% GDP growthFor Private Sector:Large firms: Begin AI adoption immediately (invest 2-3% of revenue)SMEs: Start digital transformation planning, access government support programsInvestors: Deploy capital in strategic sectors (agritech, fintech, renewable energy, manufacturing)For Development Partners:Support debt restructuring and provide concessional financingFund skills development and technology transfer programsEnable regional integration and improved market accessTanzania’s Competitive StrengthsDemographics: Young, growing population (67% under 30)Resources: Abundant natural resources (land, minerals, energy potential)Location: Strategic gateway to East and Central AfricaStability: Political stability and democratic institutionsMarket: Growing middle class and expanding consumer marketWhat Success RequiresPolitical will to implement difficult reformsInvestment of $30-40 billion over 10 yearsFocus on education, technology, and productivityUrgency recognizing the narrow window of opportunityInclusion ensuring benefits reach all citizensThe Time to Act is NOW
Success means prosperity for 100+ million Tanzanians by 2050.
Failure means another generation trapped in poverty and underdevelopment.
The stakes could not be higher. The opportunity will not wait.
Data Sources
This analysis is based on data from the World Economic Forum Chief Economists’ Outlook (January 2026), Tanzania National Bureau of Statistics, Bank of Tanzania, International Monetary Fund, World Bank, and African Development Bank. All data is current as of January 2026.
Report Prepared: January 2026 | For: Policy Makers, Investors, Business Leaders, and Development Partners
#TanzaniaEconomy #GlobalEconomicShocks #EconomicOutlook2026 #DebtAndGrowth #TradeAndInvestment #FDIInAfrica #DigitalTransformation #AIAndDevelopment #StructuralTransformation #FutureOfGrowth