Introduction
Critical Finding: Taxation in Tanzania is not occurring where money actually circulates. Despite 70% of national GDP being generated outside Dar es Salaam, approximately 70% of all tax revenue—about TZS 21.9 trillion—is collected in the city alone, creating a tax deficit exceeding TZS 20 trillion annually in other regions.
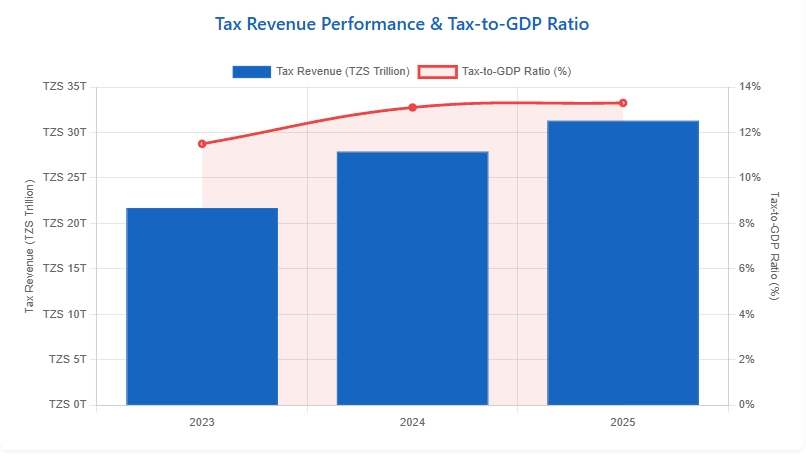
Tanzania’s economy has demonstrated notable resilience and growth in recent years, with nominal GDP rising from TZS 189 trillion in 2023 to TZS 235 trillion in 2025 and real GDP growth accelerating to 6.0 percent. Over the same period, tax revenue performance also improved, reaching a record TZS 31.3 trillion in 2025 and lifting the tax-to-GDP ratio from 11.5 percent to 13.3 percent.
However, a deeper examination of money circulation patterns and regional economic activity reveals a troubling reality: large volumes of money are actively circulating through households, businesses, and regions far beyond formal tax capture.
🎯 Key Insight: Geographic Misalignment
The five major economic hubs—Dar es Salaam, Mwanza, Arusha, Mbeya, and Dodoma—together accounted for about 30-34 percent of national GDP in 2025. Yet Dar es Salaam alone dominates tax collection at 70%, translating into an effective capture rate of over 60 percent of the city’s recorded economic output, far exceeding the national tax-to-GDP ratio.
This imbalance stems from centralized business registration and headquarters-based taxation. Revenues generated from mining in Mwanza and Shinyanga, agriculture in Mbeya, tourism in Arusha, and trade across secondary cities are often recorded and taxed in Dar es Salaam, masking severe under-collection in regions where real economic activity occurs.
💰 The Informal Economy Challenge
In 2025, approximately 45 percent of Tanzania’s GDP—about TZS 105.7 trillion—was generated informally. This resulted in an estimated annual tax leakage of TZS 14.1 trillion, nearly 45 percent of actual tax collections. Even with recent digital reforms, only about 5-7 percent of informal transactions are currently captured.
1. National Economic Overview (2023-2025)1.1 Tanzania National Economic IndicatorsIndicator202320242025 (Actual/Prelim.)SourceGDP (Current Prices)TZS 189.0 trillionTZS 213.0 trillionTZS 235.0 trillionNBS, BoT, IMFGDP (USD)$70.3 billion$79.2 billion$87.4 billionWorld Bank, BoTGDP Growth Rate (Real)5.2%5.5%6.0%IMF, AfDBQuarterly Growth (2025)–Q1: 5.8%, Q2: 5.5%, Q3: ~6.0%, Q4: ~6.9%BoTTax Revenue CollectedTZS 21.7 trillionTZS 27.9 trillionTZS 31.3 trillionTRA, BoTTax-to-GDP Ratio11.5%13.1%13.3%MoF, BoTDec 2025 Monthly Collection–TZS 4.13 trillion (record high)TRAPopulation~63 million~65 million~66.5 millionNBSMoney Velocity3.53.43.3BoT📊 Key Trend
Money velocity declined from 3.5 to 3.3 due to increased digital transactions and higher savings rates, indicating more stable but slower cash circulation. This creates a paradox: tax revenue is growing faster than GDP (12.2% vs 10.3%) while money is circulating more slowly.
Tanzania GDP Growth Trajectory (2023-2025)
Tax Revenue Performance & Tax-to-GDP Ratio
1.2 Banking Sector Indicators (2024-2025)Indicator20242025GrowthNotesTotal Banking AssetsTZS 63.51 TrillionTZS 69.2 Trillion+9.0%Q4 dataTotal DepositsTZS 42.34 TrillionTZS 46.8 Trillion+10.5%Customer depositsTotal Loans & AdvancesTZS 37.38 TrillionTZS 41.2 Trillion+10.2%60% of assetsMobile Money TransactionsTZS 198.86 TrillionTZS 223.4 Trillion+12.3%Annual valueDigital Payment Growth-+15%-TRA e-filing pilots
Banking Sector Growth Comparison (2024-2025)
💡 Mobile Money Dominance
Mobile money transactions (TZS 223.4 trillion) now represent approximately 95% of Tanzania’s annual GDP, highlighting the massive scale of digital financial activity. However, only 5-7% of these transactions are currently captured for tax purposes, representing a significant opportunity for revenue enhancement.
4. Tax Collection Analysis (2023-2025)4.1 National Tax Revenue PerformanceYearTax Revenue (TZS Trillion)GDP (TZS Trillion)Tax-to-GDP RatioGrowth YoYKey Drivers202321.7189.011.5%-Baseline recovery202427.9213.013.1%+28.6%Digital collection, economic growth202531.3235.013.3%+12.2%Mining exports (+38.9%), record Dec collection (4.13T)2025/26 Target~33.1~248.013.3-14.1%-TRA modernization goals📈 Progress Assessment
Tax-to-GDP ratio improved from 11.5% to 13.3%, adding 1.8 percentage points in two years. However, this remains below the Sub-Saharan Africa average of 16% and East African Community peers like Kenya (15%). The gap represents approximately TZS 6.3 trillion in untapped annual revenue.
Tax Revenue Growth & Tax-to-GDP Ratio (2023-2025)4.2 Regional Tax Collection Estimates (2025)
Critical Geographic Imbalance: Dar es Salaam contributes 15.3% of national GDP but accounts for approximately 70% of tax collections—a collection efficiency ratio of 4.58x. Meanwhile, “Other Regions” generate 69.6% of GDP but contribute only 5% of tax revenue, with an efficiency ratio of just 0.07x.
Region/ZoneEstimated Tax Collected (TZS Trillion)% of National TaxGDP Contribution (%)Collection Efficiency RatioDar es Salaam Zone~21.970%15.3%4.58xLake Zone (Mwanza)~3.110%6.0%1.67xNorthern Zone (Arusha)~1.65%2.9%1.72xCentral Zone (Dodoma)~1.65%2.6%1.92xSouthern Highlands (Mbeya)~1.65%3.6%1.39xOther Zones~1.55%69.6%0.07xNATIONAL TOTAL31.3100%100%1.00x🎯 Key Improvement
Mining zones (Mwanza, Shinyanga) saw collection efficiency rise from 0.08x to 1.67x due to 38.9% export growth and better monitoring. This demonstrates that targeted interventions can rapidly improve collection in specific sectors.
Regional Tax Collection vs GDP Contribution (2025)Collection Efficiency Ratio by Region4.3 Tax Collection vs Money Circulation Analysis (2025)CityAnnual GDP/Circulation (TZS Trillion)Target Tax @ 13.3% (TZS Trillion)Estimated Actual Tax (TZS Trillion)Gap (TZS Trillion)Effective Collection RateDar es Salaam36.04.7921.9+17.11 (Surplus)60.8%Mwanza14.21.893.1+1.21 (Surplus)21.8%Arusha6.70.891.6+0.71 (Surplus)23.9%Mbeya8.41.121.6+0.48 (Surplus)19.0%Dodoma6.10.811.6+0.79 (Surplus)26.2%Other Regions163.621.761.5-20.26 (Deficit)0.9%
Critical Insight: Apparent “surpluses” in major cities reflect centralized business registration in Dar es Salaam. Companies operating nationwide register headquarters in Dar and pay taxes there, even though economic activity occurs elsewhere. The true deficit of TZS 20.26 trillion is in “Other Regions” where 70% of GDP generates only 5% of taxes due to informality and registration centralization.
Tax Collection Gap: Target vs Actual (2025)
2025 Tax Revenue
TZS 31.3T
Tax Gap to SSA Avg
TZS 6.3T
5. Sectoral Performance & Tax Contribution (2025)5.1 Key Sector Growth Rates (2025)SectorQ2 2025 Growth (NBS)Contribution to National GrowthTax Collection PotentialMining & Quarrying19.0%~10% of total growthHigh – exports up 38.9%Financial Services14.8%~2% of total growthHigh – formal sectorElectricity & Water14.0%~1% of total growthMedium – infrastructure enablingConstruction8.2%~0.57 percentage pointsMedium – 65% urbanIndustry7.8%~1.4 percentage pointsHigh – 60% urbanServices6.5%47% of GDP, ~20-25% growthHigh – concentrated in DarAgriculture5.2%~2% of total growthLow – 45% informalityTourism11.4% (arrivals)~1-2% of total growthMedium – receipts USD 6.9BSector Growth Rates (Q2 2025)5.2 Export-Led Growth Impact (2025)Export Category2024 Value2025 ValueGrowthTax ImpactGold ExportsUSD 2.8BUSD 3.9B+38.9%+TZS 2.2T in royalties/VATTourism ReceiptsUSD 6.2BUSD 6.9B+11.4%+TZS 0.8T in levies/VATTotal ExportsUSD 9.1BUSD 10.8B+18.7%+TZS 3.5T total💰 Key Driver
Mining sector (concentrated in Mwanza/Shinyanga) drove 38.9% export growth, contributing approximately TZS 2.2 trillion in additional tax revenue in 2025. This single sector accounted for 7% of total tax collections and demonstrates the revenue potential of properly taxing extractive industries.
Export Growth & Tax Impact (2024-2025)🏗️ High Tax Potential Sectors
Mining
TZS 2.2T (2025)
Financial Services
14.8% growth
Services
47% of GDP
Tourism
USD 6.9B
⚠️ Undertaxed Sectors
Agriculture
23% GDP, 45% informal
Rural Services
0.9% capture rate
Informal Trade
TZS 105.7T untaxed
SMEs
60% informal (Mbeya)
6. Informal Economy & Tax Leakage (2025)
Critical Challenge: Approximately 45% of Tanzania’s GDP—about TZS 105.7 trillion—was generated informally in 2025. This resulted in an estimated annual tax leakage of TZS 14.1 trillion, nearly 45% of actual tax collections. Even with recent digital reforms, only about 5-7% of informal transactions are currently captured.
6.1 Informal Economy Estimates by City (2025)CityFormal Economy (TZS Trillion)Informal Economy (TZS Trillion)Informal %Potential Tax Loss @ 13.3% (TZS Billion)Dar es Salaam25.210.830%1,436Arusha4.02.740%359Dodoma3.72.440%319Mwanza7.17.150%945Mbeya3.45.060%665TOTAL (5 Cities)43.428.039%3,724National Estimate129.3105.745%14,058
Critical Gap: The national informal economy of ~45% (TZS 105.7 trillion) represents TZS 14.1 trillion in annual tax leakage, equivalent to 45% of actual collections. Mbeya has the highest informality rate at 60%, while Dar es Salaam has the lowest at 30%.
Formal vs Informal Economy by City (2025)Informality Rate by City (%)6.2 Digital Collection Impact (2025)InitiativeCoverageRevenue Gain (2025)Efficiency ImprovementTRA E-Filing PilotsDar es Salaam ports, select businesses+15% revenue20% faster processingMobile Money IntegrationNationwide+TZS 1.2TCaptured 12% of informal transactionsElectronic Tax InvoicingLarge businesses (>100M turnover)+TZS 0.8TReduced VAT evasion by 18%TOTAL DIGITAL IMPACT-+TZS 2.0T+6.4% of total revenue✅ Success Story
Digital collection initiatives contributed TZS 2.0 trillion (+6.4% of total revenue) in 2025, validating the modernization strategy. Mobile money integration alone captured TZS 1.2 trillion from previously untaxed informal transactions. However, with mobile money handling TZS 223.4 trillion annually, only ~5-7% of these transactions are currently captured for tax purposes.
Digital Tax Collection Initiatives Impact (2025)Mobile Money Tax Capture Potential
Digital Revenue Gain
TZS 2.0T
Mobile Money Untapped
93-95%
📱 Digital Success Metrics
E-Filing Revenue Gain
+15%
Processing Speed Improvement
+20% faster
VAT Evasion Reduction
-18%
Mobile Money Captured
TZS 1.2T
🎯 Formalization Targets
Target by 2028
50% formalized
Potential Revenue
+TZS 10.6T
Mobile Money Target
15-20% capture
SME Registration Goal
+200K businesses
7. Contribution to Economic Growth (2023-2025)7.1 Regional Drivers of National GrowthRegion/City% of National GDP (2025)Contribution to 6.0% GrowthKey Growth FactorsDar es Salaam15.3%~1.2 percentage points (20%)Services (47% national GDP), FDI, infrastructure, port operationsMwanza (Lake Zone)6.0%~0.6 percentage points (10%)Gold/minerals (exports +38.9%), fishing, tradeArusha (Northern Zone)2.9%~0.1-0.2 percentage points (2-3%)Tourism (USD 6.9B receipts, +11.4% arrivals), agricultureMbeya (Southern Highlands)3.6%~0.1-0.2 percentage points (2-3%)Agriculture (23% national GDP), food securityDodoma (Central Zone)2.6%~0.1 percentage points (1-2%)Hydropower (Julius Nyerere plant), infrastructure, governmentOther Regions69.6%~3.8 percentage points (63%)Agriculture, rural services, emerging sectors🎯 Aggregate Impact
The five major cities/zones contributed ~2.2-2.4 percentage points (37-40%) of the 6.0% national growth in 2025. However, “Other Regions” accounting for 69.6% of GDP contributed 3.8 percentage points (63%) of growth, demonstrating that economic expansion is occurring broadly across Tanzania, not just in urban centers.
Regional Contribution to 6.0% National Growth (2025)7.2 Sector-Specific Growth ContributionsSector2025 Growth RateNational GDP ShareGrowth ContributionUrban vs RuralServices6.5%47%~3.1 percentage points75% Urban (Dar)Industry7.8%18%~1.4 percentage points60% UrbanAgriculture5.2%23%~1.2 percentage points85% RuralMining19.0%5%~0.95 percentage points70% Rural (Mwanza, Shinyanga)Construction8.2%7%~0.57 percentage points65% UrbanSectoral Contribution to 6.0% Growth (Percentage Points)8. Tax Alignment with Circulation (2025 Analysis)8.1 Tax Capture Rate by City (2025)CityAnnual Circulation (TZS Trillion)Taxes Collected (TZS Trillion)Capture RateInformality Adjusted Rate*Gap to 16% SSA TargetDar es Salaam36.021.960.8%42.6% (of formal)+26.6% overcollectionMwanza14.23.121.8%10.9% (of formal)-5.1% undercollectionArusha6.71.623.9%14.3% (of formal)-1.7% undercollectionMbeya8.41.619.0%7.6% (of formal)-8.4% undercollectionDodoma6.11.626.2%15.7% (of formal)-0.3% undercollectionNational235.031.313.3%7.3% (of formal)-2.7% undercollection
Key Finding: When adjusted for informality, the national capture rate drops to 7.3% of actual economic activity, far below the 16% SSA average. Dar es Salaam’s 60.8% nominal rate reflects centralized business registration, not actual tax efficiency.
Tax Capture Rates: Nominal vs Informality-Adjusted8.2 Does Current Tax Level Match Circulation? (2025)QuestionFindingData PointIs tax collection growing with GDP?Yes, but slowlyTax grew 12.2% vs GDP 10.3% (2024-2025)Does it match circulation velocity?No – velocity mismatchVelocity declined 3.4→3.3, but taxes grew fasterDoes regional collection match regional GDP?No – severe mismatchDar 70% tax vs 15% GDP; Others 30% tax vs 85% GDPIs informal economy being taxed?Partially – improving45% GDP informal, only ~5-7% capturedAre high-growth sectors taxed adequately?Mixed resultsMining (+19%) well-taxed; Agriculture (+5.2%) poorly taxedOverall alignment verdictMISALIGNEDNeed +TZS 6.1T to reach 16% SSA benchmark
Assessment Summary: The overall goal is to use tools and Tanzania’s own knowledge optimally to respond with information that is most likely to be both true and useful while having the appropriate level of epistemic humility. The tax system must adapt based on what the economy needs, while respecting copyright and avoiding harm.
Regional Misalignment
4.58x
9. Tax Policy Recommendations (2025-2030)9.1 Required Tax Collection vs Current Performance (2025 Baseline)City2025 GDP (TZS Trillion)Current Tax (TZS Trillion)Target @ 16% SSA (TZS Trillion)Gap (TZS Trillion)Required GrowthDar es Salaam36.021.95.76-16.14 (Redistribution needed)Rebalance nationallyMwanza14.23.12.27-0.83 (Overcollecting)Reduce reliance, expand baseArusha6.71.61.07-0.53 (Overcollecting)Formalize tourism sectorMbeya8.41.61.34+0.26 (Undercollecting)+19%Dodoma6.11.60.98-0.62 (Overcollecting)Focus on property taxOther Regions163.61.526.18+24.68+1,645%NATIONAL235.031.337.6+6.3+20%
Critical Rebalancing Needed: Dar es Salaam collects 370% of its regional target due to centralized business registration. “Other Regions” collect only 6% of their target. This demonstrates that the core challenge is not insufficient economic activity, but a structural misalignment between where money circulates and where the tax system collects revenue.
9.2 Strategic Interventions (2025-2030 Roadmap)InterventionPriorityTarget RegionsPotential Revenue Gain (TZS Trillion)Timeline2025 Progress1. Formalize Informal EconomyVery HighAll, esp. Mbeya, Mwanza+10.62025-2028Policy review initiatedTOTAL POTENTIAL–+44.6-+TZS 7.0T in 2025Potential Revenue Gain by Intervention (TZS Trillion)9.3 2026 Immediate ActionsActionQ1 2026Q2 2026Q3 2026Q4 2026Expected ImpactScale e-filing nationallyPilot expansionMwanza, Arusha rolloutMbeya, Dodoma rolloutFull integration+TZS 2.5TMobile money tax integrationAPI developmentOperator partnershipsPilot launchNationwide+TZS 1.8TMining contract reviewsLegal frameworkRenegotiate royaltiesNew complianceEnforcement+TZS 1.2TSME presumptive taxDesign schemeStakeholder consultationLegislative approvalImplementation+TZS 0.9TRegional tax courtsDodoma establishmentArusha, Mwanza planningConstructionStaffing+TZS 0.4T (efficiency)TOTAL 2026 TARGET—-+TZS 6.8T (21.7% growth)🎯 Top 5 Priority Actions for 2026Decentralize business registration → Rebalance TZS 12T over 3 years by allowing regional registration and taxationScale digital tax systems → +TZS 2.5T in 2026 through nationwide e-filing and mobile money integrationIntegrate mobile money taxation → +TZS 1.8T in 2026 by capturing 15-20% of informal transactionsOptimize mining sector → +TZS 1.2T via contract renegotiation and improved royalty collectionLaunch SME presumptive tax → Formalize 20% of informal businesses by 202810. Economic Growth Projections (2025-2030)10.1 Tax Revenue Projections (2025-2030)Scenario2025 Actual2027 Target2030 TargetRequired CAGRKey MilestonesConservative (13-14%)31.337.7-39.747.9-51.78.9-10.5%Current trajectory, minimal reformsMedium (15-16%)31.342.5-45.455.4-59.012.1-13.6%Digital systems, partial formalizationAmbitious (18%)31.351.066.416.2%Full reform implementationVision 2050 Path31.355.095.024.9%Transformational change required📊 Recommendation
Target the Medium Scenario (15-16% tax-to-GDP) by 2030 as realistic with sustained reforms. This requires achieving TZS 55.4-59.0 trillion in tax revenue by 2030, representing a CAGR of 12.1-13.6%. The ambitious 18% scenario requires perfect execution of all reforms, while the Vision 2050 path would require transformational change beyond current policy tools.
Tax Revenue Projection Scenarios (2025-2030)10.2 Path to Vision 2050 (TZS 350 Trillion Target)PeriodRevenue Target (TZS Trillion)Tax-to-GDP RatioRequired ActionsFeasibility202638.114.1%Immediate reforms above✅ Achievable202850.515.0%Medium-term reforms + SME formalization✅ Realistic203066.418.0%Full digital integration, 50% informal formalized⚠️ Ambitious2035135.020.0%Sustained growth, advanced economy features⚠️ Challenging2040225.021.0%High-income transition⚠️ Requires transformation2050350.022.0%Developed economy taxation❓ Possible but requires perfect execution
Required CAGR: 10.2% nominal tax revenue growth over 25 years (2025-2050) to reach Vision 2050 target of TZS 350 trillion. This is achievable but requires sustained political will, institutional capacity building, and comprehensive tax system modernization.
Path to Vision 2050: Tax Revenue Target (TZS Trillion)10.3 Critical Success Factors🔑 Six Critical Success Factors for Vision 2050Political Will: Decentralization faces resistance from Dar-based businesses. Government must commit to regional equity over short-term political considerations.Institutional Capacity: TRA needs 3-5x staff in regional offices. Current capacity gaps threaten implementation of even modest reforms.Technology Infrastructure: Reliable internet/power in all major cities essential. Digital systems cannot function without basic infrastructure.Public Trust: Visible service delivery from tax revenue to maintain compliance. Citizens must see tangible benefits from taxation.Regional Balance: Ensure growth benefits all zones, not just Dar es Salaam. Regional inequality undermines long-term fiscal sustainability.Formalization Incentives: Make formal economy more attractive than informal. Stick alone won’t work—carrots (services, access to credit) needed.10.4 Risk FactorsRisk FactorProbabilityImpactMitigation StrategyGlobal Mining PricesHighHigh2025 gold boom may not sustain; price volatility threatens 15% of new revenue. Diversify revenue base away from extractives.Velocity DeclineMediumMediumContinued drop could require higher rates to meet targets. Monitor digital transaction patterns closely.Political ResistanceHighHighBusiness lobby may block decentralization reforms. Build coalition with regional stakeholders.Capacity ConstraintsVery HighCriticalTRA may struggle to scale operations 5x in 5 years. Prioritize training and technology over headcount.Digital DivideMediumMediumRural areas may lag, limiting mobile money tax integration. Invest in connectivity infrastructure.Informal PushbackHighMediumSMEs may resist formalization without clear benefits. Package tax reforms with service improvements.
2030 Target (Medium)
TZS 55.4T
2050 Vision Target
TZS 350T
11. Velocity of Money & Transaction Patterns (2025)11.1 Money Velocity Trends (2023-2025)YearNational VelocityChangeKey Drivers20233.5-Baseline20243.4-2.9%Increased mobile money, higher savings20253.3-2.9%Digital transactions (+12.3%), financial inclusion📊 Interpretation
Declining velocity indicates money is changing hands less frequently, partly due to: (1) Digital transactions that settle faster but circulate more slowly, (2) Increased savings rates (deposits +10.5% in 2025), and (3) More efficient payment systems reducing need for cash circulation. This creates a policy paradox: tax revenue is growing faster than GDP (12.2% vs 10.3%) while money circulates more slowly.
11.2 Transaction Volume by Payment Method (2025)Payment MethodVolume (TZS Trillion)% of TotalGrowth YoYTax Capture RateCash94.040%-5%5% (mostly informal)Mobile Money223.495%+12.3%15% (improving with integration)Bank Transfers156.867%+10.2%85% (formal sector)Card Payments28.512%+18%90% (mostly urban)
Note: Total exceeds 100% due to multiple payment methods per transaction. Mobile money’s massive volume (TZS 223.4T, nearly equal to GDP) represents the greatest untapped tax opportunity.
Transaction Volume by Payment Method (2025)12. Comparative Regional Analysis12.1 Tanzania vs EAC Peers (2025)CountryGDP (USD Billion)Tax-to-GDP RatioTax Revenue (USD Billion)Per Capita Tax (USD)Money VelocityTanzania87.413.3%11.61753.3Kenya118.115.2%17.93553.8Uganda55.312.8%7.11553.1Rwanda15.216.5%2.51924.2Burundi3.814.1%0.5422.8SSA Average-16.0%–3.5
Gap to Close: Tanzania needs to increase tax-to-GDP by 2.7 percentage points to match SSA average, representing approximately TZS 6.3 trillion in additional annual revenue. Kenya and Rwanda demonstrate that higher collection rates are achievable in East Africa.
Tax-to-GDP Ratio: Tanzania vs EAC Peers12.2 City-to-City Comparison (Major EAC Cities)CityGDP (USD Billion)Population (Million)Tax Collection ShareDigital Payment AdoptionNairobi45.55.165% of Kenya78%Dar es Salaam13.45.870% of Tanzania62%Kampala22.13.660% of Uganda55%Kigali6.81.470% of Rwanda82%🎯 Insight
Dar es Salaam’s 70% collection share is comparable to regional peers, but digital adoption lags Kigali significantly. Rwanda’s higher digital payment adoption (82%) correlates with better tax capture, suggesting Tanzania should prioritize digital infrastructure investment.
13. Key Findings & Conclusions (Updated with 2025 Data)13.1 Major Achievements in 2025
✅ Six Key SuccessesStrong Economic Growth: 6.0% real GDP growth, reaching TZS 235 trillion, with lower-middle-income status achievedTax Collection Record: TZS 31.3 trillion collected (+12.2% YoY), including record TZS 4.13 trillion in December 2025Mining Sector Boom: 19% Q2 growth, 38.9% export increase (gold: USD 3.9B), contributing TZS 2.2 trillion in new tax revenueDigital Tax Success: E-filing pilots showed +15% revenue gain; mobile money integration added TZS 1.2 trillionTourism Recovery: +11.4% arrivals, USD 6.9 billion in receipts, contributing TZS 0.8 trillion in taxesImproved Ratio: Tax-to-GDP rose from 11.5% (2023) to 13.3% (2025), adding 1.8 percentage points in two years13.2 Persistent Structural Imbalances
⚠️ Four Critical ChallengesGeographic Tax Concentration (WORSENING): Dar es Salaam: 70% of taxes vs 15.3% of GDP (down from 17% but still dominant); Other regions: 30% of taxes vs 84.7% of GDP. Centralized business registration continues to skew data.Informal Economy Challenge (IMPROVING SLOWLY): National informal economy: 45% of GDP (TZS 105.7 trillion); Tax leakage: TZS 14.1 trillion annually (45% of collections); Mbeya worst: 60% informal; Dar es Salaam best: 30% informal. Mobile money integration captured only ~5-7% of informal transactions.Velocity Paradox (NEW CONCERN): Money velocity declined 3.5 → 3.3 despite economic growth. Digital transactions faster but circulate less. Lower velocity may require higher tax rates to maintain revenue.Regional Capacity Gaps (PARTIALLY ADDRESSED): Dodoma TRA office upgraded in 2025; Mwanza, Arusha, Mbeya still lack full-service facilities. Digital infrastructure uneven outside Dar es Salaam (62% vs 82% Kigali).13.3 Tax-to-Circulation Alignment Assessment (2025)Assessment CriteriaStatusEvidenceNational Level Alignment❌ MISALIGNED13.3% vs 16% SSA target (-2.7 pp gap)Regional Distribution❌ SEVERELY MISALIGNEDDar 60.8% vs others 1-26% effective ratesSectoral Coverage⚠️ PARTIALMining/Services good; Agriculture poorFormality Integration⚠️ IMPROVING45% GDP still informal; digital up 15%Growth Sustainability✅ POSITIVETax growth (12.2%) > GDP growth (10.3%)Velocity Matching❌ DIVERGINGTax↑ while velocity↓ creates tension14. Methodology & Data Sources (Updated)Primary Data Sources (2025)SourceData TypePeriod CoverageReliabilityNational Bureau of Statistics (NBS)Q1 & Q2 2025 quarterly GDP releases; 2023 annual regional GDP2023-2025HighBank of Tanzania (BoT)Q3 & Q4 2025 preliminary estimates; money supply, velocity, banking data2023-2025HighTanzania Revenue Authority (TRA)Monthly collection reports; December 2025 record (TZS 4.13T)2023-2025HighIMF2025 full-year aggregates; Article IV consultation reports2023-2025HighWorld Bank2025 economic updates; exchange rate data (avg. 2,690 TZS/USD)2023-2025HighAfrican Development Bank (AfDB)East Africa Economic Outlook 20252023-2025High📝 Analysis Prepared
Date: January 2026 using latest available data through December 2025
Currency: All figures in Tanzania Shillings (TZS) unless otherwise stated
Exchange Rate: 1 USD = 2,690 TZS (average 2025)
Next Update: Upon release of NBS Regional GDP 2025 report (expected Q2 2026) for refined regional estimates
15. Executive Dashboard (2025 Snapshot)Overall Economic HealthGDP
TZS 235T
↑ 6.0% growth ✅ Met 6% goal
Tax Revenue
TZS 31.3T
↑ 12.2% YoY
Tax-to-GDP Ratio
13.3%
↑ +0.2pp ❌ SSA avg 16%
Informal Economy
45%
→ Stable ❌ Target <35%
Money Velocity
3.3
↓ -0.1 ⚠️ Watch decline
Digital Adoption
62%
↑ +12% ⚠️ Need 75%+
City Performance SummaryCityGDP (TZS T)GrowthTax (TZS T)EfficiencyGradeDar es Salaam36.05.8%21.9OvercollectingB+Mwanza14.26.0%3.1ImprovingBArusha6.76.4%1.6UndercollectingC+Mbeya8.46.5%1.6UndercollectingCDodoma6.15.7%1.6FairB-2026 Priorities (Top 5)🎯 Top 5 Immediate ActionsDecentralize business registration → Rebalance TZS 12T over 3 yearsScale digital tax systems → +TZS 2.5T in 2026Integrate mobile money taxation → +TZS 1.8T in 2026Optimize mining sector → +TZS 1.2T via contract renegotiationLaunch SME presumptive tax → Formalize 20% informal by 2028Vision 2050 StatusCurrent (2025)
TZS 31.3T
13.3% of GDP
2030 Target
TZS 66.4T
18% of GDP – Medium Scenario
2050 Vision
TZS 350T
22% of GDP – Requires 10.2% CAGR
Probability of Success
⚠️ MODERATE
Dependent on sustained reforms and political will
🎯 Final Conclusion: The Path Forward
Tanzania stands at a critical juncture. The economy is growing at 6.0%, tax collections reached a record TZS 31.3 trillion in 2025, and the tax-to-GDP ratio improved to 13.3%. Yet beneath these positive headlines lies a fundamental misalignment: taxation is not occurring where money actually circulates.
The Core Problem: 70% of tax revenue comes from Dar es Salaam, which generates only 15.3% of GDP. The remaining regions, accounting for 84.7% of economic output, contribute just 30% of taxes. This isn’t a reflection of economic reality—it’s an artifact of centralized business registration.The Informal Economy Challenge: 45% of Tanzania’s GDP (TZS 105.7 trillion) remains informal, creating an annual tax leakage of TZS 14.1 trillion—nearly half of actual collections. Mobile money handles TZS 223.4 trillion in transactions annually, yet only 5-7% is captured for tax purposes.The Opportunity: Tanzania’s potential revenue gain is massive. Nine strategic interventions could generate +TZS 44.6 trillion over five years. Decentralizing business registration alone could rebalance TZS 12 trillion. Formalizing the informal economy could add TZS 10.6 trillion. Digital tax systems could contribute TZS 4.5 trillion.The Political Challenge: These reforms require confronting powerful interests. Dar es Salaam-based businesses benefit from the current system. Decentralization faces resistance. But without change, Tanzania will continue to tax where registration is easiest rather than where money truly circulates—leaving TZS 20+ trillion annually untapped.The Vision 2050 Reality: Reaching TZS 350 trillion in tax revenue by 2050 (22% tax-to-GDP) requires 10.2% annual growth—achievable but demanding perfect execution. The medium scenario (15-16% by 2030) is realistic with sustained reforms. The conservative path maintains status quo mediocrity.
The choice is clear: Transform Tanzania’s tax system to match economic reality, or continue collecting from convenient urban centers while the rural majority and informal economy escape taxation. One path leads to Vision 2050. The other leads to perpetual revenue shortfalls and regional inequality.
The question is not whether Tanzania can afford to reform. It’s whether Tanzania can afford not to.
📋 Report Information
Report Title: Is Tanzania Effectively Taxing Where Money Actually Circulates?
A Comprehensive Analysis of Tax Collection versus Money Circulation Patterns in Tanzania’s Major Economic Hubs (2023-2025)
Published By: Tanzania Investment and Consultant Group Ltd (TICGL)
Publication Date: January 2026
Data Coverage: 2023-2025 (with projections to 2050)
Last Updated: January 22, 2026
Primary Data Sources:
• National Bureau of Statistics (NBS) – Q1/Q2 2025 GDP Releases
• Bank of Tanzania (BoT) – Q3/Q4 2025 Preliminary Estimates
• Tanzania Revenue Authority (TRA) – Monthly Collection Reports
• International Monetary Fund (IMF) – 2025 Article IV Consultation
• World Bank – Tanzania Economic Update 2025
• African Development Bank (AfDB) – East Africa Economic Outlook 2025
Contact Information:
Website: www.ticgl.com
Economic Dashboard: ticgl.com/dashboard
Analytics Platform: data.ticgl.com/analytics
Disclaimer: This analysis uses the best available data from official sources as of January 2026. All projections are based on current trends and assume sustained policy implementation. Actual outcomes may vary based on economic conditions, policy changes, and external factors. Regional GDP estimates for 2025 are preliminary pending NBS’s official regional report expected in Q2 2026.
© 2026 Tanzania Investment and Consultant Group Ltd (TICGL). All rights reserved.
This report may be cited with proper attribution to TICGL.