
Study samples and participants
Of 1297 P. falciparum isolates collected since July, 2019, 724/828 assessed in Tororo, in eastern Uganda, and 390/469 assessed in Kalongo, in northern Uganda, were successfully evaluated for ex vivo drug susceptibilities (Fig. 1). Baseline characteristics of participants were similar over time, although parasitemias were lower and participant ages higher in northern Uganda (Table 1).
Fig. 1: Study sites.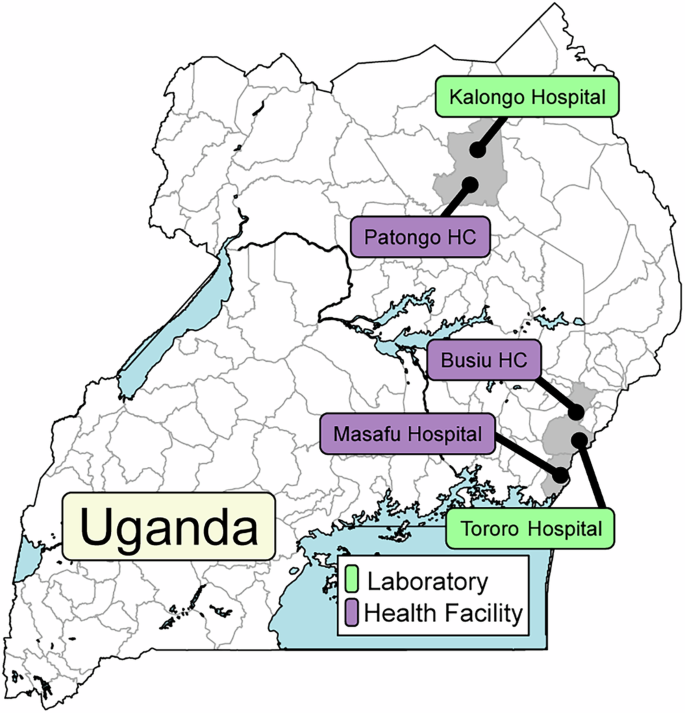
Samples were collected at the indicated health facilities and at clinics adjacent to the two indicated laboratories.
Table 1 Characteristics of study participants and samples studied by ex vivo analysisEx vivo drug susceptibilities
We measured ex vivo susceptibilities of all isolates to nine standard antimalarials. For successful assays, the mean Z factor was 0.75 (SD ± 0.26), indicating robust assays. Median IC50 values were at low nanomolar levels for chloroquine (12.6 nM), MDAQ (7.8 nM), piperaquine (5.4 nM), DHA (2.9 nM), lumefantrine (11.3), mefloquine (15.2 nM), and pyronaridine (1.5 nM), consistent with potent activity, and higher for quinine (115 nM), which is typically less potent than the other studied compounds, and pyrimethamine (35,100 nM), against which resistance is well-established (Table 2; Fig. 2). From 2016 to 2024, marked decreases in susceptibilities (Mann-Kendall Tau ≥±0.2) were seen for DHA, lumefantrine, and mefloquine (Supplementary Table 1). The more marked changes in susceptibilities occurred in eastern Uganda, likely with decreases in susceptibilities to key drugs in northern Uganda before initiation of studies in that region, as suggested by our earlier comparison of the sites (Supplementary Figs. 1 and 2)24. Susceptibilities of Dd2 and 3D7 laboratory reference strains yielded IC50 values similar to those reported previously (Supplementary Table 2). Comparing median values for five drugs studied in both 2010–201322 and the current study, susceptibilities increased for chloroquine (IC50 248 to 12.6 nM), MDAQ (76.9 to 7.8 nM), and piperaquine (19.1 to 5.4 nM) and decreased for DHA (1.4 to 2.9 nM) and lumefantrine (3.0 to 11.3 nM; p < 0.001 for all comparisons).
Fig. 2: Ex vivo drug susceptibilities in Uganda over time.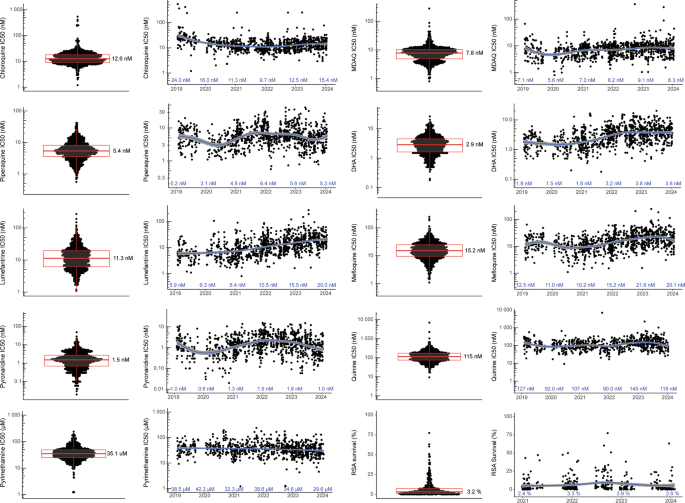
Paired plots present the distribution of susceptibilities for assayed isolates (left; median values shown) and results over time (right; median values shown for each year). Each dot represents an isolate; n for each drug and each year is provided in Supplementary Table 9. There were no technical replicates. Boxes show the first to third quartiles, and whiskers extend to the largest values no more than 1.5X the inter-quartile ranges. X-axis tick marks indicate June 1 of each year. The curves were generated using loess smoothing implemented by geom_smooth; the grey bands represent the 95% confidence intervals. Source data are provided as a Source Data file.
Table 2 Summary of drug susceptibility data (2019–2024)
RSAs were performed on a subset of isolates, including 126 from eastern and 314 from northern Uganda. Consistent with other recent results from Uganda24, but in contrast to results from before 2020 in Uganda23,29 and from southeast Asia30, many isolates had survival above previously-established ART-R cut-offs (Fig. 2). Overall, 78.2% of isolates had 72 h survival >1%, and 35.8% survival >5% of control values. RSA survival increased over time, but with the significance criterion of Mann-Kendall Tau ≥±0.2 the increase was significant only in eastern Uganda.
Genotypes
Of the 1114 isolates with ex vivo results, we characterised sequences of 1070 for known markers of altered drug susceptibility. Prevalences of the PfCRT K76T and PfMDR1 N86Y mutations, which are associated with resistance to chloroquine and amodiaquine7, have been decreasing21, and were very low in recent years in our studied isolates (Fig. 3; Supplementary Table 3). Prevalences of two other common PfMDR1 mutations were similar to those reported previously21, with stable prevalence of the Y184F mutation, which has generally not been associated with drug susceptibility, but may impact on parasite fitness31, and low and decreasing prevalence of the D1246Y mutation. Mutations associated with aminoquinoline resistance in Southeast Asia (PfCRT H97Y, F145I, M343L, G353V32) or South America (PfCRT C350R9) were not detected in any isolates. Definitive increased copy number of pfmdr133 or plasmepsin 2/39,34, which has been associated with decreased susceptibility to lumefantrine and mefloquine or piperaquine, respectively, was not observed, with the vast majority of copy numbers measured at ≤1.5, and copy number of 1.6 seen for 1/661 isolates for pfmdr1 and 4/445 isolates for plasmepsin 2 (Supplementary Table 4). Prevalences of five mutations associated with resistance to SP (PfDHFR N51I, C59R, S108N; PfDHPS A437G, K540E) were very high, as has been the case in Uganda for at least two decades35, and two additional mutations associated with higher level resistance (PfDHFR I164L, PfDHPS A581G19), and seen in recent years at increasing prevalence in western Uganda21, had modest prevalence in both eastern and northern Uganda (Fig. 3; Supplementary Table 3). The PfK13 C469Y and A675V mutations were first identified in southeast Asia and more recently validated as markers of ART-R in northern Uganda11,16,24. These mutations were at moderate prevalence in northern Uganda at the time of our first collections in 2021 (prevalence 30.5% for C469Y and 8.5% for A675V), with stable prevalence since that time. In eastern Uganda, the mutations were at very low prevalence until 2021, with increasing prevalence since that time. Other PfK13 validated or candidate ART-R mutations that have been seen elsewhere in eastern Africa (P441L, C469F, R561H, R622I) were not seen.
Fig. 3: Prevalence of genetic polymorphisms associated with altered drug susceptibility over time at sites in eastern and northern Uganda.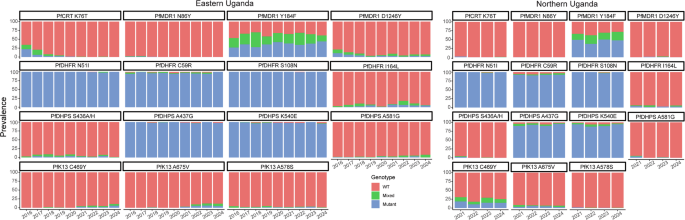
WT wild type. Source data are provided as a Source Data file.
Genotype-phenotype associations
We searched for associations between genotypes identified by sequencing of 80 candidate genes and drug susceptibility phenotypes, considering available data from 2016 to 2024, including older results published previously24, and we included strict criteria for significant associations. Of greatest interest were results for DHA and lumefantrine. Considering PfK13 mutations previously associated with ART-R, the C469Y and A675V mutations were associated with decreased activity (based on IC50s) for DHA and lumefantrine (Fig. 4, Supplementary Tables 5 and 6). Interestingly, these mutations were not associated with RSA results. As described previously8, the PfMDR1 N86Y wild-type allele was associated with decreased susceptibility to lumefantrine and mefloquine and the PfCRT K76T wild-type allele with decreased susceptibility to lumefantrine, although analyses were limited by low prevalence of mutant genotypes. Multiple other polymorphisms were associated with susceptibilities to DHA and lumefantrine (Supplementary Tables 5 and 6). Strong associations included, for lumefantrine, PfCARL D611N (IC50 7.5 nM for wild type, 20.2 nM for mixed, and 44.3 nM for mutant), with increased prevalence over time, and, for DHA, PfMDR1 Y500N (IC50 1.9 nM for wild type, 2.6 nM for mixed, and 5.4 nM for mutant; Fig. 4, Supplementary Tables 5 and 6).
Fig. 4: Associations between genotypes of interest and ex vivo drug susceptibility.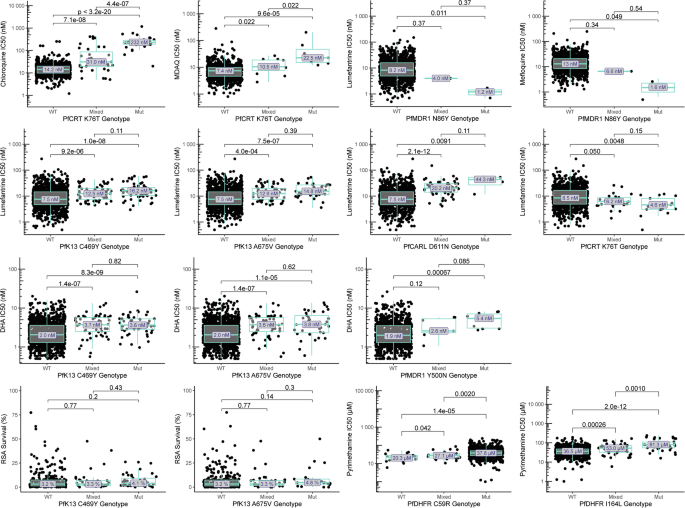
Drug susceptibility for wild-type (WT), mixed WT/mutant, and pure mutant (Mut) isolates are shown for selected drugs and polymorphisms of interest. There were no technical replicates. Centre bounds of boxes correspond to the medians, and minimal and maximal bounds correspond to 25 and 75th percentiles, respectively. Whiskers extend to extreme values no further than 1.5x the IQR from the 25 or 75th percentiles. Benjamini-Hochberg corrected p-values for two-sided, pairwise-Wilcoxon tests are indicated. Additional associations are shown in Supplementary Tables 5–7. Source data are provided as a Source Data file.
To consider the interplay between PfK13 mutations and candidate resistance markers, we assessed shared prevalence. The few PfMDR1 N86Y and PfCRT K76T mutations identified were seen exclusively with PfK13 wild-type sequences. Considering only pure mutant and pure wild-type genotypes to avoid haplotype assumptions, PfCARL D611N was seen with PfK13 wild-type, C469Y mutant, and A675V mutant sequences, while PfMDR1 Y500N was seen with PfK13 wild-type and C469Y mutant sequences. Susceptibilities to lumefantrine were lowest in the presence of PfK13 C469Y and/or A675V mutations with either wild-type or mutant alleles at PfCARL D611N and for DHA were lowest in the presence of the PfK13 C469Y mutation with either wild-type or mutant alleles at PfMDR1 Y500N, although few samples were available for some comparisons (Supplementary Table 7). As with the PfK13 mutations, the PfCARL D611N and PfMDR1 Y500N mutations were not associated with RSA results. The mutations were also associated with decreased susceptibilities in the absence of PfK13 mutations.
For chloroquine and amodiaquine, consistent with earlier results, the PfCRT K76T mutation (Fig. 4, Supplementary Table 8) and other PfCRT mutations that usually form a haplotype, were associated with decreased activity. For pyrimethamine, susceptibilities were poor with the PfDHFR C59R mutation (IC50 37,800 nM) and even poorer with the I164L mutation (86,800 nM; Fig. 4, Supplementary Table 8). No significant associations were seen between studied genotypes and the ex vivo activities of piperaquine, pyronaridine, or quinine, or DHA activity based on the RSA.