Study setting
The Centre for Sexual Health and HIV/AIDS Research (CeSHHAR) Key Populations Programme (formerly Sisters with a Voice) was established in Zimbabwe in 2009 on behalf of the Ministry of Health and Child Care (MoHCC) and the National AIDS Council (NAC). By 2023, the programme operated nationally, in 40 districts across all 10 provinces in Zimbabwe. Services are delivered through a primary care clinic serving a site that is a geographical catchment area identified as a known hotspot for sex work. Sites are urban, rural and highway locations and either have a static clinic (14 sites in 2024) and drop-in centres (14 in 2024) delivering services 5 days a week, or a mobile outreach clinic (126 in 2024) delivering services at least one day a week. At each site, comprehensive sexual and reproductive health services are delivered in line with WHO guidelines54,55,56. These services include free condoms and contraception, provider-initiated HIV testing and counselling, HIV self-testing and counselling (and secondary distribution of self-test kits for partners), syndromic management of sexually transmitted infections (STIs), health education and legal advice supported by a network of peer educators. Additionally, clinics provide long-acting reversible contraception (implants), referral for cervical cancer screening and on-site access to pre-exposure prophylaxis and, since 2020, antiretroviral therapy and viral load testing.
Respondent-driven sampling surveys
Between 2013 and 2023, we conducted five multi-site RDS surveys in locations served by the programme. Surveys in 2013 and 2016 were conducted in 14 programme sites as part of a programmatic impact evaluation, known as the Sisters Antiretroviral Programme for Prevention of HIV, an Integrated Response (SAPPH-IRe) trial23. In 2017, surveys were conducted in three sites including Zimbabwe’s two main cities; Harare and Bulawayo, as part of an exercise to generate a national population size estimate (PSE) for FSW57. In 2021, surveys were conducted in 22 sites participating in the AMETHIST cluster randomised trial20,24. In 2023 we conducted second PSE surveys in Harare and Bulawayo, two of the same cities as the 2017 PSE survey. Surveys conducted in 2013, 2016 and 2021 were in the same 13 programme sites, while surveys conducted in 2017 and 2023 were in the same two programme sites (both major cities) (Supplementary Appendix A, Table S1).
From 2013 to 2023, each survey round maintained similar procedures, including social mapping followed by the purposive selection of initial participants (seeds) representing diverse ages, types of sex work, and geographic locations (Supplementary Appendix A, Table S1). The social mapping and selection of seeds were largely similar across surveys in 2013, 2016, 2017 and 2023, involving visits to sex work venues (e.g. bars, touchlines) within the urban districts of a programme site and conversations with individual FSWs. In 2021, the geographical reach of some programme sites increased and seed selection was expanded to include the peri-urban districts. Seeds were recruited in 2021 through focus group discussions coordinated by programme micro-planners. We interviewed these seeds, collected a blood sample for HIV testing, and provided them with two coupons to distribute among their peers. Women who received a coupon were invited for an interview and then given two coupons to pass on to their peers. We repeated this process for five to seven iterations (waves) exclusive of the seeds. Participants received a US$5 compensation for their time and an additional US$2 for each eligible and recruited referral. Upon arrival for the survey, an informal verification to ensure participants were sex workers and had not previously participated was carried out by Research Assistants. We used a coupon management system to ensure that coupons were genuine and to minimise repeat participation.
Data collection methods evolved over time. From 2013 to 2017 we collected interviewer-administered questionnaire data on tablet computers, which included demographics, sex work, sexual behaviour, HIV prevention, care uptake, and personal network size for RDS adjustment. In 2021 and 2023, we collected these data using audio-computer assisted self-interviewing. HIV testing procedures were the same across surveys as adapted from Zimbabwe’s national testing and counselling guidelines. Determine HIV-1/2 or First Response HIV-1-2 kit antibody testing was used as the first screening test. Where the result was HIV positive, this was confirmed using First Response HIV-1-2 kit or Determine HIV-1/2.
Statistical analysisSite and participant inclusion
For our current analysis, we included the same study sites surveyed in multiple survey rounds. This included 13 programme sites (towns) in 2013, 2016 and 2021 and another two programme sites (cities) surveyed in 2017 and 2023. Sites were included only if they were surveyed in either 2013, 2016 and 2021 (13 towns), or 2017 and 2023 (2 cities). Individuals were included if they were aged 18–39 years and were not missing data on RDS recruiter information and on HIV testing. We focused on women under 40 years of age since HIV prevalence changes are more likely to be reflective of HIV incidence patterns, and because of data sparsity at older ages. All other sites surveyed in these years were excluded from this analysis. As shown in Supplementary Appendix A, Table S1, the analysis in this paper was conducted on a subset of sites and of individuals who were recruited to these multi-site surveys. We appended data from all survey rounds for our analytical dataset (Supplementary Appendix A, Table S1).
Analysis of multi-site RDS surveys
Our approach to RDS analyses for individual surveys have been described in detail elsewhere16,23,24,57. When reporting the specific studies, we followed the STROBE-RDS guidelines22,23,24,58, first describing the population samples recruited at each site and assessing the evidence of bias in our operationalisation of RDS59. We used the RDS-II estimator60 for analysis: dropping seed responses and weighting each woman in each site by the inverse of her network size, that is, the number of other women she reports knowing and could have recruited. For this analysis, observations were weighted using site-normalised inverse degree weights, accounting for the original recruitment structure in each study site.
HIV prevalence over time and by age
Firstly, we calculated crude and RDS weighted HIV prevalence for each survey (2013, 2016, 2017, 2021 and 2023) and for the main analysis, we pooled estimates for 2016–2017 and 2021–2023. To account for the clustered nature of our data by site, we calculate prevalence estimates for each site (cluster), sum them, and divide by the number of sites (n = 13 for 2016–2017 pooled data and n = 2 for 2021–2023 pooled data). We also calculated the minimum and maximum estimates (range) across 13 sites for 2016–2017 pooled data and 2 sites for 2021–2023 pooled data. We compared the difference between our pooled estimate site (cluster) mean for 2016–2017 data and 2021–2023 data by using a t-test and obtained 95% confidence intervals (CI) and a p-value.
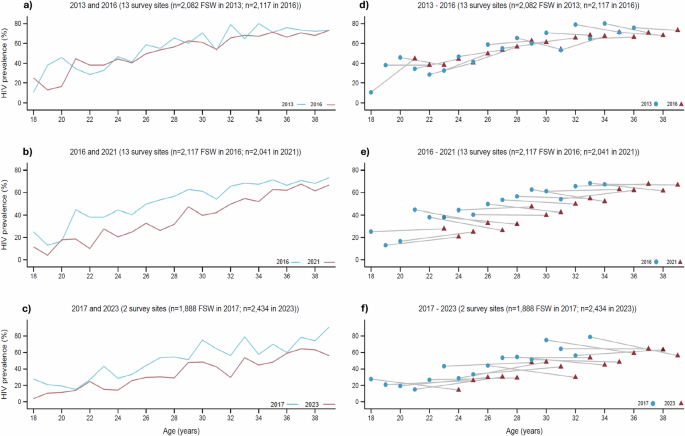
Secondly, to explore the potential underlying trends in HIV incidence we examined age-specific HIV prevalence, both within and between individual survey rounds. For each survey we calculated cluster mean RDS-weighted age-specific HIV prevalence and plotted these for the same 13 sites for years 2013 and 2016, and for 2016 and 2021, as well as for 2 different sites for 2017 and 2023. We also present age-specific HIV prevalence for pooled survey rounds which each included the same 13 + 2 sites (2016–2017 and 2021–2023) and calculated 95% CI and p-value for the difference in cluster means. Our approach was based on age-specific prevalence analysis that has previously been reported for pooled data from RDS surveys conducted between 2011 and 201630.
Thirdly, we used an approach adapted from Hallett et al.26,27,28 to present age-specific HIV prevalence estimates over multiple survey rounds. We calculated HIV prevalence for each year of age by survey round and present the age cohort cluster mean and range across surveys. We present the group a FSW was in during an earlier survey round versus her corresponding age group in the following survey round if she had been surveyed again. We present this data for the same 13 sites (towns) surveyed in 2013, 2016, and 2021, and then separately for the two sites (cities) surveyed in 2017 and 2023. We present data for each survey round separately to account for the varying lengths of time between the surveys, which would not have been possible to capture if our 2016–2017 and 2021–2023 data were pooled. For example, a sex worker who was 18 years old in the 2016 survey would be 23 years old in the 2021 survey.
RDS diagnostics
We hypothesised that a potential explanation for the decline in estimated HIV prevalence between the survey rounds might be that the network sampling process inherent to RDS operated differently across surveys. For each survey in each location at each time point we ran a set of recognised RDS diagnostic tests intended to provide some information on whether the random walk process that theoretically underpins RDS worked appropriately and if seed dependence was sufficiently removed59. Firstly, we generated the recruitment trees by HIV status for each site by year, and for pooled 2016–2017 and 2021–2023 surveys by HIV prevalence, and calculated the percentage of recruiters successfully recruiting two other FSW to the survey excluding the final wave, to understand both the forward recruitment process and the composition of the sample (Fig. 2 & Supplementary Appendix A, Supplementary Fig. S1–S10). Secondly, we generated the combined convergence and bottleneck plots of the estimated HIV prevalence over sample accumulation, calculated the percentage of seeds with recruitment chains reaching the final wave, and estimated HIV prevalence by wave of recruitment to assess whether the estimate appeared to have stabilised over successive waves of recruitment and was independent of initial seed characteristics as well as to show the dynamics of the estimates from each individual seed (bottlenecks) (Supplementary Appendix A, Supplementary Figs. S1–S10). Thirdly, we calculated recruitment homophily with respect to HIV prevalence to understand if HIV positive FSW were more likely to recruit HIV positive peers. We then calculated the ratio of the proportion of FSW < 25 years old and >35 years old in the sample, compared to the proportion of individuals <25 years old and >35 years old who were self-reported by participants to be in their social networks (egonet). As with our main prevalence estimates, we subsequently calculated the cluster means for other RDS diagnostics namely the percentage of recruiters successfully recruiting two other FSW to the survey excluding the final wave, the percentage of seeds with recruitment chains reaching the final wave, HIV prevalence by wave of recruitment and homophily for HIV prevalence, by survey round and for pooled survey rounds (Table 2 & Supplementary Appendix A, Supplementary Fig. S6) so we could use these to compare potential reasons for any changes over time.
Sociodemographic, sex work, risk behaviour & programme engagement characteristics
We hypothesised that a potential explanation for the decline in estimated HIV prevalence between surveys might be that over time women with different background sociodemographic characteristics related to their risk of HIV infection may have entered or exited sex work, and thus that the sociodemographic composition of the sample may differ across years. We calculated cluster summary statistics for sociodemographic variables in each survey and for our pooled survey years, as described earlier. For pooled surveys, we calculated the difference between cluster means. We explored sociodemographic characteristics of age, education and marital status. We also hypothesised that differences in sex work characteristics may have played a role in HIV prevalence decline, specifically the age at starting sex work and years since starting sex work, and the number of other sex workers known and seen in the past month. We explored difference in service engagement between survey rounds analysing variables on HIV testing (ever tested for HIV and tested within the last three months) and engagement in CeSHHAR’s KP programme: clinic attendance in the past 12 months and attendance at a peer-led outreach meeting in the past 12 months. Lastly, we hypothesised that a potential explanation for the decline in estimated HIV prevalence between surveys might be that women more commonly practiced safe sex behaviours or were effectively using HIV prevention products. We compared the number of clients women reported in the past week, the number of steady partners, condomless sex in the previous month with any partner, self-reported STI symptoms and PrEP use.
Adjusted analysis
Lastly, we ran an adjusted analysis using modified Poisson regression to compare our pooled HIV prevalence estimates. In all our models we include programme site as a fixed effect. We then adjusted our model separately for sociodemographic factors, sex work specific factors, risk behaviours and HIV service engagement factors. Our analyses were conducted in R programming language (version 4.4.2).
Modelled HIV prevalence and HIV incidence
In addition to our analysis of empirical RDS survey data we modelled estimates of HIV prevalence and HIV incidence for FSW in Zimbabwe over the same time period, including the presence of a sex worker programme in the model from 2010. HIV Synthesis is an individual-based simulation model of HIV transmission, progression and the effect of ART that has been previously described29. In brief, each time the model is run, a simulated population of adults is generated (Supplementary Appendix B). Variables are updated every 3 months from 1989 and include age, sex, the number of short term condomless sex partners, presence of a long term condomless sex partner, use of PrEP, HIV testing, HIV acquisition and additionally, in people living with HIV, viral load, CD4 count, use of specific ART drugs, adherence to ART, resistance to specific drugs and risk of HIV-related death (Supplementary Appendix B). All women in the model have a risk of initiating sex work based on several factors including age, overall population levels of sexual risk behaviour and previous experience of being a sex worker. A sex worker programme was modelled from 2010 onwards. The programme was assumed to reduce the likelihood of FSW interrupting treatment and being lost at diagnosis and improve adherence, to reflect for example the impact of ART counselling. Sex worker programmes were also assumed to provide the following additional benefits: 6-monthly HIV testing, reduction in the number of condomless partners (i.e. greater condom use) and increased willingness to take PrEP. Key model outputs on FSW are shown in Supplementary Appendix A, Table S12, along with empirical estimates from the AMETHIST study. While the model was not directly calibrated to FSW incidence (this is difficult to align with FSW prevalence along with other key epidemic characteristics e.g. 90-90-90s), on the whole, modelled estimates were in line with those reported in the AMETHIST study.
Ethical approvals
The SAPPH-IRe trial surveys conducted in 2013 and 2016 received ethical approval from the Medical Research Council of Zimbabwe (Ref: MRCZ/A/1762), the London School of Hygiene and Tropical Medicine (Ref: 6524) and the University College London (Ref: 4948/001). The PSE 2017 surveys were approved by the Medical Research Council of Zimbabwe (Ref: MRCZ/A/1942), the London School of Hygiene and Tropical Medicine (Ref: 9686), the University College London (Ref: 6084/003) and RTI International (Ref: 13975). The AMETHIST trial surveys conducted in 2021 were approved by the Medical Research Council of Zimbabwe (Ref: MRCZ/A/2559), the London School of Hygiene and Tropical Medicine (Ref: 19123), and the Liverpool School of Tropical Medicine (Ref: 19-115). The PSE 2023 surveys were approved by the Medical Research Council of Zimbabwe (Ref: MRCZ/A/2867) and the London School of Hygiene and Tropical Medicine (Ref: 26849). Written informed consent, in English, Shona or Ndebele, was obtained for survey participation before interviews were done and blood samples were taken.
Reporting summary
Further information on research design is available in the Nature Portfolio Reporting Summary linked to this article.