🚨 Critical FindingsTax-to-GDP ratio stagnant at 11.5-12.8% while Vision 2050 requires 20%+71.8% of workforce in informal sector contributing minimal taxes despite 40-46% GDP shareBudget grew 66% (2020-2025) while tax revenue grew only 62% from lower baseTZS 15.5 trillion annual revenue loss from structural inefficienciesCommercial borrowing doubled to 25.5% of budget at expensive 7-10% interest ratesExecutive Summary
Tanzania’s economy faces a critical fiscal challenge: while GDP has grown an impressive 78% from TZS 118.7 trillion (2017) to TZS 211.2 trillion (2025), the tax system has failed to capture proportional revenue. The tax-to-GDP ratio remains stubbornly flat at 11.5-12.8%, well below the Sub-Saharan African average of 16.5%.
This comprehensive analysis of eight years of fiscal data (2017-2025) reveals fundamental misalignments between economic growth, budget expansion, and revenue collection. The informal sector—representing 45-46% of GDP and employing 76% of the workforce—escapes taxation almost entirely, creating an annual revenue loss of approximately TZS 8-10 trillion.
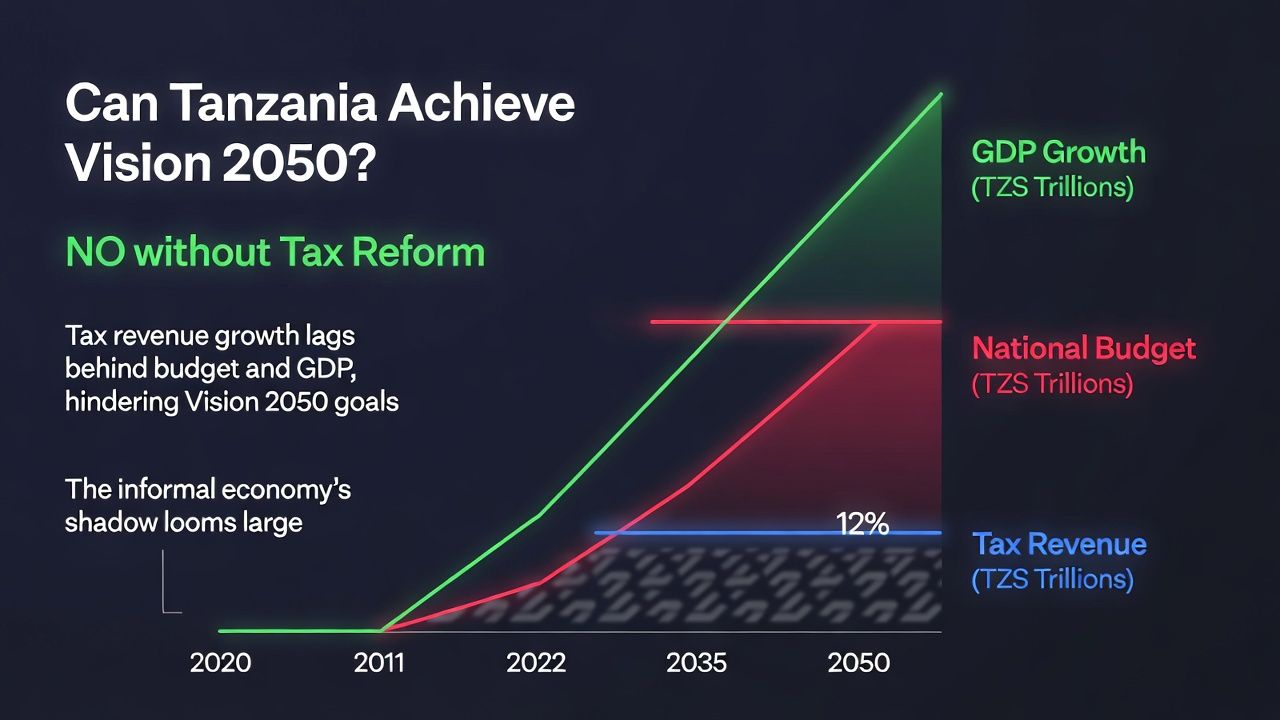
The stark conclusion: Without major tax system reforms, Tanzania’s Vision 2050 ambitions are unachievable. Current trajectory projects a debt crisis by 2028-2030, with fiscal deficits worsening from 2.6% to 4.0% of GDP despite economic growth.
Tanzania’s Fiscal Landscape: Key Indicators (2025)
12.8%
Tax-to-GDP Ratio (Target: 20%)
71.8%
Informal Employment Share
62%
Domestic Revenue Coverage of Budget
TZS 15.5T
Annual Revenue Loss from Inefficiencies
0.88
Tax Buoyancy (Optimal: 1.0+)
4.0%
Fiscal Deficit as % of GDP
2.82M
Active Taxpayers (62M population)
25.5%
Commercial Borrowing Share of Budget
1. Economic Growth Performance (2017-2025)YearReal GDP Growth (%)Nominal GDP (TZS Trillion)GDP (USD Billion)GDP Per Capita (USD)Inflation Rate (%)2017-118.7~701,150-20187.1124.0721,1653.520196.1134.5741,1803.420205.0145.4761,1903.320214.8156.2771,2003.720225.0170.8781,2204.320235.2188.8791,2403.82024 (Est.)5.5199.2831,2603.32025 (Proj.)6.0211.2871,2803.42. Tax Revenue Collection Trends (2018-2026)
Tax Revenue vs Budget Growth Comparison
Fiscal YearTotal Collection (TZS Trillion)Growth Rate (%)Tax-to-GDP Ratio (%)Target Achievement2018/19~14.3-11.5-2019/20~15.58.411.5-2020/21~16.77.711.5-2021/22~18.07.811.5-2022/2319.6 / 24.14*8.911.5-11.7Achieved2023/2421.7 / 27.64*10.7 / 14.5*11.5-12.1Achieved2024/25 (Target)25.5 / 32.27*-12.8 / 12.5*In Progress2025/26 (Projected)~27.05.912.8Projected
*Dual figures reflect different data sources – first from NBS/analytical reports, second from TRA official collections
⚠️ Critical Challenge: Stagnant Tax-to-GDP Ratio
Despite consistent absolute revenue growth averaging 8-10% annually, the tax-to-GDP ratio remained stubbornly flat at 11.5% for five consecutive years (2018-2022), showing only modest improvement to 12.8% by 2024/25. This is significantly below the Sub-Saharan Africa average of 16.5%, representing approximately TZS 6-8 trillion in foregone annual revenue.
Tax Buoyancy Problem: At 0.88, for every 1% GDP growth, tax revenue grows only 0.88%, indicating structural inefficiency in the tax system.
3. National Budget Evolution and Financing Gap (2020-2026)Fiscal YearTotal Budget (TZS T)Budget (USD B)Growth Rate (%)Domestic Revenue (TZS T)Tax Share (TZS T)Revenue Coverage (%)Deficit (% GDP)2020/2134.1~14.2-22.516.766%2.62021/2236.6~15.27.324.018.066%3.62022/2341.5~17.313.427.019.665%3.92023/2444.418.47.029.521.766%3.92024/2554.821.523.434.224.0-25.562%4.02025/26 (Proj.)56.522.23.136.027.064%4.0⚠️ Widening Financing Gap
Six-Year Trend Analysis (2020/21 to 2025/26):
Budget increased by 66% (TZS 34.1T → 56.5T)Tax revenue increased by 62% (TZS 16.7T → 27.0T)Domestic revenue consistently covers only 62-66% of total budgetBudget deficit worsened from 2.6% to 4.0% of GDPThe absolute budget-revenue gap nearly doubled from TZS 11.6T to 20.6T
Critical Issue: Budget growth outpaces revenue growth, creating a structural fiscal deficit requiring increased borrowing (now 30-35% of budget) or donor funding, threatening long-term debt sustainability.
4. Budget Financing Structure Analysis
Budget Financing Sources (2023/24 vs 2024/25)
Financing Source2023/24 (TZS T)2023/24 Share (%)2024/25 (TZS T)2024/25 Share (%)Sustainability RiskTax Revenue21.748.9%24.0-25.543.8-46.5%Moderate-HighNon-Tax Revenue7.817.6%8.7-9.715.9-17.7%Low-ModerateTotal Domestic Revenue29.566.4%34.262.4%-Foreign Grants~1.53.4%~1.01.8%High (declining)Concessional Loans~5.512.4%~5.610.2%ModerateCommercial Borrowing~7.917.8%~14.025.5%Very HighTotal External Financing~14.933.6%~20.637.6%-TOTAL BUDGET44.4100%54.8100%-⚠️ Alarming Trend: Commercial Borrowing Surge
Most concerning trend: Commercial borrowing jumped from 17.8% to 25.5% of budget—more than doubling in absolute terms from TZS 7.9T to 14.0T. This carries high interest rates (7-10% vs. 1-3% for concessional loans), significantly increasing debt servicing costs and reducing fiscal space for development.
Key Risks:
Declining domestic revenue share: From 66.4% to 62.4%Shrinking foreign grants: From 3.4% to 1.8%External dependence increased: From 33.6% to 37.6%Debt servicing consuming nearly 20% of revenue5. The Informal Sector Challenge: Root Cause of Fiscal Gap
Informal Sector Impact on Tanzania’s Economy
IndicatorFormal SectorInformal SectorImpact on RevenueShare of GDP54-55%45-46%Massive revenue lossShare of Employment24%76%Narrow tax baseTax Compliance RateModerate-HighVery LowLow collectionsEconomic VisibilityTrackedLargely untrackedPlanning challengesBusiness Registration RateLow (0.2 per 1000 pop.)UnregisteredEnforcement difficulty💡 Quantifying the Informal Sector Revenue Loss (2024 Baseline)
Using Conservative Estimates:
Informal sector GDP: 42% of TZS 199.2 trillion = TZS 83.7 trillionPotential revenue at 12% collection rate: TZS 10.0 trillion annuallyActual collection from informal sector: ~TZS 1.5-2.0 trillionAnnual revenue loss: TZS 8-8.5 trillion per year
What this lost revenue could fund:
Represents 15-18% of total national budgetCould fully fund development budget (currently ~32% of total) with surplusEquivalent to entire health and education budget combinedWould reduce budget deficit from 4.0% to 0.5% of GDPCumulative loss 2018-2024: approximately TZS 40-50 trillion6. Regional Comparison: Tanzania vs East African PeersCountryTax-to-GDP Ratio (%)GDP Per Capita (USD)Informal Sector (% GDP)Revenue PerformanceTanzania11.7-12.81,20045-46Below potentialKenya13.7-18.02,100~35GoodRwanda15.0-16.3966~40ExcellentUganda12.1-15.11,046~43ModerateBurundi15.2-18.0238~38GoodEAC Average12.74—LMIC Average14.51—SSA Average16.5—💡 Key Insight: Significant Revenue Underperformance
Tanzania collects 4-5 percentage points less than the Sub-Saharan Africa average. At current GDP levels (TZS 199.2 trillion in 2024), this represents approximately TZS 6-8 trillion in foregone annual revenue.
Even Rwanda, with lower GDP per capita (USD 966 vs Tanzania’s USD 1,200), achieves a significantly higher tax-to-GDP ratio (15-16.3%), demonstrating that effective tax administration and formalization can overcome structural constraints.
7. Vision 2050 Projections: Required vs Current Trajectory
Business-as-Usual vs Vision 2050 Requirements
IndicatorCurrent (2024)Vision 2050 TargetRequired Annual GrowthGap AnalysisGDP (USD)85 billion1 trillion10%Current: 5.5% (Shortfall: 4.5%)Tax Revenue (USD)10 billion140 billion~11%Current: ~8% (Shortfall: 3%)Active Taxpayers2.82 million20+ million8% annuallyCurrently: DecliningInformal Sector Share46%<25%-1pp/yearCurrently: StableRevenue Gap Without Reform: Business-as-Usual Scenario (2025-2050)YearProjected GDP (USD B)Tax Revenue at 13% (USD B)Required Revenue (USD B)Annual Gap (USD B)20259011.713.51.8203013016.926.09.1203520026.050.024.0204035045.587.542.0205065084.5140.055.5⚠️ Critical Conclusion
Without major reforms, Tanzania will collect only 60% of required revenue by 2050.
To achieve Vision 2050 goals, annual tax revenue must increase from current USD 10 billion to USD 140 billion (approximately TZS 350 trillion), requiring GDP growth to double from 5.1% to at least 10% annually—a feat that demands comprehensive structural transformation.
8. Data-Driven Reform RecommendationsIntegrated Reform Package: Projected Outcomes (2025-2030)
Combined Reform Impact Projection
Reform Initiative2025 Impact (TZS T)2027 Impact (TZS T)2030 Impact (TZS T)Cumulative 6-Year (TZS T)Priority LevelInformal Sector Formalization+1.0+2.5+3.812.3CRITICALTax Base Expansion+1.5+3.2+4.215.8CRITICALTax Administration (TRA)+2.0+4.0+4.719.2HIGHTax Buoyancy Improvement+1.5+2.8+3.513.1CRITICALSectoral Taxation+1.0+3.5+5.516.4HIGHBudget Efficiency Gains+1.5+3.0+4.014.7HIGHTOTAL POTENTIAL+8.5+19.0+25.7+91.5-Priority 1: Formalize the Informal Sector CRITICAL – Highest Impact
Target: Reduce informal sector from 71.8% of workforce (40-46% GDP) to 50% workforce (30% GDP) by 2030
Potential Revenue Impact: +TZS 3.8 trillion annually by 2030 | Cumulative six-year gain: ~TZS 12.3 trillion
Recommended Actions:
Digital payment mandates for businesses >TZS 10M annual turnoverSimplified tax regime for SMEs (3-5% turnover tax)Mobile money transaction taxation expansion (potential: TZS 1.2T from ~$50B annual transactions)Business registration incentives (90-day tax holiday + simplified licensing)Sector-specific presumptive taxes for agriculture and commercePriority 2: Broaden Tax Base and Improve Buoyancy CRITICAL
Target: Increase registered taxpayers from 2.82M to 8M by 2030; improve tax buoyancy from 0.88 to 1.05
Potential Revenue Impact: +TZS 4.2 trillion from new taxpayers + TZS 3.5T from buoyancy improvement = TZS 7.7T annually
Current Coverage Analysis:
Formal Employees: 8.5M potential, only 2.5M registered (29% coverage) → Target: 60% by 2030SME Owners: 4M potential, only 0.2M registered (5% coverage) → Target: 30% by 2030Professionals: 1.2M potential, only 0.1M registered (8% coverage) → Target: 50% by 2030Commercial Agriculture: 2M potential, only 0.02M registered (1% coverage) → Target: 20% by 2030
Actions: Automated tax filing (e-TRA expansion), risk-based auditing, third-party data matching (banks, telcos, property registries), employer withholding enforcement for gig economy, property tax modernization
Priority 3: Increase Tax-to-GDP Ratio to Regional Standards
Pathway to 18% by 2030: From current 12.8% to 13.5% (2025) → 14.5% (2026) → 15.5% (2027) → 16.5% (2028) → 17.0% (2029) → 18.0% (2030)
Cumulative Additional Revenue (2025-2030): TZS 38.2 trillion
Benchmark: 18% target is ambitious but achievable with comprehensive reforms, aligning with Rwanda (15-16.3%) and approaching SSA average (16.5%)
Priority 4: TRA Quick Wins Package
Total Impact: +TZS 4.7T annually by 2027
Initiatives:
Risk-based audits (Evidence: 15% revenue increase in pilot) → +TZS 1.2TDigital tax filing to 90% adoption → +TZS 0.8TVAT refund backlog clearance (TZS 2T backlog) → +TZS 0.5TCustoms automation (reduce clearance from 7 to 2 days) → +TZS 0.7TThird-party data integration (banks, telcos, utilities) → +TZS 1.5TPriority 5: Sector-Specific Taxation Strategies
Agriculture Sector (26-28% GDP, ~8% tax contribution):
Current gap: Should contribute TZS 7-8T, contributes ~TZS 2TActions: Presumptive tax on commercial farmers (>10 acres or TZS 50M revenue), input subsidy tied to revenue declarationPotential: +TZS 2.5T
Digital Economy (emerging, <1% tax contribution):
Mobile money: $50B transactions annuallyActions: Comprehensive digital service tax (2-3%), platform withholding (Uber, Jumia, etc.)Potential: +TZS 1.2T
Real Estate/Property (5-7% GDP, ~3% tax contribution):
Actions: Digital land registry integration, annual property tax based on cadastral valuesPotential: +TZS 1.8T9. The Bottom Line: A Tale of Two Futures❌ CURRENT TRAJECTORY (No Reform)Tax-to-GDP stagnates at 13-14%Fiscal deficit reaches 6-7% of GDP by 2030Public debt breaches 60% of GDP by 2028 → debt crisisBudget cuts to social servicesCommercial borrowing costs consume 25% of revenueVision 2050: IMPOSSIBLE✅ REFORM TRAJECTORY (Comprehensive Action)Tax-to-GDP reaches 20% by 2035Fiscal deficit declines to 1.5% of GDP by 2030Public debt stabilizes at 45% of GDPDevelopment spending increases from 30% to 45% of budget85% domestic financing by 2035Vision 2050: ACHIEVABLEFinal Answer: Je vinaendana? (Do they align?)HAPANA KABISA. (Absolutely not.)
Tanzania’s economic growth (78% in 8 years), budget expansion (66% in 6 years), and tax collection (62% in 8 years from very low base) are fundamentally misaligned because:
The economy grows where taxes can’t reach – 71.8% informal workforce, 40-46% informal GDPBudget ambitions exceed fiscal reality – 27.5% budget-to-GDP ratio with only 62% domestic coverageTax system is structurally obsolete – designed for 1980s formal economy, not 2025 digital-informal realityThe gap is accelerating, not closing – deficit from 2.6% to 4.0% GDP in 5 yearsNini kinapaswa kufanyika? (What should be done?)
Not incremental adjustments, but fundamental restructuring:
Make the invisible economy visible (formalization)Make the tax system fit the economy (not vice versa)Make budgets match realistic revenue capacityMake this transformation THE national priority for 2025-2030
The data is unambiguous: Without comprehensive reform starting immediately, Tanzania will face a fiscal crisis by 2028-2030. With reform, Vision 2050 remains within reach. The choice is clear. The time is now. The data has spoken.