Climate change is a pressing global challenge requiring drastic reductions in greenhouse gas (GHG) emissions1. Switzerland emits approximately 13 tons of CO₂ per capita each year—more than twice the global average of 6 tons2. Mobility is a major driver of these emissions. The transport sector accounts for nearly 33% of total CO₂ emissions, with passenger transport alone responsible for over 75% of Switzerland’s transport-related emissions3. While other sectors (e.g., industry and buildings) have significantly cut emissions, transport-related emissions have remained almost at the same level since 19904. Therefore, significant changes in individual mobility behavior, supported by targeted policy measures, are essential5. Following the polluter-pays principle6, one approach is to target individuals who disproportionately contribute to GHG emissions7. Research indicates that mobility-related emissions are heavily unequally distributed. A small fraction of individuals—typically the top 10–20%—are responsible for an inordinately large share of transport emissions8,9,10, thus resembling the concept of global carbon inequality11. These individuals are more likely to be male12,13, more affluent9,10, and to live in suburban areas9,13. However, other studies suggest the need for a more nuanced perspective regarding spatial characteristics, as individuals in large urban areas were also found to emit higher levels of GHG emissions compared to the average14.
The present study investigates whether similar patterns of mobility-related inequality are present in Switzerland. The goal is to establish the existence and extent of domestic mobility inequality within Switzerland. Leveraging data of the Swiss Mobility and Transport Microcensus (MTMC) from 2015 (N = 57,090) and 2021 (N = 55,018), we analyze the distribution of daily domestic travel distance across individuals to determine whether a small group of high travelers accounts for a significant share of total mobility. In addition, we test the predictive power of spatial (e.g., level of urbanization) and sociodemographic characteristics (e.g., gender, income) for variations in daily domestic travel distances.
The distribution of daily domestic travel distances in Switzerland demonstrates significant inequality among the population (see Fig. 1). In both years, a small percentage of individuals accounted for a disproportionately large share of the total mobility. In 2015, the upper 10% contributed 53% of total daily domestic distance, followed by 56% in 2021 (see Table 1; full descriptive statistics are provided in Supplementary Materials A). Thus, the top 10% of the population engaged in mobility contribute more to the daily domestic travel distance as the other 90% combined—not counting those who reported no mobility. The Gini coefficients highlight this pattern (2015: 0.72; 2021: 0.76). Non-overlapping 95% bootstrap confidence intervals for each year’s Gini coefficient (2015: CI = [0.7145–0.7211]; 2021: CI = [0.7560–0.7623]) show that the slight increase in inequality over the years is statistically significant.
Fig. 1: Lorenz curves of daily domestic travel distances in Switzerland for the years 2015 and 2021.
The dotted vertical line marks the 90th percentile of the population.
Table 1 Descriptive statistics of daily domestic travel distances (in km) among the groups for the years 2015 and 2021
An analysis by mode of transport reveals that motorized individual vehicles (MIV) account for the majority of distance traveled (see Table 2) and mainly drive the overall inequalities. An exponential increase in MIV distance is observed across groups; similarly, public transport (PT) distances grow exponentially toward the top deciles. In contrast, active transport (AT) is distributed evenly across all groups (see full descriptive statistics in Supplementary Materials B).
Table 2 Average modal share in % of total daily travel distance across mobility groups (Groups 1–10) for the years 2015 and 2021
We further analyzed the identified groups with respect to spatial characteristics. Urban residents are more prevalent in lower mobility groups and gradually decrease as the mobility increases. Conversely, rural municipalities display an opposite trend. Their share remains steady among low mobility groups and then rises sharply toward the top deciles. This pattern is consistent across both years. Still, the results do not suggest that the differences in mobility behavior among the groups can be entirely explained by a simple urban–rural divide. Although the proportion of urban residents decreases towards the top deciles, it still accounts for 43% in the top decile. A further graphical analysis plotting daily domestic travel distances on a map of Switzerland at the municipal level supports this assessment (see Supplementary Materials C).
Regarding sociodemographic characteristics, analyses reveal consistent differences. Women are overrepresented among individuals with low daily travel distances, while men are more common in the highest mobility deciles. The average age is highest among individuals with no reported mobility, and there is a trend of decreasing age in higher mobility deciles. Higher mobility is positively associated with socioeconomic status: the most mobile individuals are more likely to report monthly household incomes above CHF 12,000 and to hold tertiary qualifications. Conversely, low-income and less-educated individuals tend to be concentrated in the low mobility segments (see full descriptive statistics in Supplementary Materials D).
The R2 values of the random forest regression models predicting daily domestic travel distances are weak to moderate (2015: R2 = 0.217; 2021: R2 = 0.223). Top predictors based on relative permutation importance (see Fig. 2) across both datasets include leisure activities and commuting as reasons for mobility, along with household income (2015) and occupational status (2021) as sociodemographic characteristics. Spatial characteristics (quality of PT infrastructure and degree of urbanization) are among the predictors with lower relative permutation importance across both datasets. Partial dependence plots further visualize the relationship between each predictor and daily domestic distance (see Fig. 3). However, it is worth noting that the differences in permutation importance of the predictors within each dataset are relatively small. A full overview of the descriptive statistics for the predictor variables is provided in Supplementary Materials D.
Fig. 2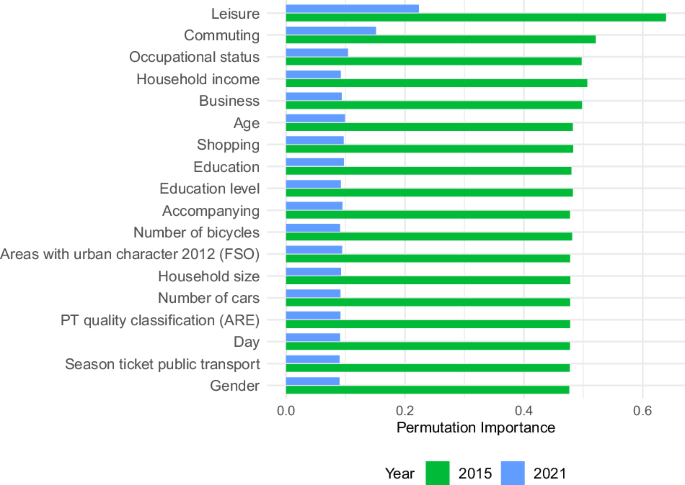
Relative permutation importance for the years 2015 and 2021.
Fig. 3: Partial dependence plots for the years 2015 and 2021.
Partial dependence plots display the marginal effect of each predictor on the standardized daily travel distance. X-axis shows the raw predictor scales or, for factors, their integer codes. Y-axis shows the model’s average predicted z-distance, with all other covariates held at their observed values. Calculation of daily domestic travel distances based on the weighted MTMC data.
Taken together, these results provide three key findings. First, mobility behavior is unevenly distributed across Switzerland. This aligns with research showing that GHG emissions in general15 and mobility behavior specifically (e.g., Canada10, France13, Germany9, UK8) are marked by significant inequality. Overall, the level of mobility-related inequality in Switzerland is slightly higher but still comparable to that in Germany, where the top 10% of emitters were found to account for 51% of total emissions9. Notably, the inequality in Switzerland is primarily driven by MIV and long-distance train travel, while AT is relatively evenly distributed among all groups.
National mobility surveys in Switzerland, as in many countries, are crucial for shaping transport and climate policy by providing comprehensive insights into individual travel behavior16. To date, official reports at the national17,18 and cantonal level19,20 have primarily focused on average metrics such as mean travel distances, modal shares, and differences between groups (e.g., gender or urban-rural), while giving limited attention to the inequality of mobility. Media coverage has followed suit, emphasizing national trends but rarely exploring disparities within the population21,22. The results of our study emphasize that a more differentiated perspective on who contributes to what level of mobility may be beneficial, especially when developing measures to reduce transport-related GHG emissions more effectively. Second, this mobility-related inequality in Switzerland has increased over time. Although mobility declined in 2020 (see Supplementary Materials on OSF) due to the COVID-19 pandemic, inequality increased in 2021 compared to 2015. Interestingly, all groups showed a reduction in traveled distances. However, the decrease was more significant in the lower deciles compared to the top deciles. For example, daily domestic travel distance in the top decile dropped by 8% from 2015 to 2021, while the average decline for the other deciles was 25%. This suggests that those in the top decile may be more resistant to changing their routines (e.g., commuting less due to remote work) while having the resources to cope with restrictions and maintain their established mobility behavior. Third, mobility-related, sociodemographic, and spatial characteristics are associated with mobility behavior, reflecting trends similar to existing literature9,10,12,13. However, taking the machine learning approach revealed that these variables have only weak predictive power for the daily domestic travel distance. Thus, our findings caution against overly simplistic classifications like ‘the typical high-mobility individual.’ A promising direction for future research is to investigate the motivations and behavioral mechanisms of highly mobile individuals. Classification models could be used to identify which characteristics best predict exceptionally high mobility, and qualitative approaches (e.g., interviews) may provide additional insight into the underlying decision-making processes and mobility needs. From a practical perspective, policy measures and interventions are necessary to engage those most responsible for mobility-related emissions. Instead of targeting specific individuals based on sociodemographic or spatial characteristics, the measures should be designed to naturally and progressively target high-mobility behaviors while minimizing impact on those who engage in lower mobility. At the same time, people who engage in low mobility behaviors might be rewarded or incentivized not to switch to higher-distance travel.
Some limitations of the study should be noted. First, the applied machine learning approach does not allow for causal inference. While random forests help to understand relationships between predictors and mobility behavior, they cannot establish causal effects. Future research should address this, for example, by using longitudinal data. Second, our study focused on domestic travel distances since the MTMC primarily provides detailed, reliable data on trips within Switzerland. Only a third of MTMC participants answered questions about international air travel in 2015 and 2021. Exploratory analyses of air travel distances show a similar, although less pronounced, pattern of inequality. Again, the top deciles contribute significantly more to the total air travel distances. A full overview is provided in Supplementary Materials E.
In conclusion, our study shows the unequal distribution of mobility behavior in Switzerland using data from the Swiss MTMC. A small group of individuals accounts for a disproportionate share of total mobility. This highlights the need for a more nuanced view of who is responsible for what amounts of mobility. While aggregated metrics like average travel distances help describe the overall situation, our data suggest that high-mobility individuals in the top deciles need targeted efforts to reduce their GHG emissions. In addition, random forests show that sociodemographic, spatial, and mobility-related characteristics only have weak predictive power in explaining daily domestic distance.