
If you are wondering whether Novartis shares still offer value at around CHF 114.04, it starts with understanding how the current price lines up against a few different valuation checks.
The stock has returned 4.1% over the last 7 days, 8.1% over 30 days, 5.1% year to date, 29.7% over 1 year, 59.5% over 3 years and 71.0% over 5 years. This gives you some context before weighing up what you are paying today.
Behind these moves, investors have been focused on Novartis’ position as a major global pharmaceuticals and biotech company and how its portfolio and pipeline fit into long term healthcare demand. Broader sentiment toward large healthcare names has also been an important backdrop for how the market is currently pricing the stock.
Right now, Novartis has a valuation score of 5 out of 6 on our checklist of value indicators. This sets up a closer look at how different valuation methods line up on the stock and hints at an even richer way of thinking about value that we will come to at the end of this article.
Find out why Novartis’s 29.7% return over the last year is lagging behind its peers.
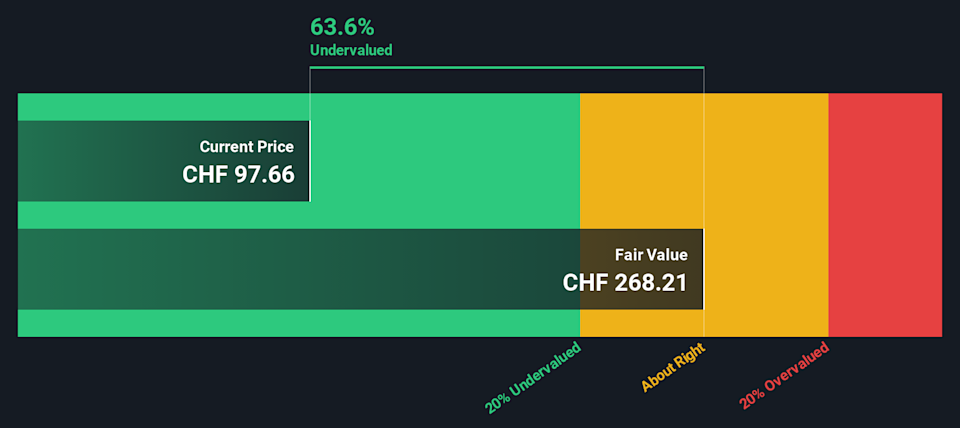
A Discounted Cash Flow model takes estimates of the cash a business could generate in the future, then discounts those cash flows back to today to arrive at an estimate of what the company might be worth now.
For Novartis, the model used is a 2 Stage Free Cash Flow to Equity approach based on cash flow projections. The latest twelve month free cash flow is about US$18.16b. Analyst inputs run through 2030, with projected free cash flow of roughly US$21.24b in 2030, and Simply Wall St extrapolates further projections beyond the explicit analyst window.
Putting all of those discounted cash flows together gives an estimated intrinsic value of about CHF 263.87 per share. Compared with the current share price of roughly CHF 114.04, the DCF output suggests an implied discount of around 56.8%, which points to the shares screening as materially undervalued on this model alone.
Result: UNDERVALUED
Our Discounted Cash Flow (DCF) analysis suggests Novartis is undervalued by 56.8%. Track this in your watchlist or portfolio, or discover 881 more undervalued stocks based on cash flows.
 NOVN Discounted Cash Flow as at Jan 2026
For a profitable company like Novartis, the P/E ratio is a useful yardstick because it links what you pay per share to the earnings that the business is currently producing. Investors usually accept a higher P/E when they expect stronger growth or see lower risk, and look for a lower P/E when growth is more modest or risks are higher.
Story Continues
Novartis currently trades on a P/E of 19.0x, compared with the Pharmaceuticals industry average of about 23.0x and a peer group average of 86.3x. On those simple comparisons alone, the shares sit below both the sector and peer levels.
Simply Wall St also calculates a Fair Ratio for Novartis of 37.3x. This is a proprietary estimate of what the P/E might be, given the company’s earnings growth profile, profit margins, industry, market cap and risk factors. That makes it more tailored than a basic check against broad industry or peer averages, which can be skewed by very different business models.
With the current P/E of 19.0x sitting below the Fair Ratio of 37.3x, the shares screen as undervalued on this preferred multiple view.
Result: UNDERVALUED
 SWX:NOVN P/E Ratio as at Jan 2026
P/E ratios tell one story, but what if the real opportunity lies elsewhere? Discover 1446 companies where insiders are betting big on explosive growth.
Earlier we mentioned that there is an even better way to think about valuation. That is where Narratives come in, giving you a simple way to spell out your view on Novartis by linking its story to a financial forecast and then to a fair value. All of this is available within the Simply Wall St Community page that millions of investors use. You can set your own assumptions for future revenue, earnings and margins, see how your Fair Value compares with the current price to help inform your investment decisions, watch your Narrative update as fresh news or earnings are added, and even position yourself at one end of the range with a view closer to the CHF 79.67 fair value or at the other with a view nearer CHF 120.06, depending on what you think the company can achieve.
Do you think there’s more to the story for Novartis? Head over to our Community to see what others are saying!
SWX:NOVN 1-Year Stock Price Chart
This article by Simply Wall St is general in nature. We provide commentary based on historical data and analyst forecasts only using an unbiased methodology and our articles are not intended to be financial advice. It does not constitute a recommendation to buy or sell any stock, and does not take account of your objectives, or your financial situation. We aim to bring you long-term focused analysis driven by fundamental data. Note that our analysis may not factor in the latest price-sensitive company announcements or qualitative material. Simply Wall St has no position in any stocks mentioned.
Companies discussed in this article include NOVN.SW.
Have feedback on this article? Concerned about the content? Get in touch with us directly. Alternatively, email editorial-team@simplywallst.com