
Navitas Semiconductor Corporation stock closed Monday at $11.73, down 3.85%, extending a weeks-long technical downtrend. However, shares surged roughly 20% after-hours on news that Navitas had been selected for a U.S. Army-backed program to develop next-generation 10 kV silicon carbide devices for mission-critical defense systems.
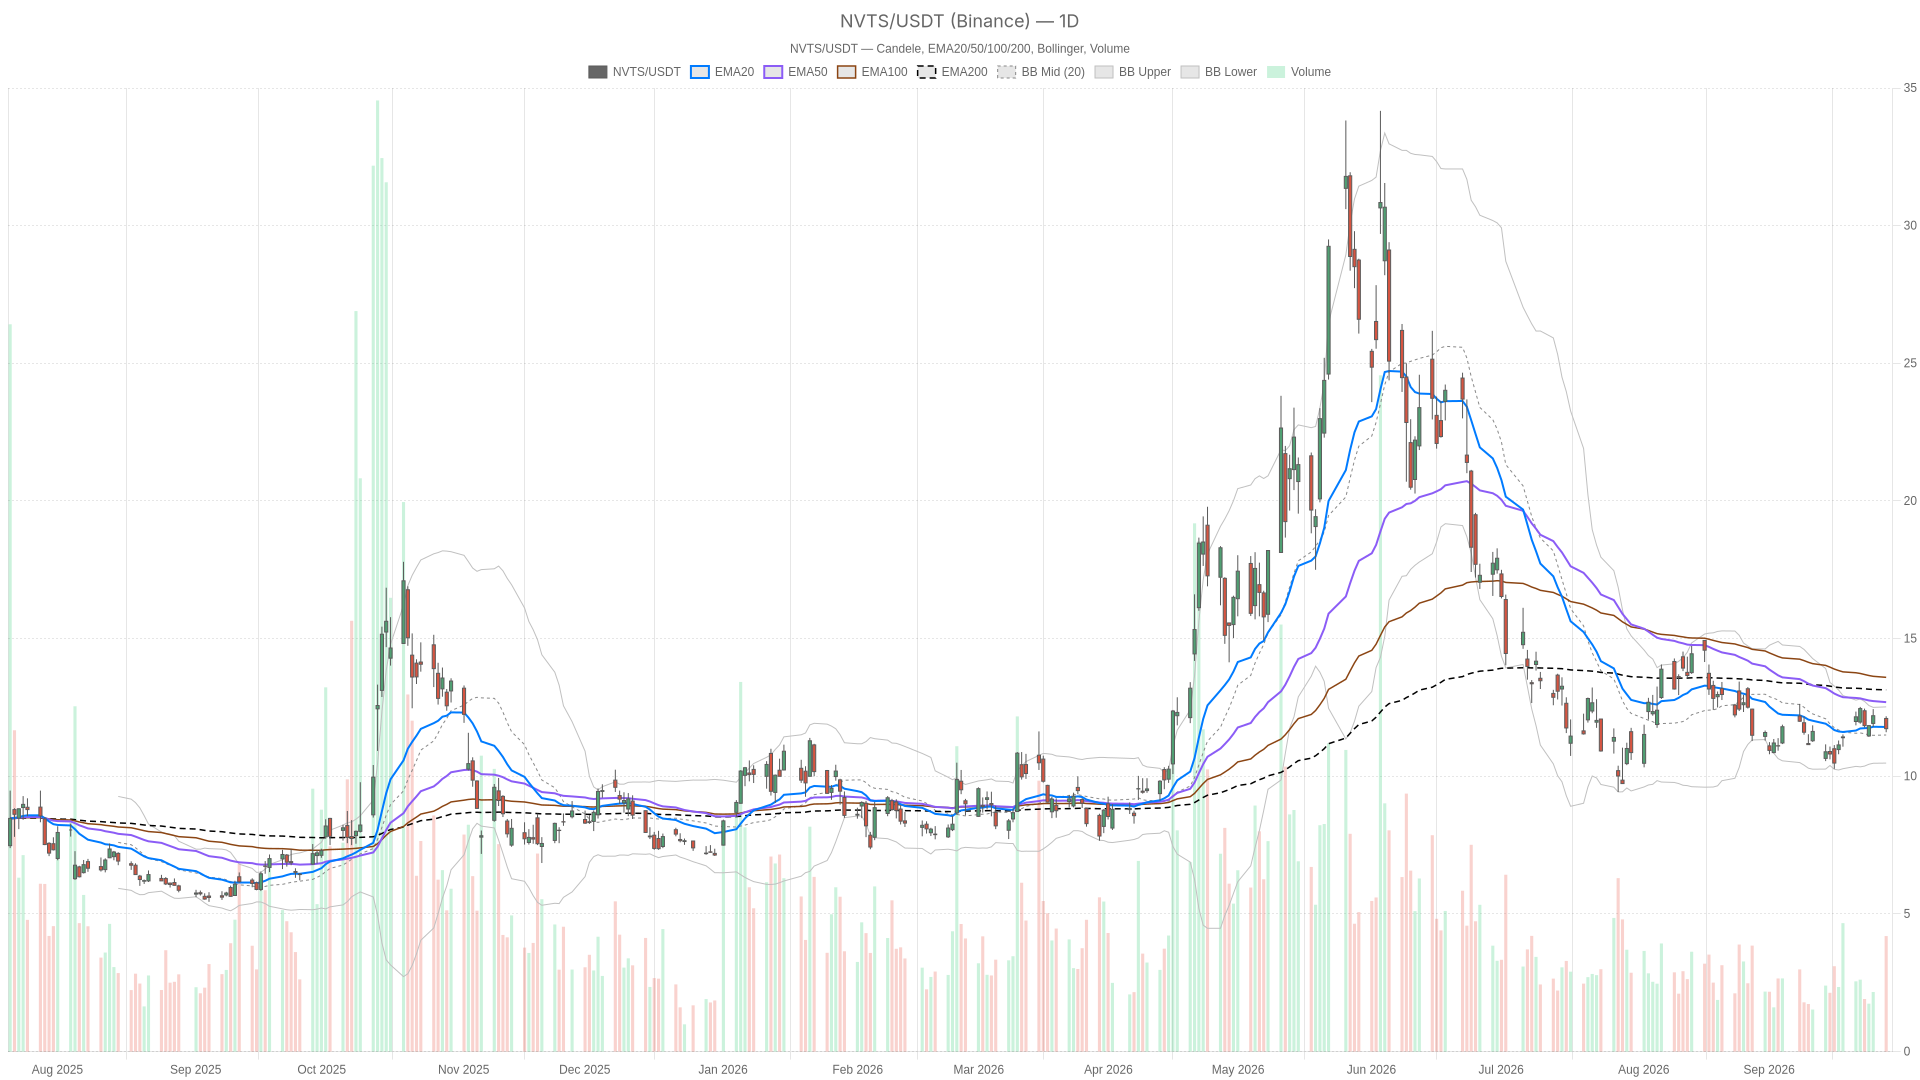 NVTS — daily chart with candlesticks, EMA20/EMA50 and volume.
Key takeaways
Navitas Semiconductor Corporation stock closed at $11.73 on Monday, down 3.85%, before surging roughly 20% after-hours on the Army contract announcement.
The daily chart remains in a textbook downtrend with price below the EMA20 ($11.79), EMA50 ($12.69), and EMA200 ($13.14) — all stacked in descending order.
The U.S. Army selected Navitas under the ALATTIS award to develop 10 kV silicon carbide devices for mission-critical defense systems.
ATR14 at $0.67 confirms elevated volatility, meaning daily swings of this magnitude are common rather than exceptional.
Confirmation via a daily close above the EMA50 or a breakdown below S1 ($11.49) will offer more clarity than reacting to the after-hours move alone.
Daily Chart: Is Navitas Semiconductor Stock Still Under Technical Pressure?
Yes, Navitas Semiconductor stock remains under clear technical pressure. The daily chart displays a textbook downtrend with price below all three major moving averages — a signature of sustained seller control over multiple weeks.
Price closed at $11.73, sitting below the EMA20 at $11.79. It remains well under the EMA50 at $12.69 and further still from the EMA200 at $13.14. That stacking leaves little doubt about the multi-week bias. Sellers have controlled the tape on a multi-week basis, not just a single bad session.
However, momentum indicators offer a more nuanced picture. RSI14 at 48.23 sits near neutral. The stock isn’t technically oversold despite the drawdown, leaving room for further downside. Meanwhile, MACD shows bearish momentum losing steam. The line at -0.16 against a signal of -0.31 produces a positive histogram of 0.15. This is an early divergence signal, not a reversal confirmation.
On the volatility front, Bollinger Bands place the lower band at $10.48. With price at $11.73, NVTS trades closer to the lower half of the range. ATR14 at $0.67 confirms this remains a genuinely volatile name — daily swings of that magnitude are common. Pivot analysis reinforces the bearish tilt: the daily pivot point at $11.84 sits above Monday’s close, with support at $11.49 (S1). Price closing below the pivot keeps sellers in control on this timeframe.
Hourly Timeframe: Has the Trend Shifted?
No, the hourly chart has not confirmed a trend shift. It shows stabilization and compression rather than a clean reversal, with a mixed moving average alignment that suggests short-term consolidation.
Price at $11.75 sits below the EMA20 ($11.93) but above the EMA50 ($11.83) and the EMA200 ($11.77). This mixed alignment reflects indecision rather than a directional push. RSI14 at 44.62 remains unremarkable and far from any extreme. MACD is essentially flat, with the line at -0.01 versus a signal of 0.04, producing a marginal negative histogram of -0.05 — too small to draw strong conclusions.
Meanwhile, the hourly pivot at $11.75 matches the close almost exactly. Resistance sits at $11.82 and support at $11.67 — a tight range reflecting a market in wait-and-see mode. Overall, the 1H timeframe neither confirms nor rejects the daily downtrend. It simply shows compression before the catalyst hit.
15-Minute Context: What Did the Market Look Like Before the Catalyst?
The 15-minute chart shows a market coiling rather than trending ahead of the Army contract announcement. This compression explains why the after-hours reaction was so sharp by comparison.
The close at $11.75 sat almost on top of the 15m pivot of $11.73. The EMA20, EMA50, and EMA200 clustered tightly between $11.80 and $11.90. RSI14 at 41.77 and a flat MACD histogram both point to indecision heading into the session’s final minutes. This is purely execution context — the stock was quiet and rangebound right before the headline dropped.
Bullish Scenario: What Would Confirm a Sustainable Rally in Navitas Semiconductor Stock?
For Navitas Semiconductor stock to confirm a sustainable rally, bulls need the after-hours gains to hold and translate into a daily close above key resistance levels — starting with the EMA50 at $12.69.
The bullish case rests on the U.S. Army-backed silicon carbide program being treated as a structural catalyst rather than a headline trade. If NVTS can hold above the daily pivot at $11.84 and push through R1 at $12.07, the next real test becomes the EMA50 at $12.69. A daily close above the EMA200 at $13.14 would be the strongest technical confirmation. Supporting evidence would include the MACD histogram turning positive on the daily chart, RSI14 pushing convincingly above 50, and volume expanding beyond Monday’s 19.18 million shares on the up move rather than fading on profit-taking.
Bearish Scenario: What Would Invalidate the Breakout?
The breakout fails if the daily downtrend reasserts itself once the initial news reaction cools. Specifically, a failure to hold above the daily pivot at $11.84 would reopen the path toward the lower Bollinger Band at $10.48.
If NVTS rolls back under S1 at $11.49, the path lower stays open. A rejection at or below the EMA20 ($11.79) on the daily chart would invalidate the bullish thesis. Combined with RSI14 sliding back under 45, this would suggest the after-hours move was absorbed rather than sustained. Notably, given the ATR14 of $0.67, a retracement of that scale would not be unusual — even within a broader recovery attempt. Confirmation matters more than the initial spike itself.
Closing Take
Navitas Semiconductor stock sits at a genuine inflection point where technical structure and fundamental news pull in opposite directions. Patience is warranted: waiting for a daily close that reclaims the EMA50 or confirms a breakdown below S1 will offer far more clarity than reacting to the after-hours move alone.
The daily trend remains bearish by every major measure. However, the hourly chart shows a market that had already stalled before the Army contract news arrived. That stall could resolve upward as easily as it fades back into the prior range. Given elevated ATR readings across timeframes and the binary nature of a contract-driven headline, volatility is likely to stay elevated. Positioning around this name currently demands discipline rather than haste.
FAQ
What caused Navitas Semiconductor stock to surge after-hours on Monday?
Navitas was selected for a U.S. Army-backed program under the ALATTIS award to develop next-generation 10 kV silicon carbide devices for mission-critical defense systems. The news triggered a roughly 20% after-hours surge.
Is the daily trend still bearish despite the after-hours rally?
Yes. The daily chart shows price below all three major moving averages — EMA20 at $11.79, EMA50 at $12.69, and EMA200 at $13.14 — with the averages stacked in descending order. This is a textbook downtrend signature that the after-hours move has not yet altered.
What key levels should traders watch for confirmation?
On the bullish side, watch for a daily close above the EMA50 at $12.69 and ideally the EMA200 at $13.14. On the bearish side, a breakdown below S1 at $11.49 would reopen the path toward the lower Bollinger Band at $10.48.
Disclaimer: This article is for informational purposes only and does not constitute financial advice, an investment recommendation, or a solicitation to buy or sell any financial instrument or cryptocurrency. The analysis provided is not indicative of future results. Investing in crypto assets and financial markets carries a high risk of capital loss. Always do your own research (DYOR) and consult a qualified financial advisor before making any decision.
Article produced with the assistance of artificial intelligence and reviewed by the editorial team.