13.12.2025,
4874 Zeichen
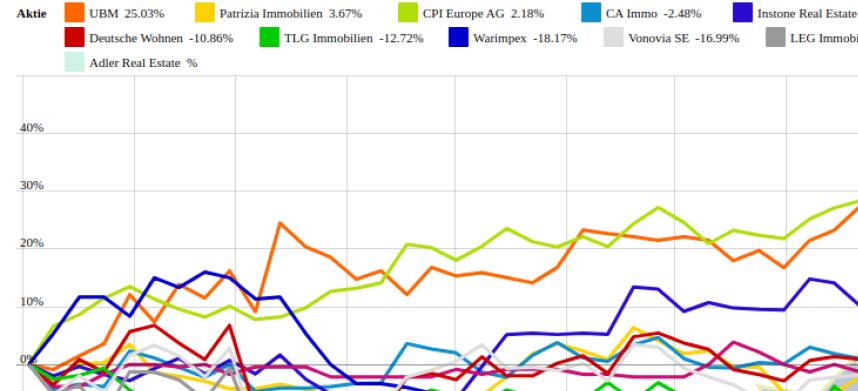
In der Wochensicht ist vorne:
Patrizia Immobilien 9,6% vor
CPI Europe AG 0,8%,
Adler Real Estate 0,68%,
Instone Real Estate 0,5%,
Athos Immobilien 0%,
S Immo -0,45%,
TLG Immobilien -0,72%,
Warimpex -1,8%,
Gagfah -2,94%,
Deutsche Wohnen -3,1%,
CA Immo -4,62%,
Vonovia SE -4,91%,
LEG Immobilien -5,15% und
UBM -7,02%.
In der Monatssicht ist vorne:
Patrizia Immobilien 12,76% vor
Adler Real Estate 2,79%
,
Instone Real Estate 2,29%
,
S Immo 0,91%
,
Athos Immobilien -1,37%
,
Gagfah -1,91%
,
TLG Immobilien -4,2%
,
Deutsche Wohnen -4,24%
,
CA Immo -5,02%
,
LEG Immobilien -5,66%
,
UBM -5,78%
,
Vonovia SE -5,95%
,
Warimpex -6,65%
und
CPI Europe AG -6,94%
.
Weitere Highlights: LEG Immobilien ist nun 5 Tage im Minus (5,15% Verlust von 64,1 auf 60,8).
Year-to-date lag per letztem Schlusskurs
UBM 31,68% (Vorjahr: -23,7 Prozent) im Plus. Dahinter
Patrizia Immobilien 4,05% (Vorjahr: -3,66 Prozent) und
CPI Europe AG 1,61% (Vorjahr: -29,12 Prozent).
LEG Immobilien -25,67% (Vorjahr: 3,13 Prozent) im Minus. Dahinter
Vonovia SE -17,46% (Vorjahr: 2,73 Prozent) und
Warimpex -14,16% (Vorjahr: -23,22 Prozent).
Am weitesten über dem MA200:
Patrizia Immobilien 8,2% und
UBM 0,73%,
Am deutlichsten unter dem MA 200:
S Immo -100%,
Adler Real Estate -100% und
Gagfah -100%.
Hier der aktuelle ausserbörsliche Blick.
Vergleicht man die
aktuellen Indikationen bei L&S mit dem letzten Schlusskurs, so lag um 8:32 Uhr die
TLG Immobilien-Aktie am besten: 53,28% Plus. Dahinter
S Immo mit +1,58% ,
CA Immo mit +1,06% ,
Adler Real Estate mit +0,68% ,
UBM mit +0,24% ,
CPI Europe AG mit +0,23% ,
Deutsche Wohnen mit +0,12% und
LEG Immobilien mit +0,08%
Vonovia SE mit -0,17% ,
Patrizia Immobilien mit -0,3% ,
Athos Immobilien mit -0,93% ,
Instone Real Estate mit -0,93% und
Warimpex mit -5,91% .
Die Durchschnittsperformance ytd der BSN-Group Immobilien ist -4,53% und reiht sich damit auf Platz 24 ein:
1. Stahl: 99,42%
Show latest Report (06.12.2025)
2. Bau & Baustoffe: 78,6%
Show latest Report (13.12.2025)
3. PCB (Printed Circuit Board Producer & Clients): 62,2%
Show latest Report (06.12.2025)
4. Banken: 51,85%
Show latest Report (13.12.2025)
5. Zykliker Österreich: 39,98%
Show latest Report (06.12.2025)
6. Telekom: 38,25%
Show latest Report (06.12.2025)
7. Deutsche Nebenwerte: 34,81%
Show latest Report (13.12.2025)
8. Versicherer: 32,15%
Show latest Report (06.12.2025)
9. Energie: 25,78%
Show latest Report (13.12.2025)
10. Licht und Beleuchtung: 24,96%
Show latest Report (06.12.2025)
11. Global Innovation 1000: 24,66%
Show latest Report (13.12.2025)
12. Luftfahrt & Reise: 20,66%
Show latest Report (06.12.2025)
13. IT, Elektronik, 3D: 19,28%
Show latest Report (06.12.2025)
14. Pharma, Chemie, Biotech, Arznei & Gesundheit: 17,93%
Show latest Report (06.12.2025)
15. Auto, Motor und Zulieferer: 17,24%
Show latest Report (13.12.2025)
16. MSCI World Biggest 10: 14,22%
Show latest Report (06.12.2025)
17. Rohstoffaktien: 10,48%
Show latest Report (06.12.2025)
18. Computer, Software & Internet : 7,77%
Show latest Report (13.12.2025)
19. Post: 4,16%
Show latest Report (06.12.2025)
20. Ölindustrie: 3,65%
Show latest Report (06.12.2025)
21. Aluminium: -0,42%
22. Runplugged Running Stocks: -1,85%
23. Sport: -3,9%
Show latest Report (06.12.2025)
24. Immobilien: -4,53%
Show latest Report (06.12.2025)
25. Konsumgüter: -5,12%
Show latest Report (06.12.2025)
26. Gaming: -12,33%
Show latest Report (13.12.2025)
Aktuelles zu den Companies (168h)
BSN Podcasts
Christian Drastil: Wiener Börse Plausch

kapitalmarkt-stimme.at daily voice: Im Jahr 2007 (bei den letzten ATX-Rekorden) hatte sich die Politik noch gezeigt. Und 2025?