Never miss an important update on your stock portfolio and cut through the noise. Over 7 million investors trust Simply Wall St to stay informed where it matters for FREE.
If you are wondering whether Vestas Wind Systems at around kr190.10 still offers value after a strong run, this article walks through what the current price might be implying.
The share price has moved by 6.1% over the last week, 11.4% over the last month and 6.4% year to date, with a 103.6% return over the past year but weaker 3 year and 5 year returns of a 3.8% decline and a 28.7% decline.
Recent attention on Vestas Wind Systems has centered on its position in global wind power and how market sentiment toward renewable energy stocks has shifted. This helps explain the strong 1 year performance. At the same time, the softer 3 year and 5 year returns keep questions about long term pricing and risk firmly on the table for investors.
On our checks, Vestas Wind Systems has a valuation score of 2 out of 6. We will look at what different valuation methods say about that score and then finish with a broader way to think about what the market might be pricing in.
Vestas Wind Systems scores just 2/6 on our valuation checks. See what other red flags we found in the full valuation breakdown.
A Discounted Cash Flow, or DCF, model takes estimates of a company’s future cash flows and discounts them back to today to get an implied value per share. It is essentially asking what those future euros are worth in today’s terms.
For Vestas Wind Systems, the model used is a 2 Stage Free Cash Flow to Equity approach based on cash flow projections. The latest twelve month free cash flow is about €1.97b. Analyst inputs extend to 2030, with forecast free cash flow of €1.43b in that year, and further figures beyond that are extrapolated by Simply Wall St rather than coming directly from analysts.
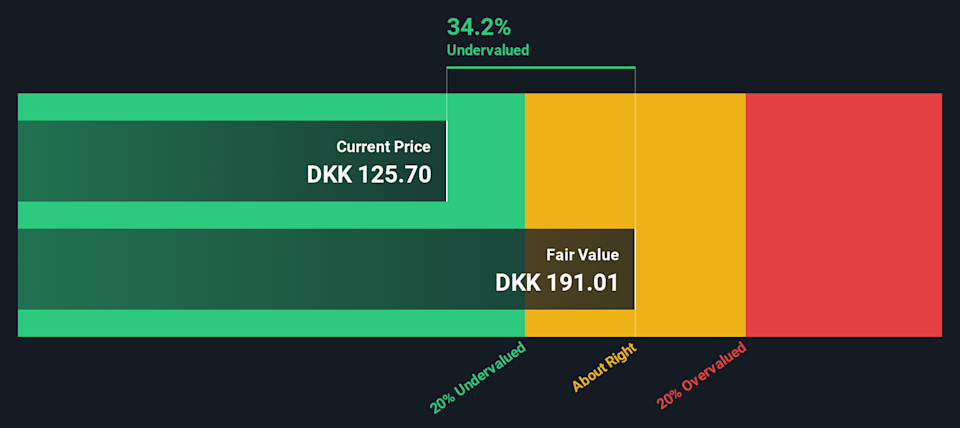
Pulling all those projected cash flows together, the DCF model arrives at an estimated intrinsic value of €178.20 per share. Compared with a current share price of around kr190.10, this implies the stock is roughly 6.7% overvalued on this set of assumptions, which is a relatively small gap.
Result: ABOUT RIGHT
Vestas Wind Systems is fairly valued according to our Discounted Cash Flow (DCF), but this can change at a moment’s notice. Track the value in your watchlist or portfolio and be alerted on when to act.
 VWS Discounted Cash Flow as at Jan 2026
Story Continues
For profitable companies, the P/E ratio is a useful way to think about value because it links what you pay for each share directly to the earnings that business is currently generating.
A higher or lower P/E often reflects what the market expects for future growth and how risky those earnings are. Strong growth with relatively predictable earnings can justify a higher “normal” P/E, while more uncertainty or weaker growth usually points to a lower one.
Vestas Wind Systems currently trades on a P/E of about 26.92x. That is below the Electrical industry average of 30.61x and also below the peer group average of 29.19x. Simply Wall St’s Fair Ratio for Vestas Wind Systems is 27.41x, which is its proprietary view of what a reasonable P/E could be given factors like earnings growth, industry, profit margin, market cap and risk.
The Fair Ratio aims to be more tailored than a simple comparison with peers or the industry, because it adjusts for Vestas Wind Systems specific characteristics rather than assuming all companies should trade on the same multiple.
With the current P/E at 26.92x and the Fair Ratio at 27.41x, the gap is small, which points to the shares being priced at about the level the model suggests.
Result: ABOUT RIGHT
 CPSE:VWS P/E Ratio as at Jan 2026
P/E ratios tell one story, but what if the real opportunity lies elsewhere? Discover 1426 companies where insiders are betting big on explosive growth.
Earlier we mentioned that there is an even better way to understand valuation, so let us introduce you to Narratives, which are simply your story about a company, tied directly to your own view of fair value and your assumptions for future revenue, earnings and margins.
A Narrative connects three pieces: what you think is happening in the business, how that translates into a financial forecast, and what you believe is a fair value per share based on those numbers.
On Simply Wall St, millions of investors share these Narratives on the Community page. Each one shows a Fair Value that you can compare with the current price to help you decide if a stock might belong on your watchlist, or if it might be time to reduce exposure instead.
These Narratives update automatically as new information comes in, such as major news or earnings releases, so your view of Vestas Wind Systems can shift as the facts change. You will often see one Narrative that expects Vestas Wind Systems to be worth far more than today’s price and another that sees fair value well below it, reflecting different expectations for future orders, profitability and risk.
Do you think there’s more to the story for Vestas Wind Systems? Head over to our Community to see what others are saying!
CPSE:VWS 1-Year Stock Price Chart
This article by Simply Wall St is general in nature. We provide commentary based on historical data and analyst forecasts only using an unbiased methodology and our articles are not intended to be financial advice. It does not constitute a recommendation to buy or sell any stock, and does not take account of your objectives, or your financial situation. We aim to bring you long-term focused analysis driven by fundamental data. Note that our analysis may not factor in the latest price-sensitive company announcements or qualitative material. Simply Wall St has no position in any stocks mentioned.
Companies discussed in this article include VWS.CO.
Have feedback on this article? Concerned about the content? Get in touch with us directly. Alternatively, email editorial-team@simplywallst.com