
If you are wondering whether A.P. Møller – Mærsk is still fairly priced after a strong run, this article will walk you through how its current market value stacks up against several valuation checks. The stock last closed at DKK 15,385, and while the 7 day and 30 day returns both show a 1.6% decline, the shares sit on a 4.7% year to date return and 46.2% over the past year, with a 130.3% return over five years suggesting the market has reassessed the company over time. Recent news around A.P. Møller – Mærsk has focused on its role in global container shipping and logistics, as investors watch how trade flows and freight markets influence sentiment on the stock. These updates help frame whether the recent price performance reflects shifting expectations about future demand or simply a re rating after past moves. On our checks, A.P. Møller – Mærsk currently has a valuation score of 2 out of 6, which means it screens as undervalued on only a couple of key metrics, so next we will compare different valuation approaches and then finish with a way to look beyond the numbers to understand the valuation story in full.
A.P. Møller – Mærsk scores just 2/6 on our valuation checks. See what other red flags we found in the full valuation breakdown.
Approach 1: A.P. Møller Mærsk Discounted Cash Flow (DCF) Analysis
A Discounted Cash Flow, or DCF, model takes estimates of a company’s future cash flows and discounts them back to today, giving you a single figure for what the business might be worth based on those projected cash streams.
For A.P. Møller Mærsk, the model used is a 2 Stage Free Cash Flow to Equity approach, based on cash flows in US$. The latest twelve month free cash flow sits at about US$7.4b. Analyst inputs cover the earlier forecast years, and Simply Wall St then extends those estimates further out. Within the ten year projections, free cash flow is modeled at US$1,187m in 2029, with subsequent years extrapolated using gradually moderating growth assumptions.
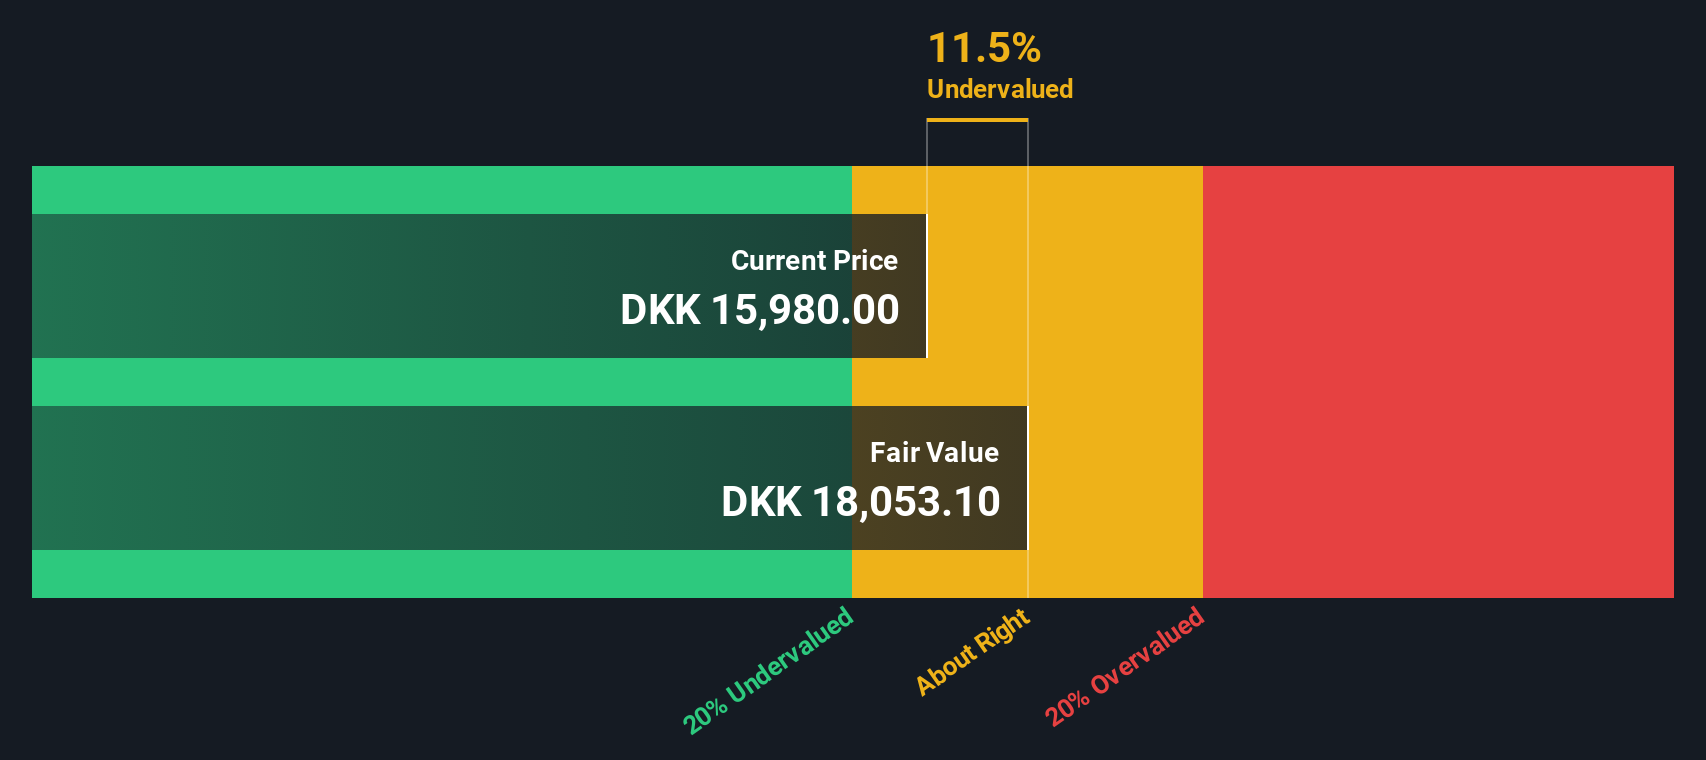
When these projected cash flows are discounted back and combined with a terminal value, the DCF points to an estimated intrinsic value of about DKK 14,400 per share. Against the recent share price of DKK 15,385, this implies the stock screens as around 6.8% overvalued on this model.
Result: ABOUT RIGHT
A.P. Møller – Mærsk is fairly valued according to our Discounted Cash Flow (DCF), but this can change at a moment’s notice. Track the value in your watchlist or portfolio and be alerted on when to act.
 MAERSK B Discounted Cash Flow as at Feb 2026
Approach 2: A.P. Møller – Mærsk Price vs Earnings
For a profitable company, the P/E ratio is a familiar way to think about value because it links what you pay directly to the earnings the business is generating today. Investors usually accept a higher P/E if they expect stronger growth or see lower risk, and a lower P/E if they see weaker growth or higher risk, so there is no single “right” number.
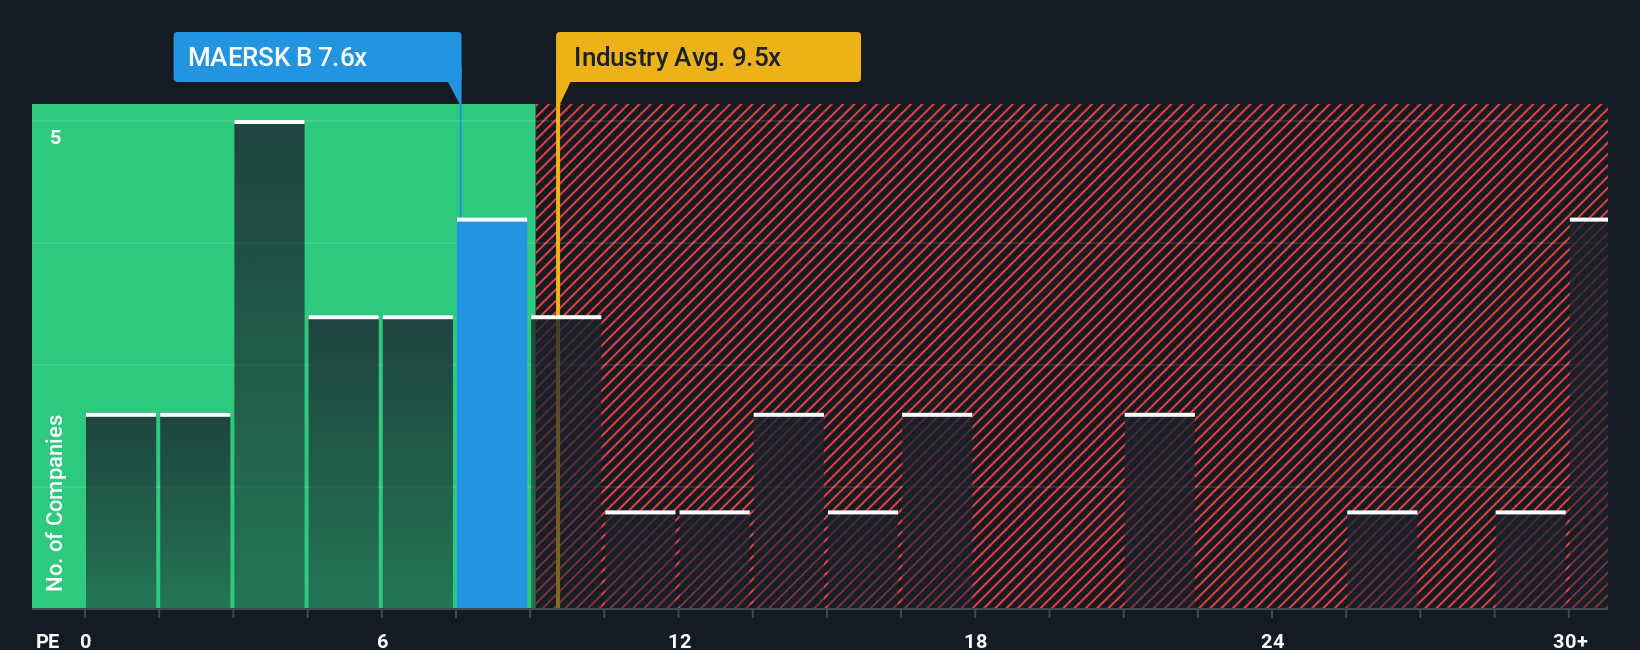
A.P. Møller – Mærsk is currently trading on a P/E of 7.27x. That sits below the Shipping industry average of 10.07x and also below the broader peer average of 22.16x. On the surface, that can suggest the shares are priced more cautiously than many peers.
Simply Wall St’s Fair Ratio tries to refine this picture by estimating what a more tailored P/E might look like, given factors such as earnings growth, profit margins, market cap, industry and company specific risks. Because it adjusts for these variables, the Fair Ratio of 5.23x is intended to be more informative than a simple comparison against industry or peer averages alone. With the actual P/E at 7.27x versus this Fair Ratio, the shares screen as somewhat expensive on this metric.
Result: OVERVALUED
 CPSE:MAERSK B P/E Ratio as at Feb 2026
P/E ratios tell one story, but what if the real opportunity lies elsewhere? Start investing in legacies, not executives. Discover our 103 top founder-led companies.
Upgrade Your Decision Making: Choose your A.P. Møller Mærsk Narrative
Earlier we mentioned that there is an even better way to understand valuation, so let us introduce you to Narratives, which let you attach a clear story about A.P. Møller Mærsk to the numbers you care about, such as fair value estimates and assumptions for future revenue, earnings and margins.
A Narrative connects three things: your view of the business, the forecast that view implies, and the fair value that drops out of those assumptions, so you can see how your story translates into a price you are comfortable with.
On Simply Wall St, Narratives sit inside the Community page, where millions of investors share and refine these story plus forecast combinations, and you can compare your own view to others in a simple, accessible format.
Each Narrative calculates a Fair Value and sets it against the current share price to help you decide whether the stock looks attractive or stretched on your assumptions, and it updates automatically as new earnings releases or news are reflected in the underlying data.
For A.P. Møller Mærsk, one investor might build a Narrative that assumes resilient container demand and sees a higher fair value estimate, while another might focus on freight rate pressure and arrive at a much lower figure, and putting these side by side helps you see where you stand.
Do you think there’s more to the story for A.P. Møller – Mærsk? Head over to our Community to see what others are saying!
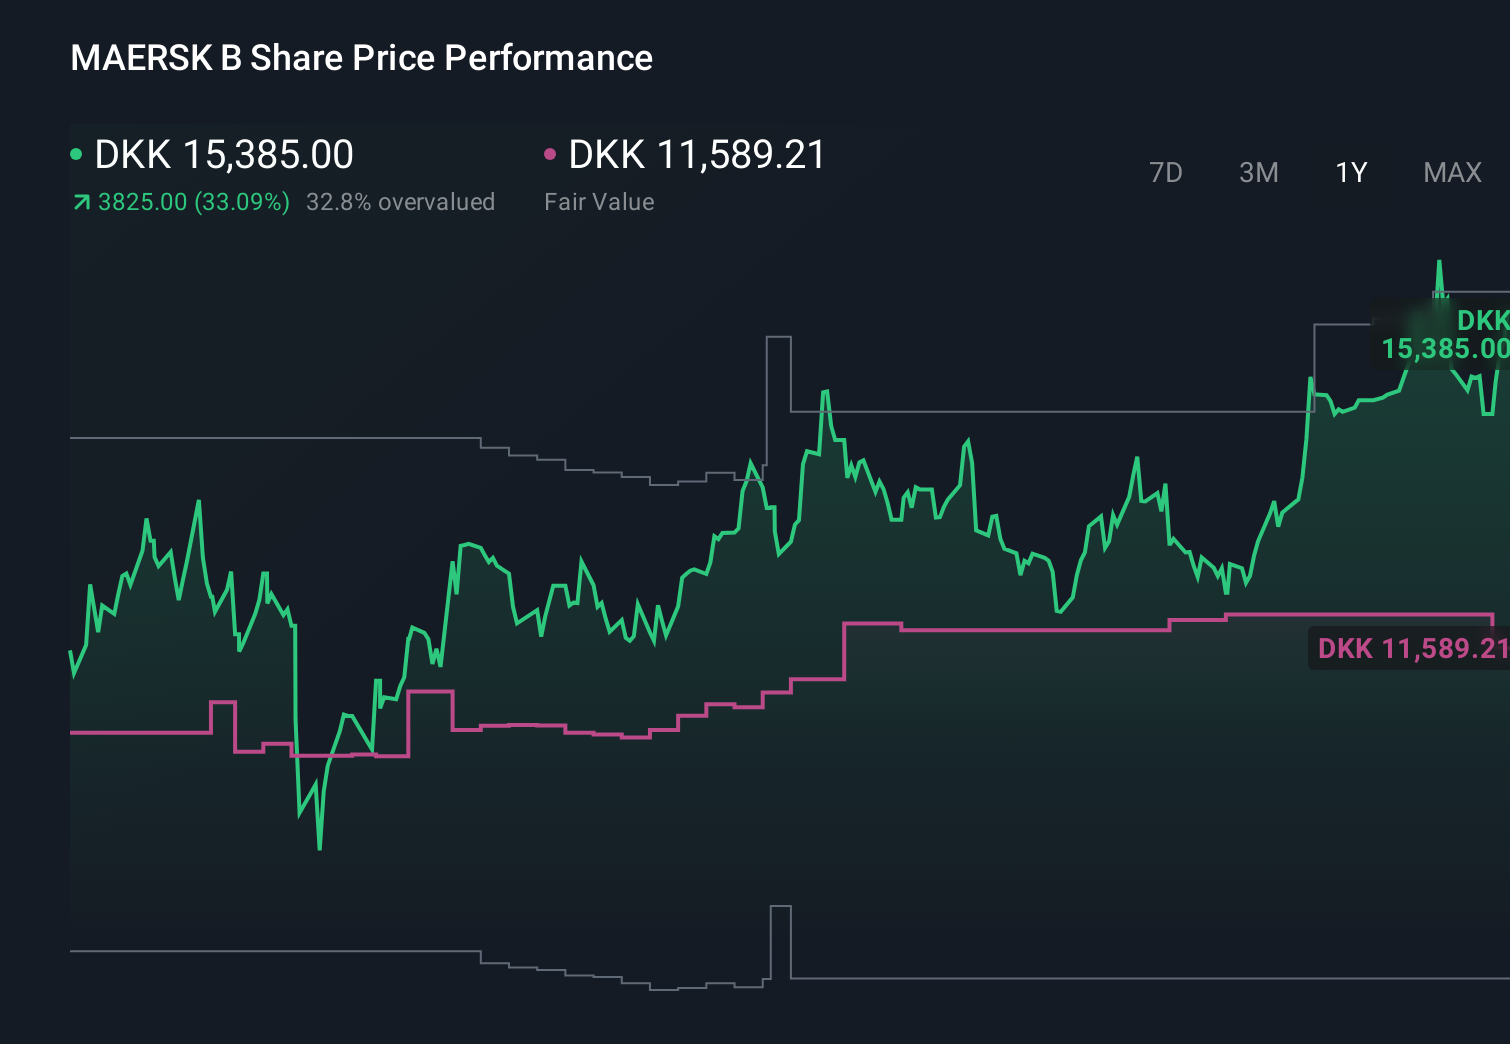 CPSE:MAERSK B 1-Year Stock Price Chart
This article by Simply Wall St is general in nature. We provide commentary based on historical data
and analyst forecasts only using an unbiased methodology and our articles are not intended to be financial advice. It does not constitute a recommendation to buy or sell any stock, and does not take account of your objectives, or your
financial situation. We aim to bring you long-term focused analysis driven by fundamental data.
Note that our analysis may not factor in the latest price-sensitive company announcements or qualitative material.
Simply Wall St has no position in any stocks mentioned.
New: Manage All Your Stock Portfolios in One Place
We’ve created the ultimate portfolio companion for stock investors, and it’s free.
• Connect an unlimited number of Portfolios and see your total in one currency
• Be alerted to new Warning Signs or Risks via email or mobile
• Track the Fair Value of your stocks
Have feedback on this article? Concerned about the content? Get in touch with us directly. Alternatively, email editorial-team@simplywallst.com