
The scale of the Digital Twin Germany project raises a critical operational question: how can the vast volumes of spatial data be processed efficiently, without compromising quality? This article examines how AI-powered Lidar point cloud classification is answering that challenge. The use of AI models that are extended with project-specific object classes has significantly reduced manual processing time while maintaining high classification accuracy. The case offers a compelling look at how intelligent automation is enabling faster and more consistent results, and what that could mean for the future of large-scale geospatial infrastructure programmes.
The Digital Twin Germany (DigiZ-DE) initiative, led by the Federal Agency for Cartography and Geodesy (BKG), integrates geospatial, environmental and infrastructure data into a unified 3D model of the entire country. This strategic platform is designed to support urban planning, crisis management and long-term sustainability objectives. It began as a pilot project focused on an aerial survey of the Hamburg metropolitan region. Following its success, a full national aerial survey was initiated, running from 2024 to 2026.
Within the Digital Twin Germany programme, which is covering a total survey area of 356,794km², Flycom Technologies – a European provider of remote sensing and geospatial solutions – has responsibility for approximately 100,000km². This positions Flycom as one of the most significant contributors to this ambitious national geospatial mapping programme.
Central to this effort is classified Lidar data, which delivers the precise elevation and surface measurements needed to accurately represent buildings, terrain, vegetation and infrastructure at national scale. In a deliberate departure from the ‘leaf-off’ season typically favoured in national surveys, data acquisition takes place between March and November. This ‘leaf-on’ period was selected to better support analysis of vegetation and tree structure. With a minimum point density of 40pts/m2, the Lidar point density can be categorized as exceptionally high for a project of such scale. For context, typical national Lidar surveys deliver around 5pts/m² in countries such as Spain and Slovakia, and 10pts/m² in France, Portugal and Slovenia.

Covering a total area of 356,794km², the Digital Twin Germany is one of the largest coordinated Lidar campaigns in Europe. (Image courtesy: A. Von Dömming)
The Lidar classification process
Classification followed a 12-class scheme modelled on the ASPRS standard, covering categories such as ground, low, medium and high vegetation, buildings, water, bridges, low and high noise points, high-voltage power lines, and a broader category for other objects including wind turbines, solar panels, towers and pipelines. For a project of national scale, automation was not a convenience but a necessity. With its team of experienced Lidar production managers and data scientists, Flycom Technologies combined established methodologies with innovative approaches to keep the complex, multi-stage workflow running efficiently as well as accurately.
AI tools such as those provided by the company Flai prove particularly valuable where the data gets complicated. When working with new or project-specific object types such as wind turbines, the ability to generate more than 20 classification classes in a single processing run makes a tangible difference. It removes the need to cycle through the workflow repeatedly and frees up expert time for decisions that genuinely require human judgment. Therefore, the Flai AI model was applied broadly across the dataset, covering vegetation, buildings, power lines, vehicles, and a range of other object types.

National Lidar datasets are available in the Flai Open Lidar Data Hub. (Image courtesy: Flai)
The impact of AI
AI classification had a particularly clear impact on the production process in the following four areas: noise classification, power line classification, wind turbine detection and bridge boundary optimization.
Noise classification at strip level
Aerial survey data is collected in strips, and each strip can display slightly different noise patterns. Excessive noise can interfere with data matching and georeferencing. AI models are generally well suited to classifying noise in point clouds. Flai’s training dataset includes examples from RIEGL, Teledyne, Hexagon and other sensor manufacturers, which helps the model recognize a wide range of sensor-specific and environment-specific noise types. Beyond the noise classification available in the pretrained FlaiNET models, Flai developed an AI-based noise classification process operating directly at strip level, before tiling. The model identifies low and high noise points across the entire strip and separates them from valid data, improving both matching accuracy and overall data quality. Once the data is aligned and georeferenced, it continues into the standard tiling phase.
Power line classification
Power lines represented one of the main above-ground categories where AI provided clear benefits in the DigiZ-DE project. FlaiNET classifies power line infrastructure into four distinct categories: high-voltage conductors, low-voltage conductors, high-voltage towers and low-voltage towers. This level of granularity has practical value, as it allows each infrastructure type to be processed independently in subsequent workflow stages. The classification runs directly on the point cloud, requiring no vector inputs or auxiliary layers as a starting point. Vector data can still be incorporated during post-processing, but the AI output alone is sufficient for moving the work forward.This approach is particularly effective when project specifications treat high and low-voltage features differently. Because the model separates these classes from the outset, remapping steps are quick and consistent across large areas. The model also handles dense Lidar data reliably, captures thin conductor segments, and maintains clear separation between wires and towers even in complex environments such as line crossings or areas of dense vegetation.

Noise classification on a Lidar strip. Automatically detected high noise is indicated by red/purple dots, low noise by yellow, remaining data by blue. (Data courtesy: Federal Agency for Cartography and Geodesy, BKG)
Wind turbine detection
Wind turbines form a prime example of how the digital twin supports cross-domain applications, from aviation safety to spatial planning. Detecting turbines and defining their geometry is a challenging task for conventional processing methods, but AI models handle it effectively. The introduction of a dedicated AI classification category for wind turbines has proven both efficient and accurate, supporting further automation of the broader classification workflow.
Bridge classification and boundary refinement
Bridges are reliably detected by the pretrained FlaiNET model, and overall classification performance is strong. However, AI models can struggle to produce sharp boundaries between classes in flat areas, meaning the transition between a bridge and the surrounding ground can appear soft or uneven. For applications requiring clean, well-defined edges, this boundary must be refined. In order to address this, Flai developed a dedicated post-processing tool that automatically sharpens the interface between bridge and ground categories, delivering the clearly defined boundaries that downstream workflows require.
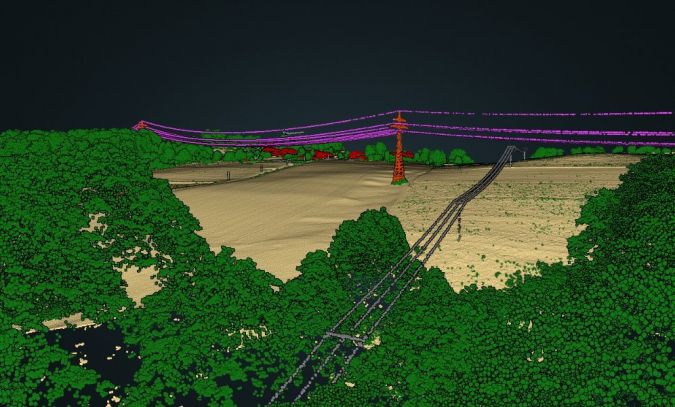
Power line classification with the pretrained FlaiNET AI model. High-voltage towers (orange), high-voltage wires (purple) and low-voltage towers and wires (grey) are classified separately. (Data courtesy: Federal Agency for Cartography and Geodesy, BKG)
Locally or in the cloud?
The question of whether to process Lidar data in the cloud or locally is one that arises on most large-scale projects. Cloud processing offers scalability, but it also introduces overheads in the form of large data transfers, increased costs and potential data protection constraints. Flai supports both approaches. The online interface is primarily used for testing, reviewing sample tiles and configuring workflows. For production runs, the Flai command-line interface integrates cleanly into existing infrastructure.
In this project, Flycom Technologies had the full dataset stored on its own systems, and the CLI tool was able to read and write directly to that storage without requiring additional data movement. When data is stored in the cloud, the same CLI tool can be deployed on providers such as AWS and run on their systems. The key advantage is flexibility: the ability to run multiple processes in parallel, whether locally or in the cloud.

AI-based classification of wind turbines. Wind turbine structures automatically identified by the AI model are shown in grey; green represents vegetation. (Data courtesy: Federal Agency for Cartography and Geodesy, BKG)
The case for AI in national mapping programmes
The DigiZ-DE project offers a practical demonstration of how AI-supported Lidar processing can be scaled across large national programmes. As the examples in this article illustrate, AI-based classification is capable of handling both the volume and the technical complexity demanded by initiatives such as the Digital Twin Germany.
Flai’s library of pretrained models covers a wide range of point cloud categories, allowing workflows to be adapted to the varying technical specifications of different national mapping agencies. It is also possible to create project-specific classes such as wind turbines, which are difficult to extract through traditional methods without extensive manual intervention.
All classes are produced within a single automated process, eliminating repeated runs and significantly reducing processing time. The AI models also demonstrate strong performance in noise classification, whether applied to individual tiles or entire strips, helping to maintain consistent data quality across the full survey area.
Because the project runs over an extended period and under varying conditions, the ability to retrain and fine-tune specific categories adds further value. This adaptability ensures that results remain accurate over time and that workflows can be efficiently reused in future national-scale mapping programmes.

An example of bridge boundary optimization, with bridge points shown in grey and ground points in yellow. Left: the initial AI output with irregular borders. Right: the optimized version with sharper, more consistent edges. (Data courtesy: USGS Lidar Point Cloud, QL1)