Figs. 3 and 4 present the estimates of bed net access and usage, highlighting the prevalence and uncertainties respectively, among women of reproductive age in Nigeria. Starting from 2003, bed net access was relatively low in places across the southwest, spreading through the southeast and northwest parts of the country. In contrast, higher prevalence of about 75% was noted in places around Kebbi, Sokoto, Jigawa, Borno, Taraba, Bayelsa, Cross River, Imo, Kogi, and Benue states. A shift occurred during 2008, as access began to rise in some southern states, although the northwest and northeast continued to exhibit higher ownership prevalence. Beginning 2010, there appears to be a north–south divide in access of bed nets among women of reproductive age, where access is higher in places along the northern fringe, although this pattern became more obvious from 2015 with about 100% coverage in Kebbi and Jigawa states in 2018. However, usage (Fig. 4) appears to be generally low throughout the country but particularly in the southern part, with most places having below 25% usage. The noted exceptions are Kebbi and Jigawa in 2018 but which was not sustained based on the estimate for 2021.
Figures 5 and 6 illustrate estimates of bed net access and use among pregnant women in Nigeria, highlighting the prevalence and associated uncertainties, respectively. In 2003, similar to patterns of bed net access among all women, access was relatively low in the southwest, extending to the southeast and northwest regions of the country. In contrast, the prevalence of access among pregnant women was notably high in states such as Kebbi, Sokoto, Jigawa, Borno, Adamawa, Bauchi, Taraba, Benue, Kogi, Cross River, Abia, Akwa Ibom, Rivers, Bayelsa, and Delta. In 2008, the trends shifted, with regions that had previously shown low access prevalence experiencing declines, while those with high access saw an increase in prevalence, highlighting growing disparities in access to bed nets. By 2010, the northeast and northwest continued to exhibit higher access prevalence, while the southwest showed persistently low prevalence, creating a clear north–south divide. This divide persisted into 2015 and became even more pronounced by 2018. Similar to Fig. 4, Fig. 6 also shows generally low usage among pregnant women throughout the country, particularly in the southern regions, where most areas reported usage rates below 25%. Notable exceptions included Kebbi and Jigawa in 2018; however, this higher usage was not sustained in Kebbi, as indicated by estimates for 2021.
Figure 7 presents estimates of bed net usage among children under five, along with the uncertainty plots. In 2003, usage was low, especially in the southwest, northcentral, and northeast regions, though states like Kebbi, Jigawa, Kogi, Cross River, and Bayelsa had relatively higher prevalence. By 2008, usage increased in states like Sokoto, Borno, Jigawa, Bauchi, and Delta, but many areas, especially in the southwest, still had low prevalence. Estimates in 2010 reveals that states such as Kebbi, Sokoto, Borno, Gombe, Bauchi, Jigawa, Niger, and Rivers showed higher bed net usage, but it remained low in the southern part of the country at this period. In 2013, southern states like Oyo, Cross River, Ebonyi, Enugu, and Imo showed modest increases in prevalence. However, between 2015 and 2018, usage in the south remained low, while Kebbi and Jigawa saw significant increases in prevalence by 2018 but this increase was only sustained in Jigawa by 2021.
Figure 8 illustrates the availability of bed nets relative to household size over time in the various geographic clusters over time, accompanied by the uncertainty plots. Overall, bed net availability remains low across the country. In 2003, higher availability was observed in Kebbi, Sokoto, and Borno. This trend continued through 2008, with Sokoto and Borno showing significant availability. By 2010, all states in the country exhibited very low bed net availability, a trend that persisted in 2021. This indicates that Nigerian households do not have enough bed nets to meet their family needs.
To further understand these dynamics, Figs. 3b and 4b present uncertainty plots for bed net access and usage among women, calculated based on the width of the confidence intervals (CIs). The colour scale ranges from blue to red, indicating the level of uncertainty: blue represents regions with narrower confidence intervals, while red indicates wider intervals. The years 2008, 2013, 2018, and 2021 reveal narrower CIs, likely due to the larger volumes of data collected during these survey years compared to others, which had wider CIs. Similarly, for children under five and nets per household member by cluster, Figs. 7b and 8b show increased certainty for the years 2008, 2013, 2018, and 2021. For pregnant women, Figs. 5b and 6b reveal greater certainty in the years 2008, 2013, and 2021.
The plots in Fig. 9 illustrate trends in bed net ownership and usage among women, pregnant women, children, and nets per household member by cluster, over time. Bed net ownership among women increased from 2003 to 2015, followed by a decline (Fig. 9a). Usage patterns followed a similar trend, increasing between 2003 and 2010 but fluctuated thereafter until 2018, and a subsequent decrease (Fig. 9b). These trends in access and usage among all women are also reflected in the findings for pregnant women (Figs. 9c and 9d). Similarly, the usage patterns among these demographics align with those of children (Fig. 9e), highlighting a broader issue of disparities in bed net access and utilization across different groups. Finally, Fig. 9f shows that the number of nets per household member by cluster increased from 2003 until 2010, after which it remained relatively stable through 2021.
Figure 10 examines the relationship between NPC and the proportion of bed nets used (NUC) among children under five across various clusters. A beta regression model was applied to predict the proportion of bed net usage based on NPC values, illustrating how changes in NPC influence usage rates. The scatter plot shows the observed data points for NPC and bed net usage, with the fitted curve representing the predicted probabilities of bed net usage.
Fig. 2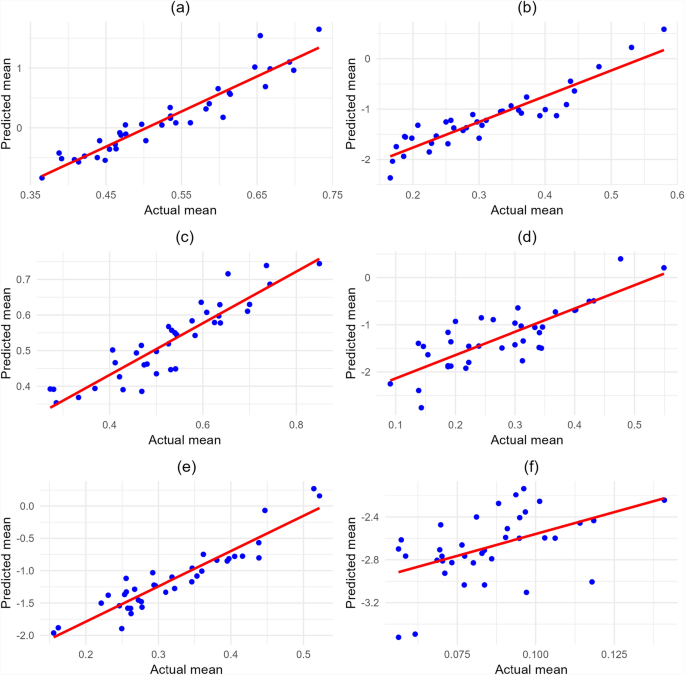
Scatter plot of actual vs. predicted mean prevalence values with a regression line, illustrating model fit, showing mean bed net access and usage across Nigeria’s 37 states for the following groups: (a, b) women, (c, d) pregnant women, (e) children under 5, and (f) nets per household member by cluster
Table 1 RMSE and Correlation values for the groups shown in Fig. 2Fig. 3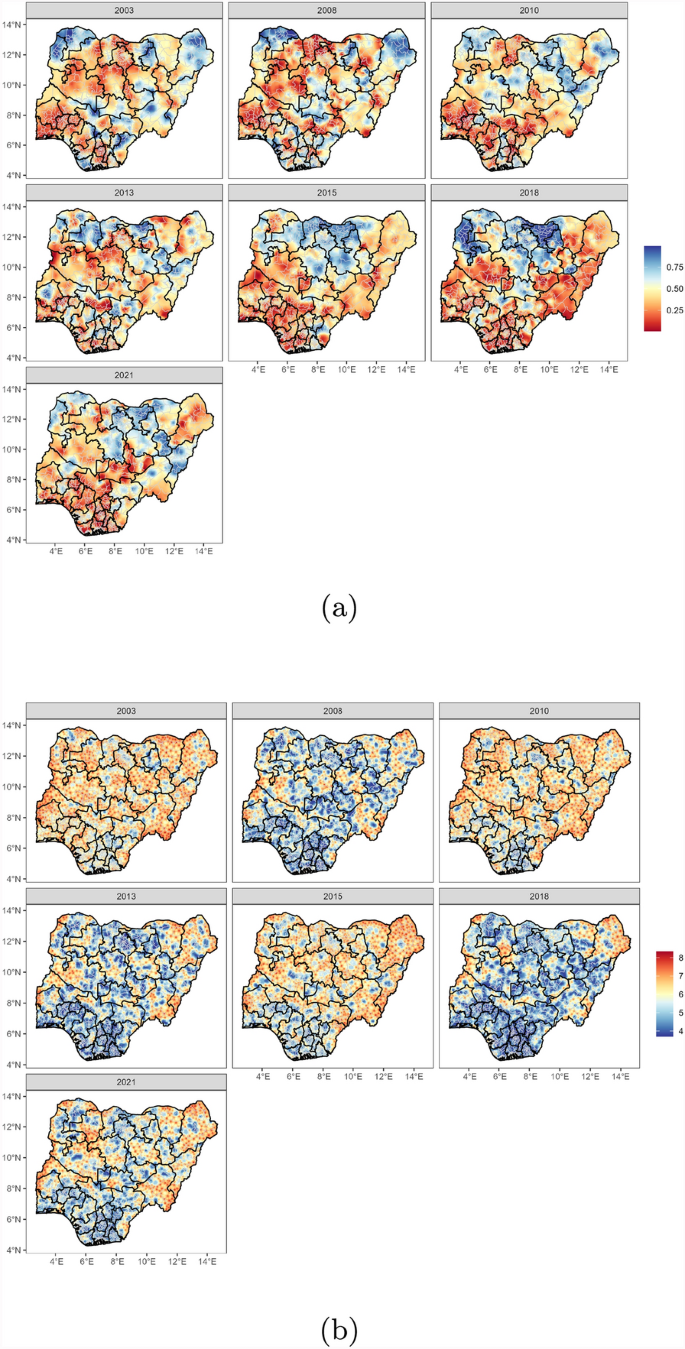
Maps of Nigeria showing the (a) spatio-temporal dynamics of access to bed nets among women of reproductive age and (b) the width of the 95% credible intervals. (Estimates are derived from model in equation 1.)
Fig. 4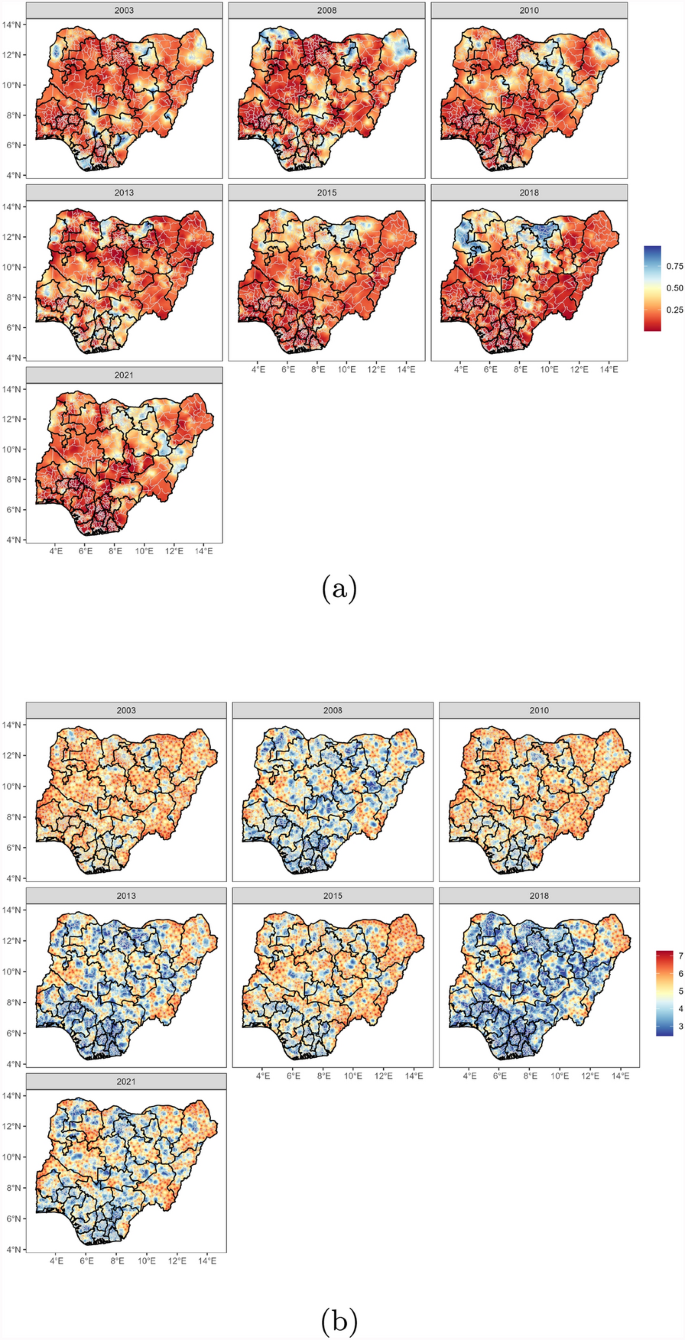
Maps of Nigeria showing the (a) spatio-temporal dynamics of usage of bed nets among women of reproductive age and (b) the width of the 95% credible intervals. (Estimates are derived from model in equation 1.)
Fig. 5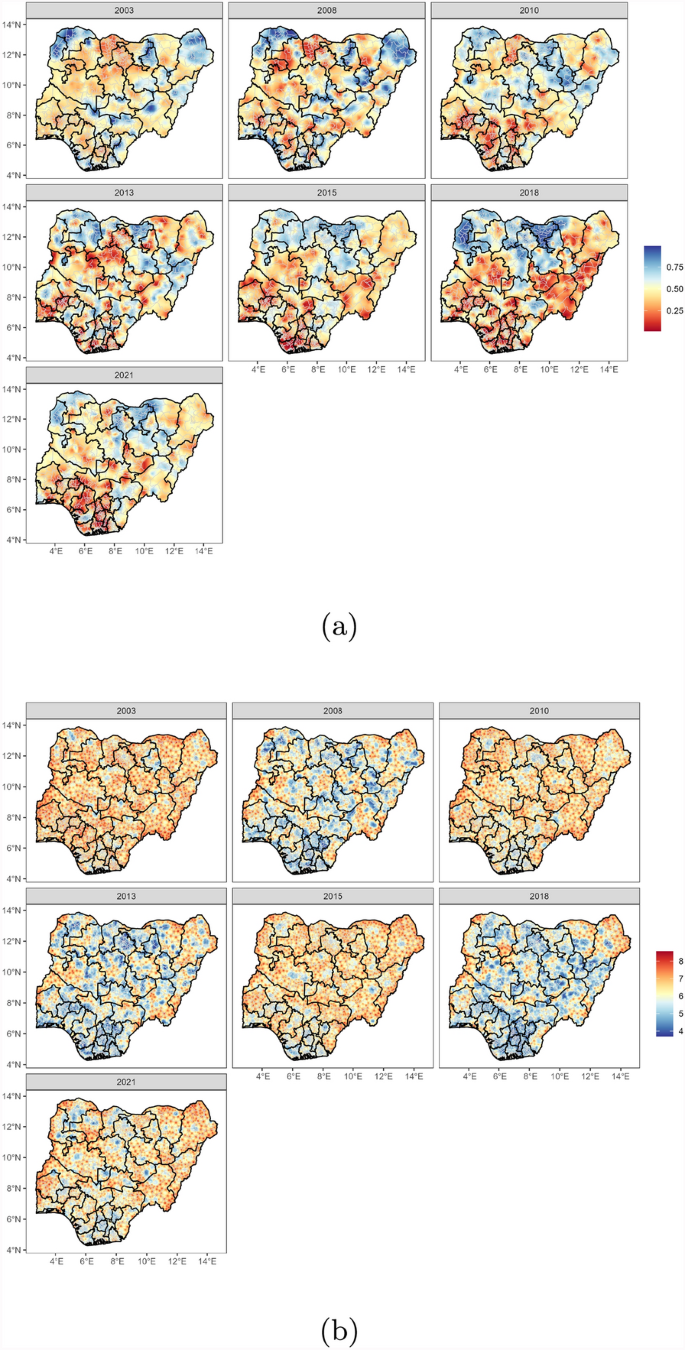
Maps of Nigeria showing the (a) spatio-temporal dynamics of access to bed nets among pregnant women and (b) the width of the 95% credible intervals. (Estimates are derived from model in equation 1.)
Fig. 6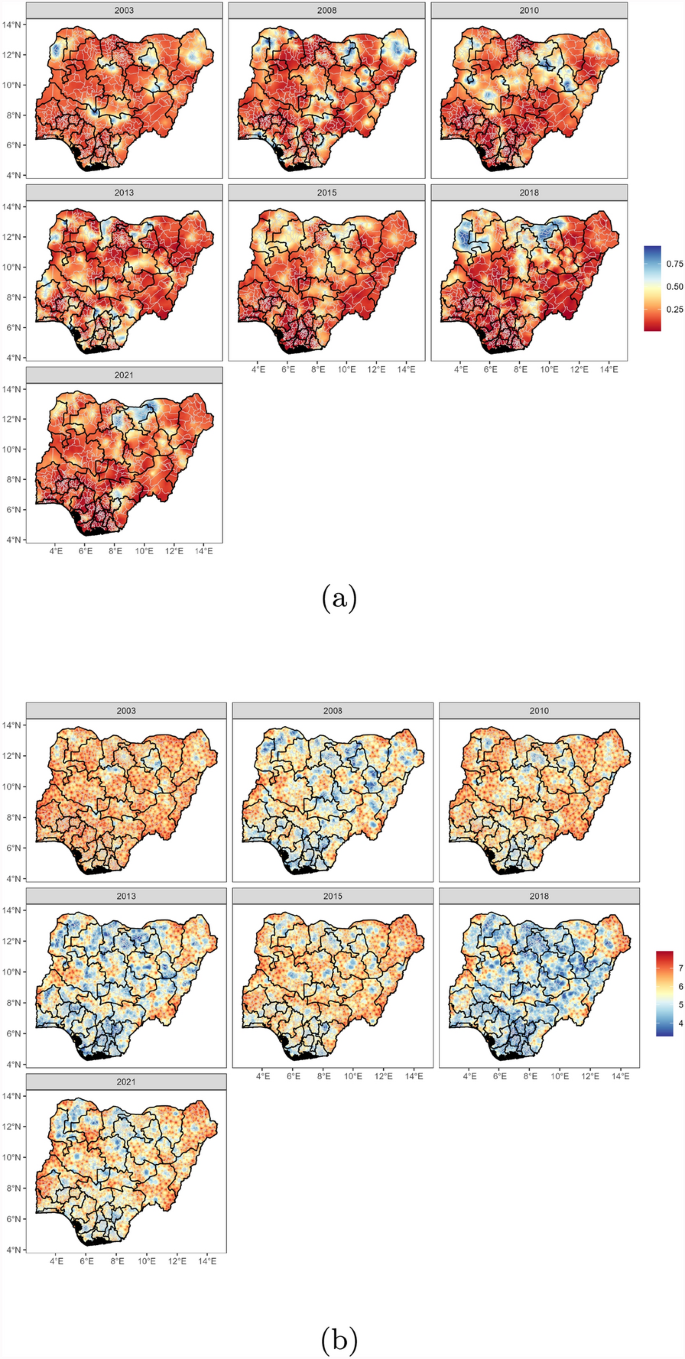
Maps of Nigeria showing the (a) spatio-temporal dynamics of usage of bed nets among pregnant and (b) the width of the 95% credible intervals. (Estimates are derived from model in equation 1.)
Fig. 7
Maps of Nigeria showing the (a) spatio-temporal dynamics of usage of bed nets among children under five years of age and (b) the width of the 95% credible intervals. (Estimates are derived from model in equation 1.)
Fig. 8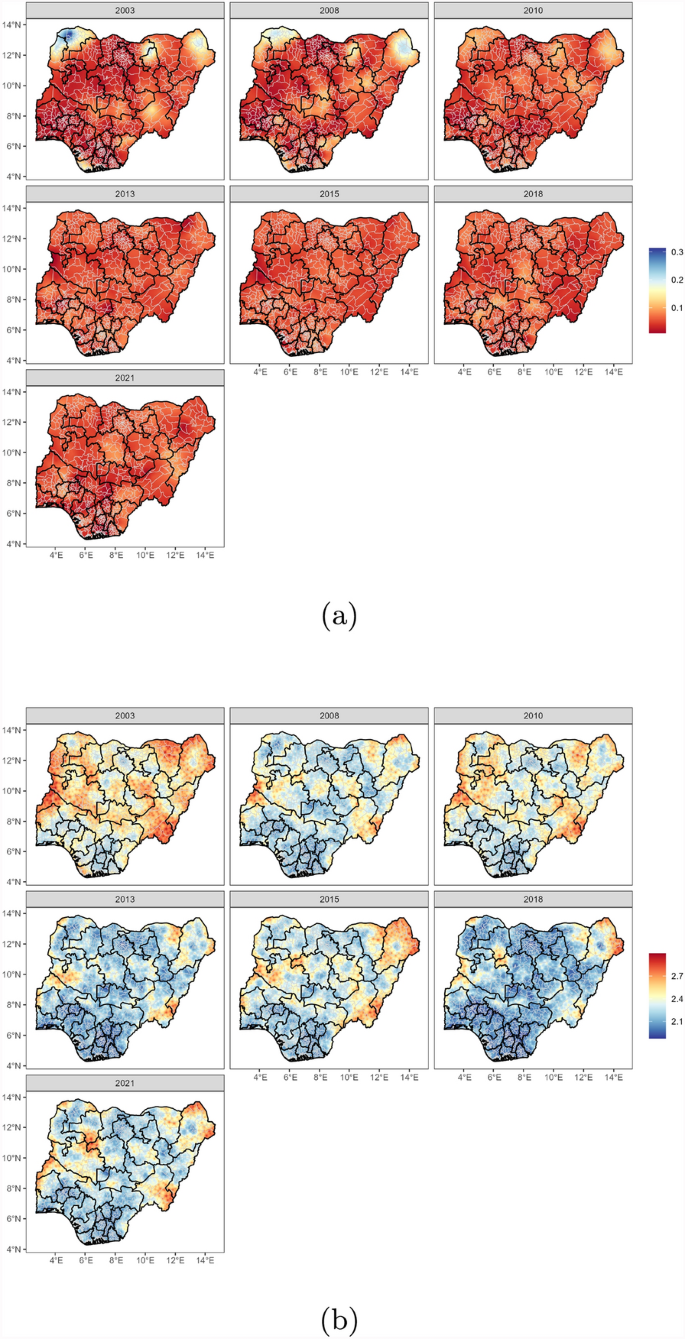
Maps of Nigeria showing the (a) spatio-temporal dynamics of nets per household member by cluster and (b) the width of the 95% credible intervals. (Estimates are derived from model in equation 1.)
Fig. 9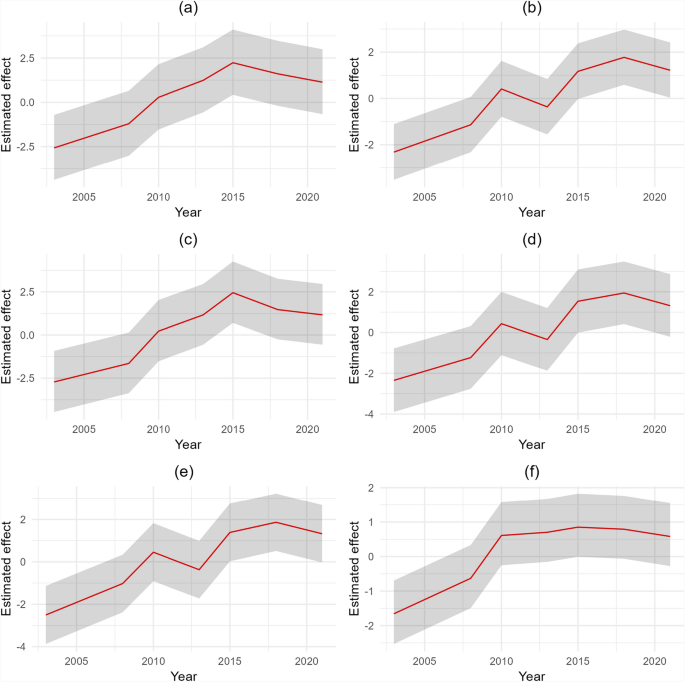
Trends in bed net access and usage for women (a, b), pregnant women (c, d), children under 5 (e), and nets per household member by cluster (f) in Nigeria
Fig. 10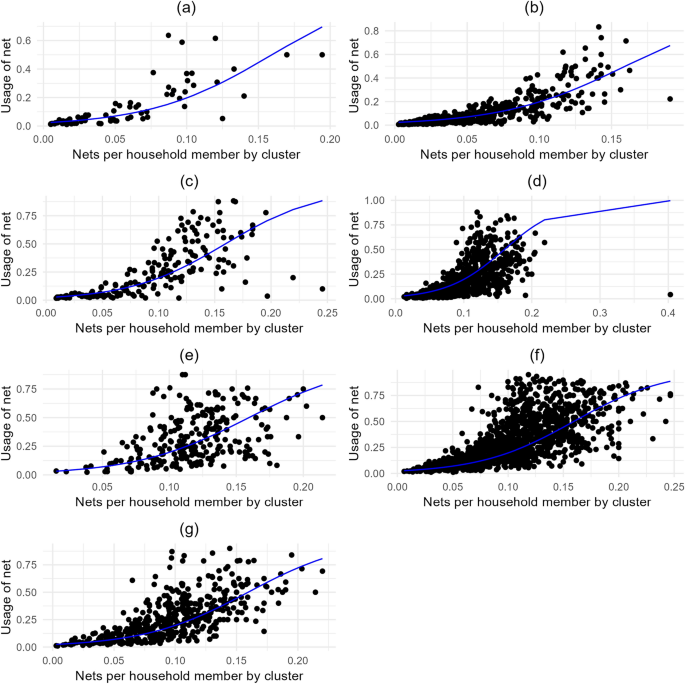
Relationship between usage and nets per household member by cluster among children under five in Nigeria for the years 2003 (a), 2008 (b), 2010 (c), 2013 (d), 2015 (e), 2018 (f), and 2021 (g)