Setting: Norwegian postpartum health care
In Norway, every resident has the right to choose a designated, regular GP, who provides continuity of care before, during and after pregnancy. Almost all women give birth in public hospitals and have an average postpartum hospital stay of 2.6 days before returning to primary care [27]. The national guideline for postpartum care recommends a home visit by a municipal midwife 1–2 days after discharge, a public health nurse visit after 7–10 days, followed by a postpartum check-up four to six weeks after birth [23]. Women with adverse pregnancy outcomes or chronic diseases are recommended to attend their GP sooner [23]. The guideline does not provide a comprehensive, structured list of topics to be covered, but recommends assessing physical and mental health, contraception, uncovering issues that need to be followed further and supporting the woman. Traditionally, the postpartum check-up takes place with the GP. In some municipalities, women can choose to have the check-up with a midwife. Consultations with GPs typically last 15–20 min, including time for documentation, whereas midwives often offer 30 min consultations. The postpartum check-up is free of charge, covered by the Norwegian universal insurance program.
Study population
All women who gave birth to one or more liveborn children in the two hospitals of Nord-Trøndelag Health Trust (HNT) from 01.07.2021–30.06.22 were eligible for inclusion. Potential study participants were identified from the patient-administrative system by ICD-10 codes Z37.0 “Single birth, living child”, Z32.2 “Twin birth, both living children”, Z37.5 “Other multiple births, all living children”. The invitation to the survey was sent using eFORSK, a web-based application maintained by Central Norway Regional Health Authority’s IT department. Of the 1,144 eligible women, 25 women were excluded due to technical issues with the distribution of the invitation. The remaining 1,119 women received an invitation letter and a link to the digital questionnaire. Women were invited two to six months after childbirth, so that they would have had time to complete their postpartum check-up and still be able to recall the experience. Approximately one month later, one reminder was sent to everyone who had received the invitation. The questionnaire was made in the online survey tool “Nettskjema”, operated by the University of Oslo. Consent for participation was given by submitting the survey. The survey was anonymous, did not collect any person-identifiable information and responses could not be traced back to the respondent. Nord-Trøndelag is representative of the Norwegian population, except a low number of immigrants and the lack of a large city [28]. Inviting all mothers who gave birth in the region allowed comparison of the respondents to the demographic characteristics of the region and country population.
Questionnaire design and variable classification
The questionnaire was in Norwegian only. An English translation is provided in the additional file (Questionnaire, Additional File 1). The questionnaire had three parts. All respondents reported demographic and background data, sources of information about the postpartum check-up, whether they attended a postpartum check-up with a GP, and reasons for non-attendance. The second part regarding pregnancy is outside the scope of this article. The third part addressed postpartum check-ups with GPs specifically, examining the importance of key topics, the content of the check-ups, and patient satisfaction.
As health-related background data, women reported whether they had chronic medical conditions, specified as high blood pressure, thyroid disease, diabetes, kidney disease, depression, anxiety, post-traumatic stress disorder, arthritis or other. Women indicated if they had been notified that they had a high-risk pregnancy. Complications during labour were specified as preeclampsia, major bleeding requiring surgery or blood transfusion, planned or emergency cesarean section, baby needed monitoring/treatment in the neonatal unit, birth before 37 weeks of pregnancy or other.
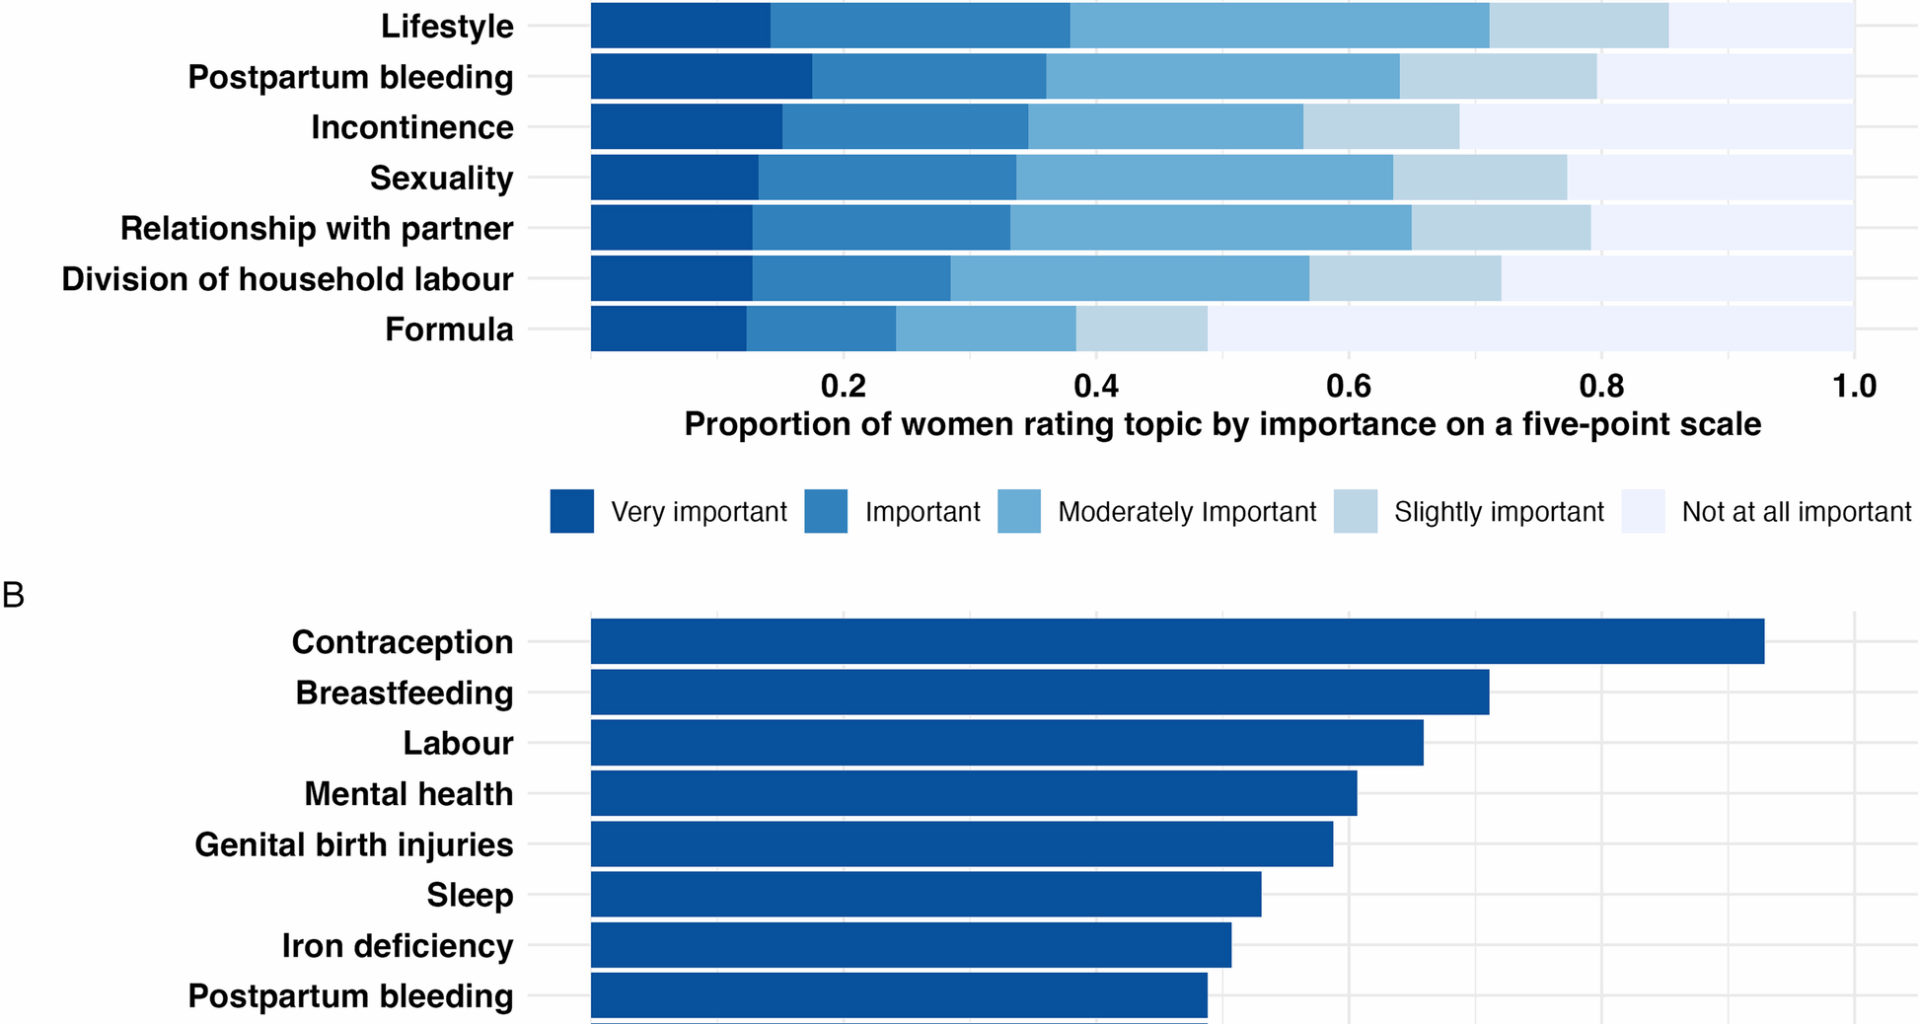
Women who had attended postpartum check-ups with GPs scored the importance of 22 key topics on a five-point Likert scale from “Not at all important” to “Very important”. The topics were derived from guidelines for postpartum care [1, 23] and the authors’ clinical experience. Next, we asked whether each topic was discussed. “Do not know” was combined with “no topic was not discussed”. Due to high correlations between the topics “low mood”, “worry and rumination” and “postpartum depression” (Spearman’s rho 0.52–0.64), we combined them in a category called “mental health”, indicating whether either of the topics were discussed. For importance, we calculated the average score and rounded it to the nearest integer. “Physical activity” and “diet” were also correlated at 0.55 and were similarly combined into “lifestyle”. Therefore, subsequent analyses and figures include 19 topics. The variance inflation factor was tested using a linear model with the dichotomous overall satisfaction as the outcome and was below 5 for all topics. Women reported whether the following examinations were performed: blood pressure measurement, anemia assessment, gynecological examination, abdominal examination and others.
We included seven Patient Reported Experience Measurements (Questionnaire items 50–56, Additional File 1) from validated questionnaires developed by The Norwegian Institute of Public Health [29]. The items have previously been used in studies of GPs [30], hospital physicians [31] and maternity and postnatal wards [21]. The response format was a five-point Likert scale. The main patient satisfaction outcome was “Overall satisfaction with the check-up”. Responses were dichotomized into ‘Satisfied’ (to a great and very great extent) and ‘Not satisfied’ (somewhat, to a small extent, not at all). Last, we asked for free-text suggestions for improvements that could increase satisfaction.
We piloted the questionnaire with three patients from general practice and three physicians. They evaluated the completion time, technical feasibility, relevance of items and whether it was easy to understand. After the pilot, questions 50–56 were added.
Statistical analysis
Categorical variables are described using frequencies with percentages. For comparison of responders to the female population in Trøndelag county and Norway, we present data on education levels from Statistics Norway [32], and age and parity from the Medical Birth Registry of Norway [33].
We used logistic regression to analyze the association between attending a postpartum check-up with either a GP, a midwife or a hospital, and the following predictor variables: Age, education, parity, self-rated health, physical and mental chronic illness, high-risk pregnancy, labour complications, mode of delivery, regular use of medication during pregnancy, municipality inhabitants, knowing that check-up is free and early contact with GP. Each model included one predictor adjusted for age and education.
We used logistic regression to analyze the association between being satisfied with the check-up overall and whether each listed topic/examination was covered during the check-up, adjusting for age, parity, physician gender and all other topics and examinations covered.
We assessed overall satisfaction by the number of topics covered, first using median and interquartile range (IQR). We thereafter used logistic regression to analyze the association between being satisfied with the check-up overall and the number of topics discussed, adjusting for gynecological examination. Based on this regression model, we used the predict function in R to estimate the predicted probabilities of being satisfied depending on the number of topics discussed under two conditions: with and without a gynecological examination. Sensitivity analyses showed that adjusting for additional variables (age, parity, GP gender, duration of patient-GP continuity, blood pressure measurement and abdominal examination) resulted in only minor changes in effect estimates and goodness-of-fit. We therefore chose the parsimonious model, which also gave the most conservative odds ratio predictions.
We used logistic regression to analyze the association between being satisfied with the check-up overall and physician gender, fitting first a univariate model, then a model adjusted for the number of topics and examinations covered. Odds ratios (ORs) are presented with 95% confidence intervals (CI), adjusted ORs are denoted adjOR.
Two researchers (CA and GV) independently reviewed the free-text answers, identified recurring categories, and quantified them. The results were compared and discussed until consensus was reached.
Analyses were performed using Stata 18 StataCorp, College Station, TX. Table 1 was made using the table 1 package in R, Version 2024.09.0 + 375. The regression models used to analyze the association between being satisfied with the check-up overall and the number of topics discussed were made in R. Predicted probabilities for being satisfied were calculated and visualized in R with the ggplot2 package.
Table 1 Descriptive characteristics of responders to survey about postpartum check-ups in Norway (2021–2022), by attendance