If you’re staring at Amphenol’s latest stock chart and wondering whether it’s the right time to buy, hold, or trim your position, you’re not alone. Over the past year, this tech hardware giant has posted an incredible 95.2% gain. In fact, if you zoom out even further, the five-year return tops 364.5%. That kind of performance turns heads and sparks debates about how much more room the stock has to run.
Even in just the past 30 days, Amphenol is up 13.8%, and the year-to-date surge sits at an eye-catching 82.3%. Some of this momentum reflects a broader appetite for electronics and connectivity stocks as markets respond to ongoing innovation in data transmission and infrastructure. Investors have been willing to pay up for the company’s steady growth and reputation for resilience through shifting economic cycles.
But what about valuation? As tempting as it is to chase a winner, it’s smart to pause and check whether Amphenol still represents an attractive value. Based on several standard valuation checks, Amphenol is considered undervalued in only 1 out of 6 metrics, so it is not a classic bargain-bin play. Of course, the real story often lies beneath the headline numbers.
Next, we will break down each major valuation approach to see what they reveal about Amphenol. Stay tuned to the end for a perspective on valuation that moves beyond just ratios and checklists.
Amphenol scores just 1/6 on our valuation checks. See what other red flags we found in the full valuation breakdown.
Approach 1: Amphenol Discounted Cash Flow (DCF) Analysis
The Discounted Cash Flow (DCF) model estimates what a company is really worth by projecting its expected cash flows many years into the future and then discounting those amounts back to today’s dollars. This method gives investors a sense of the company’s intrinsic value, factoring in both growth and uncertainty.
For Amphenol, the most recent twelve months’ Free Cash Flow stands at $3.0 Billion. Analysts forecast steady growth, expecting Free Cash Flow to reach around $5.6 Billion by 2028. Beyond that, growth is extrapolated, and by 2035, estimates suggest cash flow could approach $8.3 Billion. All figures are provided in US dollars.
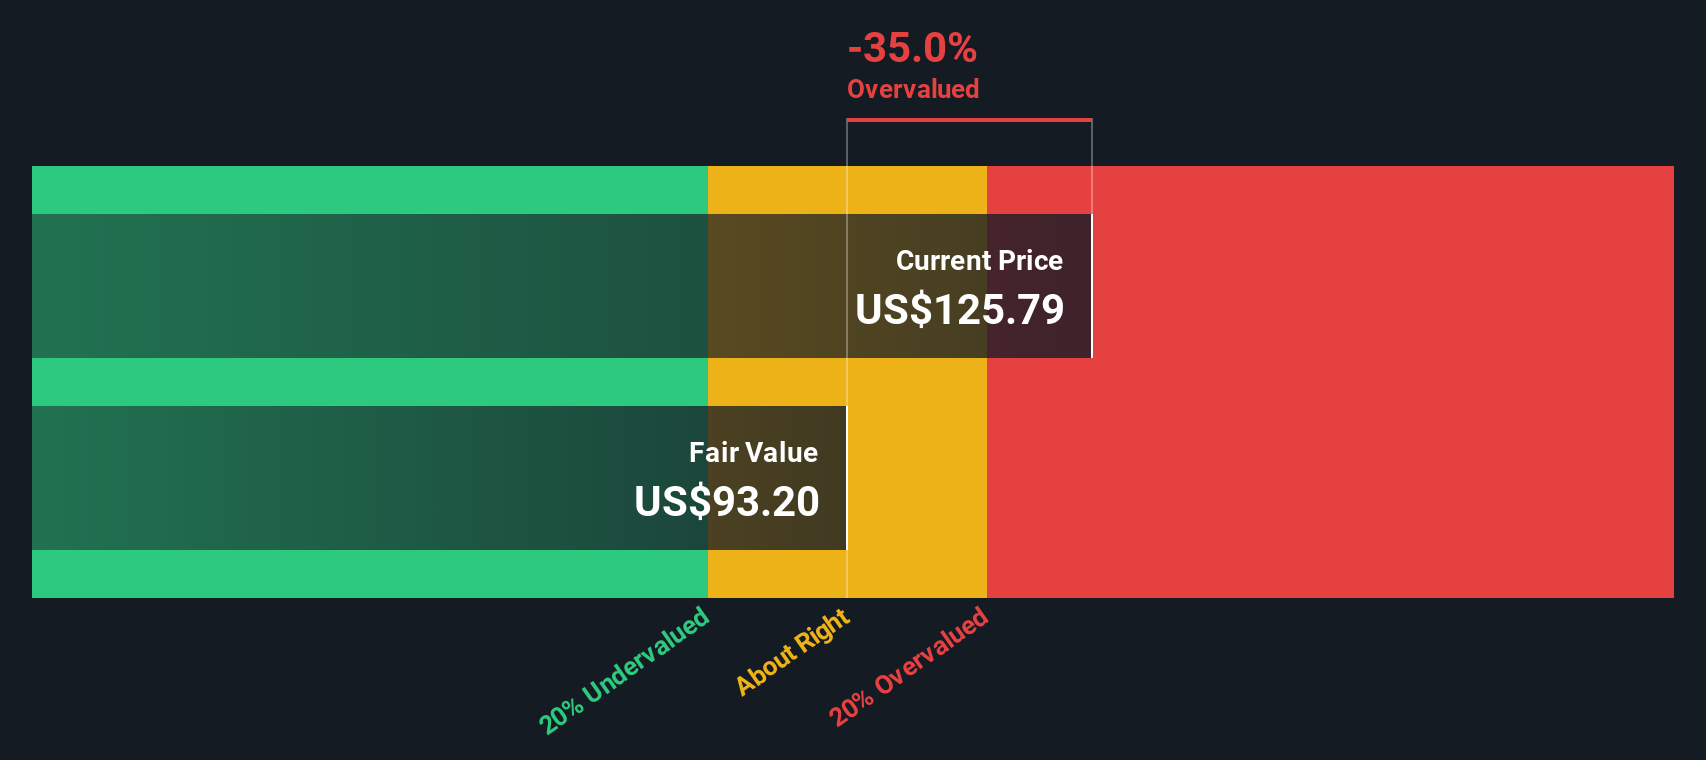
Based on this model’s projections, the estimated intrinsic fair value for Amphenol is $93.20 per share. However, the current market price is about 35% higher than this calculated value, meaning the stock appears overvalued according to the DCF approach.
Result: OVERVALUED
 APH Discounted Cash Flow as at Oct 2025
Our Discounted Cash Flow (DCF) analysis suggests Amphenol may be overvalued by 35.0%. Find undervalued stocks or create your own screener to find better value opportunities.
Approach 2: Amphenol Price vs Earnings
When assessing profitable companies like Amphenol, the Price-to-Earnings (PE) ratio is a widely trusted valuation tool. The PE ratio indicates how much investors are paying for each dollar of current earnings and is particularly valuable because it accounts for real bottom-line profitability, rather than top-line growth or asset values.
What counts as a “normal” or “fair” PE ratio can vary. Faster-growing businesses and those with lower perceived risk tend to command higher multiples. Slower-growing or riskier companies generally see lower ratios. This is why it is helpful to view a company’s PE in the context of both its industry and direct competitors.
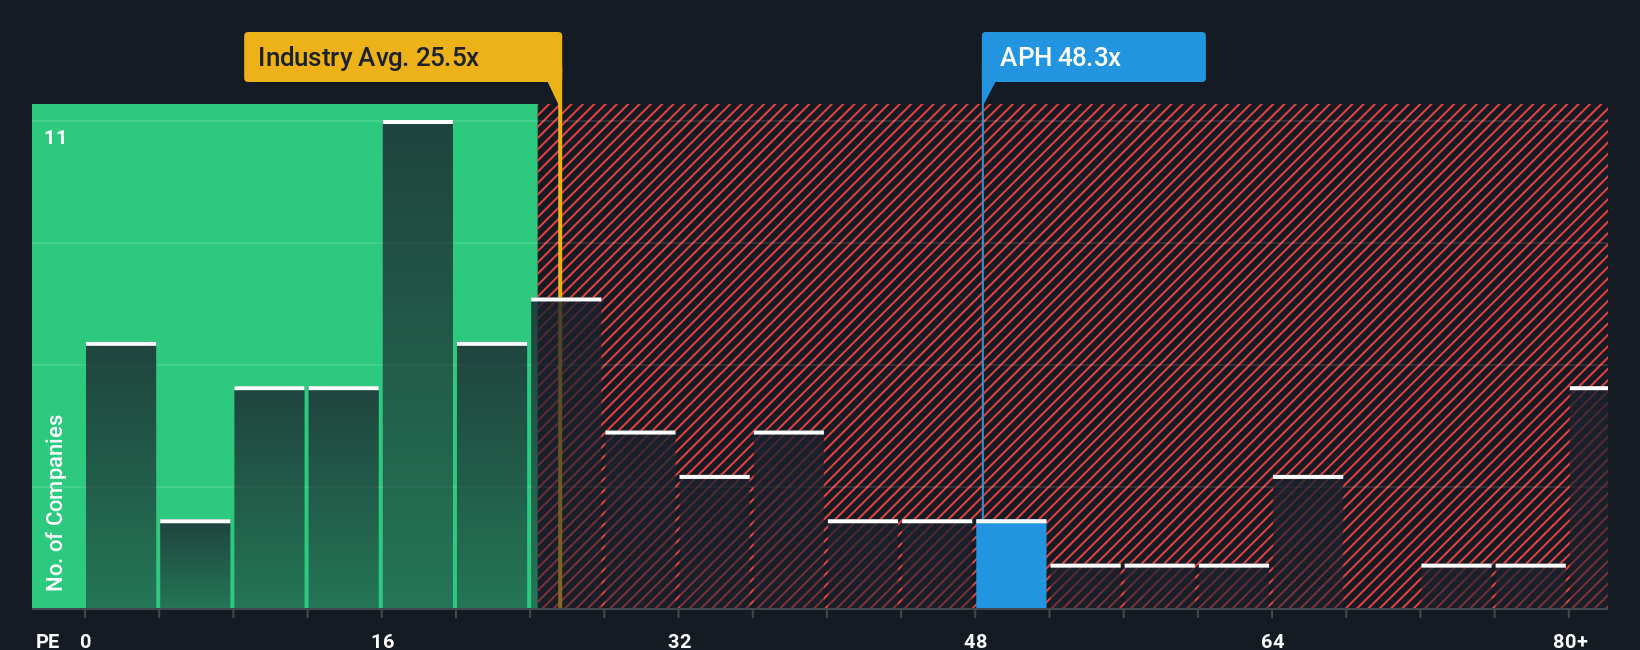
Amphenol’s current PE is 48.3x, which is notably higher than the Electronic industry average of 25.5x and slightly below the peer average of 54.2x. However, not all high PE ratios indicate overvaluation, especially if future earnings growth is strong or the business quality is superior.
To address these nuances, Simply Wall St calculates a “Fair Ratio” for each company. This proprietary metric tailors the expected PE to the company’s actual earnings growth, profit margins, market cap, industry characteristics, and risk profile. Unlike a basic comparison with sector averages, the Fair Ratio offers a more personalized and meaningful benchmark for value.
Currently, Amphenol’s Fair Ratio is 35.5x, which is well below its actual PE. This suggests the stock is priced significantly higher than what would be considered reasonable for its financial profile and outlook at this stage.
Result: OVERVALUED
 NYSE:APH PE Ratio as at Oct 2025
PE ratios tell one story, but what if the real opportunity lies elsewhere? Discover companies where insiders are betting big on explosive growth.
Upgrade Your Decision Making: Choose your Amphenol Narrative
Earlier we mentioned that there is an even better way to understand valuation, so let us introduce you to Narratives. A Narrative is your story-driven perspective on a company, tying together your outlook for future revenue, earnings, and margins to arrive at your own estimate of fair value. Instead of just relying on fixed ratios or consensus targets, Narratives let you express your conviction about where the company is headed and why. This connects the dots from a company’s story, to a forecast, and ultimately to a fair value.
Narratives are simple to use and available for every company on Simply Wall St’s Community page, where millions of investors share and compare their views. By aligning your Narrative’s fair value with Amphenol’s current share price, you can quickly gauge whether it feels like the right time to buy, hold, or sell, based on your personal conviction. Even better, your Narrative updates automatically as new news or earnings are released, ensuring your view always reflects the latest information.
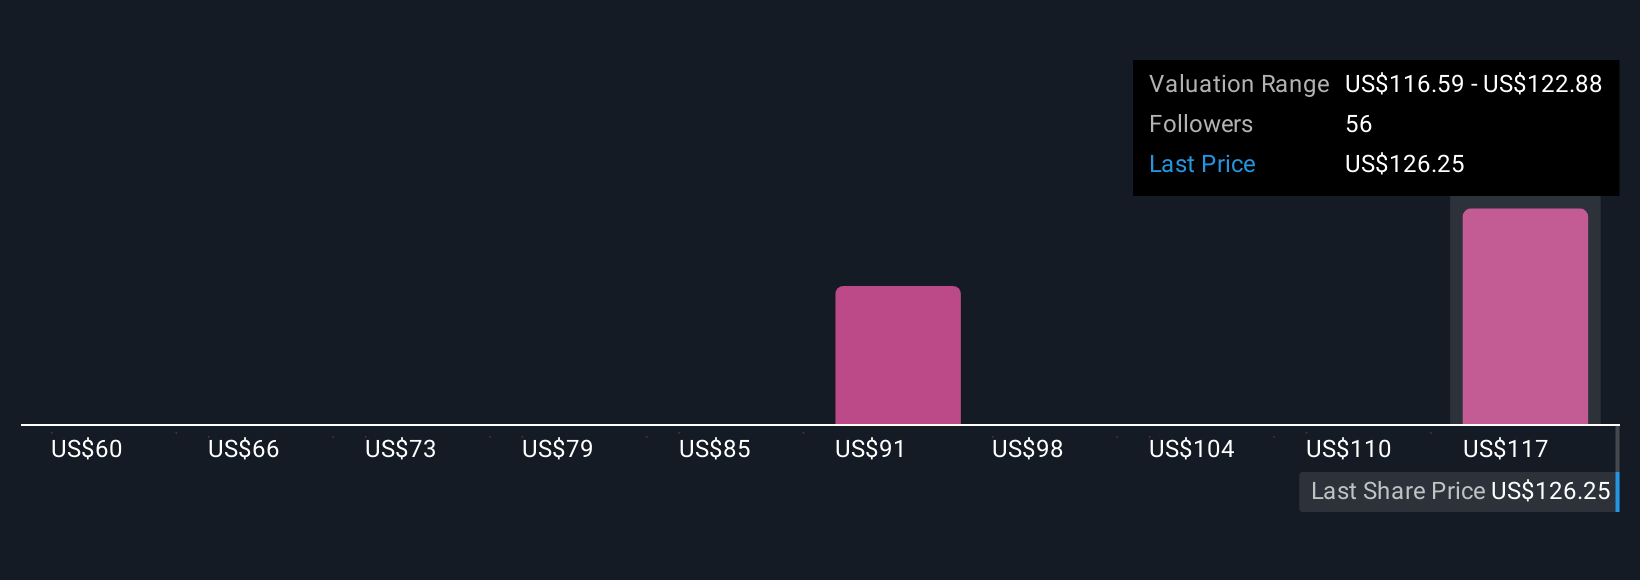
For example, recent analyst Narratives for Amphenol show a wide range of fair values, from $85 for cautious forecasts to $134 for the most optimistic growth assumptions. This illustrates how your perspective and future expectations can drive your investment decision.
Do you think there’s more to the story for Amphenol? Create your own Narrative to let the Community know!
 NYSE:APH Community Fair Values as at Oct 2025
This article by Simply Wall St is general in nature. We provide commentary based on historical data
and analyst forecasts only using an unbiased methodology and our articles are not intended to be financial advice. It does not constitute a recommendation to buy or sell any stock, and does not take account of your objectives, or your
financial situation. We aim to bring you long-term focused analysis driven by fundamental data.
Note that our analysis may not factor in the latest price-sensitive company announcements or qualitative material.
Simply Wall St has no position in any stocks mentioned.
New: Manage All Your Stock Portfolios in One Place
We’ve created the ultimate portfolio companion for stock investors, and it’s free.
• Connect an unlimited number of Portfolios and see your total in one currency
• Be alerted to new Warning Signs or Risks via email or mobile
• Track the Fair Value of your stocks
Have feedback on this article? Concerned about the content? Get in touch with us directly. Alternatively, email editorial-team@simplywallst.com
