
MultiModalGraphics is an R/Bioconductor package that leverages object-oriented S4 classes to visualize multimodal biological data with embedded statistical annotations. Originally developed for collaborative multi-omics studies [23,24,25], the source code has been refined and packaged into a publicly accessible tool that enables the generation of scatterplots and heatmaps enriched with quantitative measures. The package is fully interoperable with established Bioconductor infrastructure—including MultiAssayExperiment and limma/voom—providing a seamless pipeline from raw data processing to reproducible visualization.
The framework is organized around three core S4 classes—AnnotatedHeatmap, CompositeFeatureHeatmap, and ThresholdedScatterplot—each offering dedicated constructors and methods that streamline the creation of statistically annotated visualizations. To maintain clarity and readability, we provide a concise narrative overview of these classes in the main text, while detailed method listings are available in Supplementary Table S1.
Note Representative R code configurations for all classes and figures are provided in Supplementary Code Examples, ensuring full reproducibility of the visualizations shown in this section.
AnnotatedHeatmap (enhanced statistical heatmaps)
The AnnotatedHeatmap class extends ComplexHeatmap-based visualizations by overlaying statistical outputs—such as p-values, q-values, or variance measures—directly on the heatmap grid. This functionality enables researchers to distinguish statistically significant or trending features beyond color intensity alone. For example, significance levels can be displayed as stars or dots on individual heatmap tiles, allowing immediate recognition of biologically relevant patterns (Fig. 1).
Fig. 1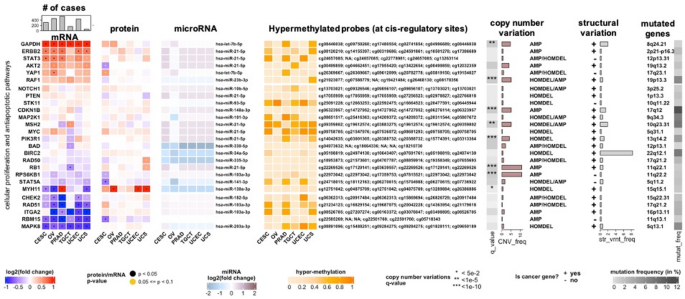
Example output from the AnnotatedHeatmap class, displaying statistical overlays (stars/dots) on heatmap tiles to indicate significant or trending molecular features. This enables immediate assessment of statistical relevance beyond color intensity alone. Data are drawn from integrated multimodal pan-cancer datasets (TCGA, ICGC, and cBioPortal), covering six cancer types: CESC (cervical squamous cell carcinoma and endocervical adenocarcinoma), OV (ovarian serous cystadenocarcinoma), PRAD (prostate adenocarcinoma), TGCT (testicular germ cell tumors), UCEC (uterine corpus endometrial carcinoma), and UCS (uterine carcinosarcoma). The corresponding R code configuration used to generate this plot is provided in Supplementary Code Examples
The class is compatible with multiple data sources, including expression matrices, precomputed statistical tables, and MultiAssayExperiment objects, ensuring broad applicability across multi-omics workflows. A representative configuration used to generate Fig. 1 is provided in Supplementary Code Examples, illustrating how statistical thresholds and visual markers are specified to overlay significance directly onto heatmap tiles.
CompositeFeatureHeatmap (pathway and group-level heatmaps)
The CompositeFeatureHeatmap class generates composite heatmaps that integrate multiple dimensions of information at the pathway or feature-group level. Tile colors typically encode pathway activity (e.g., z-scores), while overlaid dots convey enrichment significance (p-values) and dot size reflects feature counts. This multidimensional encoding provides an integrative view of biological activity across tissues, timepoints, or experimental conditions, enabling rapid identification of shared and distinct pathway-level signals (Fig. 2).
Fig. 2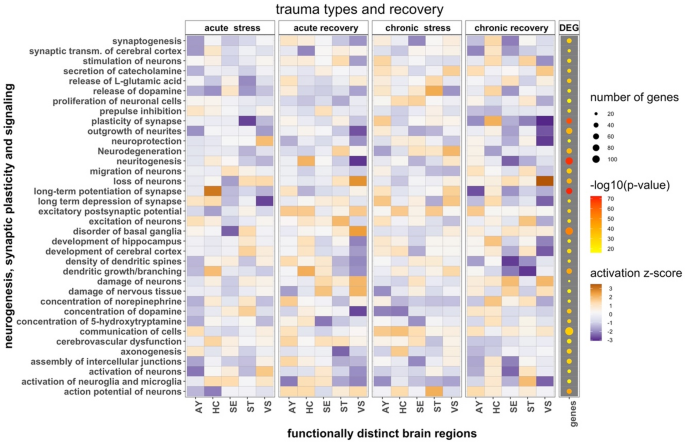
Example output from the CompositeFeatureHeatmap class, summarizing pathway-level activity across multiple brain regions and timepoints. Tile colors encode z-scores, overlaid dots encode significance, and dot size reflects feature counts, allowing multidimensional comparisons across conditions. The visualization summarizes results from 20 gene expression datasets (each ~ 45 K features across 10 mice) collected from five mouse brain regions at four timepoints (GEO accession GSE45035). The regions include AY (amygdala), HC (hippocampus), MPFC (medial prefrontal cortex), SE (septal region), ST (corpus striatum), and VS (ventral striatum). The heatmap highlights inhibition of neurogenesis and synaptic plasticity pathways associated with differentially expressed genes across time. The corresponding R code configuration used to generate this plot is provided in Supplementary Code Examples
This approach is particularly valuable for summarizing large-scale datasets and supporting comparative analyses across biological contexts. A representative configuration used to generate Fig. 2 is provided in Supplementary Code Examples, demonstrating how z-scores, p-values, and feature counts are mapped to distinct graphical encodings to support pathway-level interpretation.
ThresholdedScatterplot (volcano and thresholded scatterplots)
The ThresholdedScatterplot class generalizes ggplot2-based scatterplots and volcano plots by embedding explicit statistical thresholds directly within the visualization. Fold-change and p-value cutoffs are automatically applied, and the number of upregulated, downregulated, and neutral features is annotated within each panel. This explicit integration of thresholds enhances transparency and allows rapid, quantitative interpretation of differential results across datasets (Fig. 3).
Fig. 3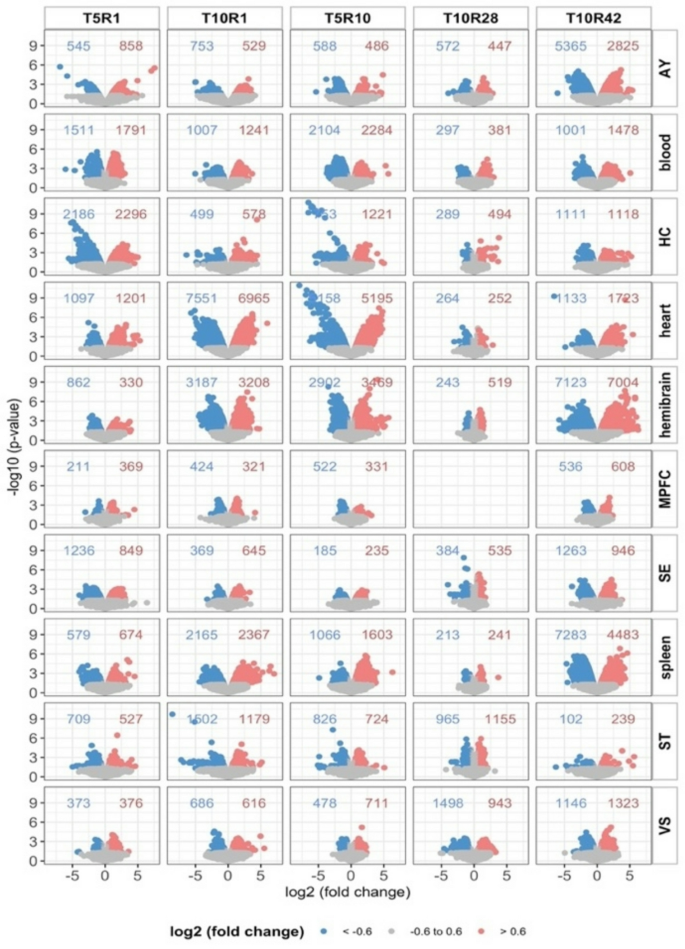
Example output from the ThresholdedScatterplot class (volcano-style), illustrating log2 fold changes against − log10 p-values with thresholds for significance explicitly marked. Numbers of up- and down-regulated features are annotated in each panel, enabling transparent and quantitative interpretation of differential results. Data are from multi-tissue, multi-timepoint studies of differentially expressed genes across spleen, heart, blood, and seven brain regions at five timepoints (T5R1, T5R10, T10R1, T10R28, and T10R42; GEO accession GSE68077). Brain region abbreviations: AY (amygdala), HC (hippocampus), MPFC (medial prefrontal cortex), SE (septal region), ST (corpus striatum), and VS (ventral striatum). T indicates days of trauma exposure, and R indicates post-trauma tissue collection days. These datasets were downloaded from Gene Expression Omnibus GSE68077. The corresponding R code configuration used to generate this plot is provided in Supplementary Code
The method supports flexible inputs and produces publication-ready scatterplots that remain fully extensible for further customization. The configuration used to generate Fig. 3 is provided in Supplementary Code Examples, illustrating how thresholds and annotation options are applied to improve interpretability.
High-level wrapper: MultiModalPlot()
The package also provides a high-level wrapper function, MultiModalPlot(), designed to integrate multiple visualization types—such as heatmaps and scatterplots—into a single composite figure. The wrapper automatically detects input types, including raw matrices, precomputed statistical tables, and MultiAssayExperiment objects, and dispatches them to the appropriate visualization class. The configuration used to generate such composite multimodal figures is provided in Supplementary Code Examples.
Importantly, MultiModalPlot() is offered as an optional convenience interface to simplify exploratory workflows and reduce the coding burden for users who wish to generate multimodal panels quickly. It does not replace the core classes, which remain fully accessible for advanced customization. The wrapper returns the underlying S4 or ggplot objects, thereby ensuring that transparency and extensibility are preserved.
Practical guidance on when to use MultiModalPlot() versus the individual S4 classes is provided in Supplementary Table S2, which outlines their complementary roles, typical use cases, and transparency considerations.
Overall, MultiModalGraphics provides a flexible and extensible framework for integrating statistical annotations directly into visualizations. By combining dedicated S4 classes, an optional unifying wrapper, and interoperability with Bioconductor infrastructure, the package supports reproducible, interpretable, and customizable visualization of complex biological datasets.