
Introduction
The fall housing market offered buyers slightly better conditions as easing mortgage rates and a modest rise in inventory improved both affordability and choice. Mortgage rates began July near 6.7% and fell to roughly 6.26% by late September, their lowest level since early spring. The rate relief, though modest, helped bring some buyers back into the market, contributing to an uptick in new-home sales and pending home sales in August, and more is expected in the fall as long as rates remain low.
Even so, overall sentiment and activity remain muted. Many buyers continue to grapple with affordability challenges, and uncertainty surrounding the broader economy, including the recent government shutdown, has kept both buyers and sellers cautious. Confidence remains fragile, with many households waiting for clearer signals on inflation, job stability, and interest rate trends before making major housing decisions.
Employment data this quarter shows a cooling labor market, with job growth slowing and unemployment hovering near 4%. The softer trend has prompted the Federal Reserve to begin cutting rates, lowering its benchmark to around 4%–4.25% and signaling the possibility of further easing ahead. While mortgage rates don’t move in lockstep with Fed policy, lower short-term rates could help nudge borrowing costs down and modestly improve affordability. Still, with hiring momentum slowing and inflation lingering, both buyers and sellers remain cautious about how much relief lower rates will truly bring.
In this mixed environment, the housing market remains highly segmented. Lower-budget buyers are concentrating demand in the nation’s most affordable metros, while higher-income shoppers continue to compete in pricier markets near major economic hubs. Regionally, the divide is also stark as the Northeast and Midwest continue to experience tight conditions due to limited supply and sustained demand, whereas the South and West are seeing a gradual rebalancing as new construction and slower price growth help bring these markets closer to equilibrium.
Fall 2025 Housing Market Ranking
The housing market has shifted modestly in buyers’ favor, both in general and in keeping with seasonal trends. Fall typically brings more inventory, less competition, and softer prices than the summer peak, and this year is no exception. The Wall Street Journal/Realtor.com® Housing Market Ranking highlights metros that remain highly competitive, as they offer buyers a lower cost of living, desirable amenities, stable economies, and relative affordability near major economic hubs. This quarter’s top market, Manchester-Nashua, NH, held its leading position for a second straight quarter, reflecting sustained demand, brisk sales activity, and notable year-over-year price growth. Consistently among the nation’s hottest housing markets, Manchester-Nashua continues to balance desirability with relative value.
The ranking identifies markets that those considering a home purchase should add to their short list—whether the goal is to live in it or rent it out as a home to others. We reviewed data for the 200 largest metropolitan areas in the United States. The fall 2025 ranking surfaced the following top areas:
Regional divide deepens as Midwest and Northeast hold firm
Today’s housing market remains largely unchanged from recent quarters. The South and West continue to cool from the COVID-19 pandemic-era frenzy, while the Northeast and Midwest maintain enough buyer demand to keep for-sale inventory relatively tight. This ongoing stagnation highlights the persistent affordability challenges that have prevented the market from shifting meaningfully in recent years.
The Midwest’s growing appeal in today’s market stems from its housing affordability, low cost of living, and relative climate resiliency. The region’s leading markets this quarter tend to be midsized and highly affordable, both in home prices and everyday expenses. Median home prices in the top-performing Midwest metros ranged from roughly $240,000 to $400,000, with only Green Bay exceeding the national median. On average, essential living costs in these markets are about 8.5% lower than the national level, giving buyers the dual benefit of lower housing and overall living expenses.
In contrast, Northeast markets remain less affordable but continue to attract strong demand as buyers compete for limited inventory. Both Manchester-Nashua, NH, and Worcester, Mass.-Conn., appear on this quarter’s list, underscoring the enduring demand for affordability in Boston-adjacent metros. With median listing prices of $575,000 and $553,000, respectively, these areas offer Boston-area home shoppers more value within a reasonable commuting distance. High-earning buyers seeking to stretch their dollars further continue to create cross-market housing demand in markets that are close to economic hubs.
Top markets offer desirability in tough circumstances
The top 20 markets in the Fall 2025 Ranking continue to demonstrate that even under challenging economic conditions, value, stability, and local strength can outperform broader national trends. These metros, spanning mainly the Midwest and Northeast, continue to perform well. Collectively, they pair strong housing demand with favorable climate resiliency and unemployment rates below 5%, suggesting that affordability and resilience remain the core ingredients of market desirability this quarter.
One key headwind facing this quarter’s top markets is limited inventory. While new construction in the South and West has modestly boosted supply, the Northeast and Midwest continue to see slower building activity, keeping for-sale listings tight as existing homeowners stay put. With more than 80% of outstanding mortgages carrying rates below 6%, most owners remain locked into loans well below today’s levels. As a result, even if mortgage rates continue to ease and bring more buyers into the market, sellers are likely to remain cautious until borrowing costs fall closer to the rates they already hold.
Another factor bolstering the appeal of this quarter’s top markets is their relatively low unemployment rates. Many metros in the top 20 recorded unemployment rates below 5%, reflecting stable local labor markets even as national economic uncertainty persists. This stability is particularly valuable at a time when job security and income confidence weigh heavily on consumer decisions. Quite a few of the top markets saw unemployment rates below the national rate of 4.3% in August, signaling healthy employment bases that help sustain housing demand. Strong local job markets not only support purchasing power but also provide a sense of economic resilience, which is critical for both buyers and sellers navigating an uncertain broader outlook.
Unlocking momentum: The factors that could shift housing
For the housing market to truly shift gears, one of the key pressures—affordability—has to ease. Mortgage rates remain the central constraint: Even modest declines could unlock significant pent-up demand from would-be buyers sidelined by high monthly payments. But unless rates fall meaningfully or income growth catches up, the cost of buying will continue to deter many first-time and move-up buyers alike.
Inventory is the other crucial lever. Today’s scarcity stems from a decade of underbuilding and the “lock-in effect,” with homeowners reluctant to trade their low pandemic-era rates for higher ones. A meaningful rise in listings, whether through increased new construction or greater seller mobility, could bring some balance back to the market. Builders have ramped up production in some regions, but structural land, policy, labor, and materials constraints mean relief will likely come slowly, especially to the most in-demand regions.
Economic sentiment also plays a role. If inflation continues to cool and the labor market stays resilient, confidence could improve and bring more buyers and sellers off the sidelines. Conversely, renewed economic uncertainty might keep the market frozen in its current pattern of low supply and cautious demand.
Ultimately, for the housing market to change from stuck to moving, something’s got to give on costs, confidence, or construction. Until then, the push and pull between affordability limits and lingering demand will continue to shape a market that feels familiar quarter after quarter.
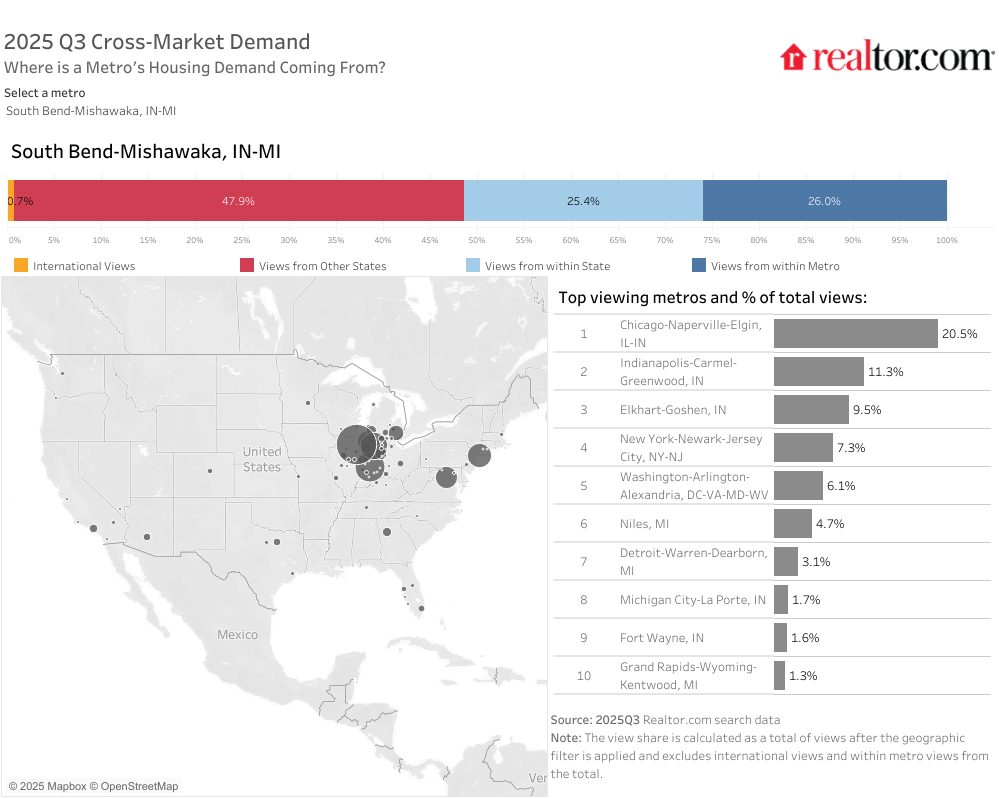
City spotlight: South Bend-Mishawaka, IN-MI
South Bend-Mishawaka, Ind.-Mich., climbed 21 spots since last quarter to rank third overall, reflecting its growing appeal among value-driven homebuyers. Located roughly 100 miles from Chicago, Grand Rapids, and Fort Wayne, South Bend benefits from its proximity to major job markets. The metro’s economy is anchored by higher education, health care, and advanced manufacturing, with the University of Notre Dame serving as both a cultural anchor and an innovation hub.
On the housing front, South Bend’s conditions remain tight. For-sale inventory in Q3 was 37.8% below pre-pandemic levels, driving home prices up more than 50% since 2019. Even with this growth, the metro remains affordable with a median listing price of $312,000 in September, almost 40% below the national median.
South Bend is midsized with roughly 325,000 residents, but pulled roughly three-quarters of its listing viewership from shoppers outside of the metro, due in large part to its proximity to Chicago. The median listing price in South Bend climbed 18.3% compared to one year before in September, and homes spent just 42 days on the market, roughly three weeks less than the national median.
South Bend’s performance typifies the broader Midwest story this fall: Affordability paired with economic steadiness is keeping these markets resilient even as others cool. Midsized metros with strong local anchors, whether universities, hospitals, or manufacturing clusters, are capturing both local and inbound demand, reinforcing that in a challenging national market, desirability often stems from dependability.
South Bend Housing Highlights
YoY % Change
South Bend draws home shoppers from other Midwest metros
Returning markets
Eighteen of this quarter’s top 20 markets were also on last quarter’s list, highlighting the relative stagnancy of today’s housing market.
Markets falling out of the top 20
Two markets fell off the list from last quarter to this quarter, dropping 3 to 12 spots. The biggest mover was the metro of Waterbury-Shelton, CT, which fell 12 spots this fall. The markets that fell out of the top 20 didn’t fall far, remaining in the top 25 and emphasizing the holding pattern that the housing market is in.
New markets
Taking the places of the two descended markets were one Midwest and one Northeast market. Both markets ascended from within the top 25, climbing between 6 and 21 spots. Affordable metros reign supreme in today’s high-priced housing market, with new entries confirming this trend by both boasting sub-$350,000 price points.
Methodology
The ranking evaluates the 200 most populous core-based statistical areas, as measured by the U.S. Census Bureau and defined by July 2023 OMB delineation standards for eight indicators across two broad categories: real estate market (60%) and economic health and quality of life (40%). Each market is ranked on a scale of 0 to 100 according to the category indicators, and the overall result is based on the weighted sum of these rankings. The real estate market category indicators are real estate demand (15%), based on average page views per property; real estate supply (15%), based on median days on the market for real estate listings; median listing price trend (15%), based on annual price growth over the quarter; property taxes (10%); and climate risk to properties (10%). The economic and quality of life category indicators are unemployment (5%); wages (5%); regional price parities (5%); the share of foreign born (5%); small businesses (5%); amenities (10%), measured as the average number of stores per specific “everyday splurge” category (coffee, upscale/specialty grocery, home improvement, fitness) per capita in an area; and commute time (5%).