Literature retrieval and screening process
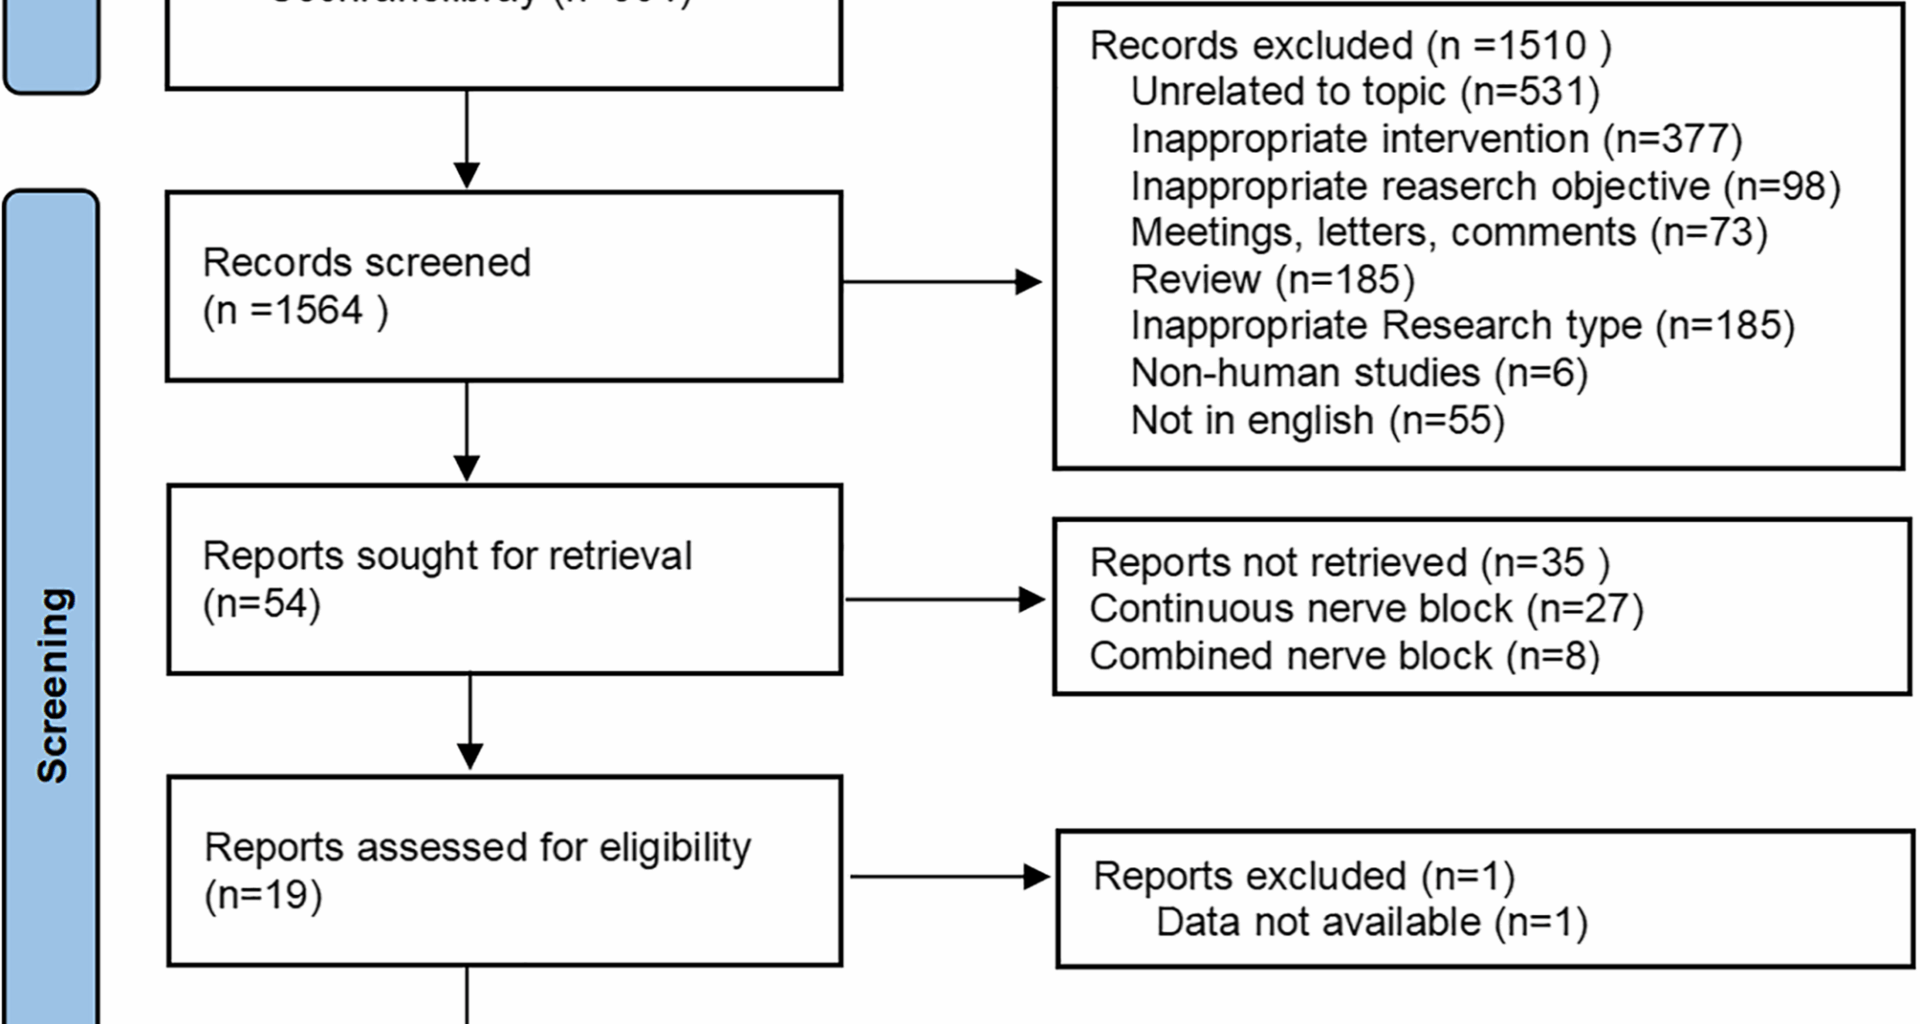
The initial literature search yielded 2,679 articles. After removing 1,115 duplicate records, the titles and abstracts of the remaining 1,564 articles were checked, and 1,510 articles were excluded. The full texts of the remaining articles were reviewed according to predetermined inclusion and exclusion criteria. Ultimately, 18 articles [12, 13, 30,31,32,33,34,35,36,37,38,39,40,41,42,43,44,45] were included. The flowchart demonstrating the study selection is presented in Fig. 1.
Fig. 1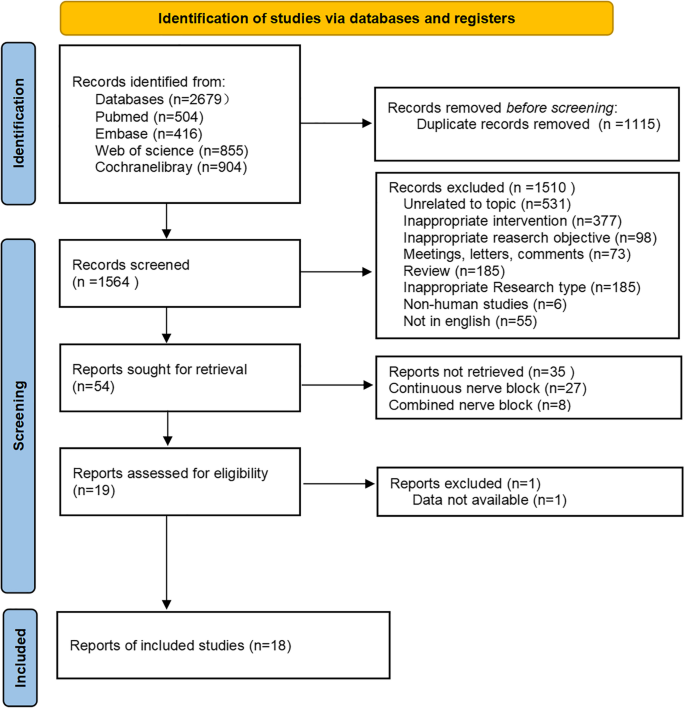 Baseline characteristics of included studies
The 18 included studies were conducted in 12 countries (the United States, Argentina, Chile, China, Egypt, France, India, Ireland, Italy, Japan, Korea, and Turkey), involving a total of 1,180 patients. The study population comprised 556 males and 624 females, and the age of patients ranged from 41 to 72 years. Among these, 10 studies [33, 34, 36,37,38,39,40,41, 43, 45] reported a mean age of over 60 years. All nerve blocks were performed under ultrasound guidance. Of the 18 studies, nerve blocks were performed preoperatively in 12 studies [12, 13, 33,34,35, 37,38,39,40,41,42,43], postoperatively in 5 studies [30,31,32, 44, 45], while 1 study [36] did not specify the timing of the block. Regarding the type of anesthesia used, 6 studies [12, 30, 34, 39, 41, 42] employed general anesthesia, 10 studies [13, 31, 32, 35, 37, 38, 40, 43,44,45] used neuraxial anesthesia, and 2 studies [33, 36] included both general anesthesia and neuraxial anesthesia. Regarding the surgical approach in THA, 8 studies [12, 31, 32, 34, 37, 38, 40, 43] used the posterior approach, 1 study [39] used the anterior approach, 2 studies [33, 41] employed the direct lateral approach, while 7 studies [13, 30, 35, 36, 42, 44, 45] did not specify the surgical approach. Detailed baseline characteristics of studies can be found in Table 1.
Table 1 Baseline characteristicsMethodological quality assessment of included studies
The risk of bias assessment results of the 18 studies are shown in Fig. 2. Several methodological concerns were identified in randomization-related bias: two studies [39, 44] were deemed to have a high risk of bias as the allocation was not adequately concealed, and a third study [41] showed significant differences in baseline characteristics between the exposed and control groups. Two further studies [30, 45] had raised moderate concerns related to either insufficient randomization, or inadequate allocation concealment protocols. The remaining thirteen studies [12, 13, 31,32,33,34,35,36,37,38, 40, 42, 43] had robust randomization procedures and were classified as low risk. With respect to missing outcome data and outcome measurement, all studies were judged to be at low risk of bias as there were no significant departures from their planned interventions. All studies were assessed as having an unclear risk in selective reporting because none of them clarified whether the analysis methods before and after unblinding were consistent. In general, these studies were found to be at unclear risk of bias. More details are provided in Supplementary Material, Table S5.
Fig. 2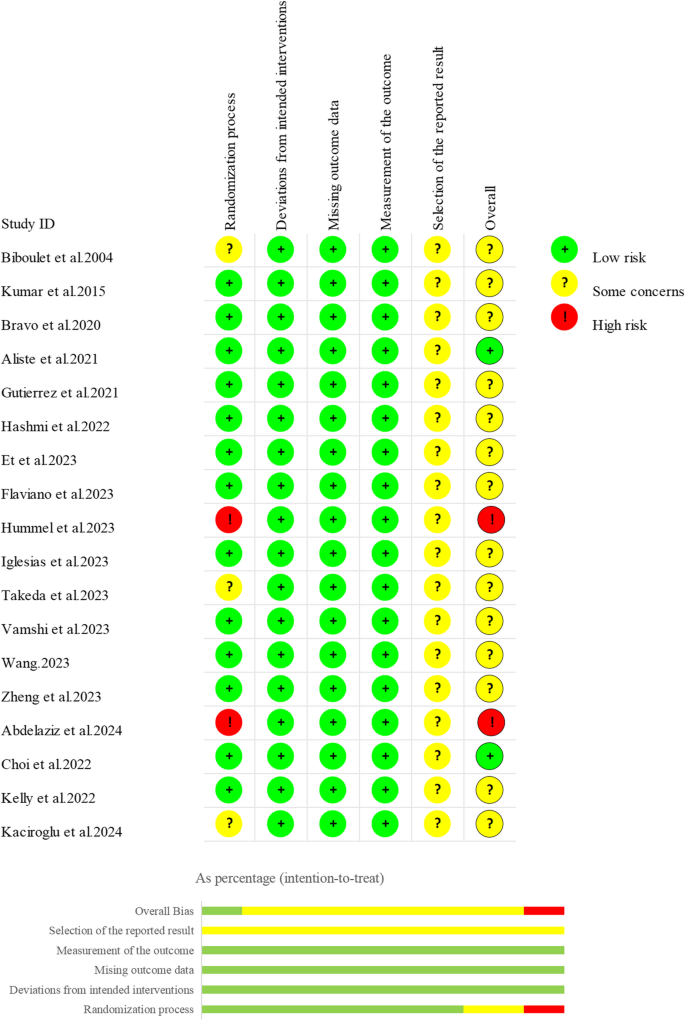 The certainty of evidence
The results of the CINeMA framework for assessing the quality of evidence showed that the confidence level of the evidence for dynamic pain scores 24 h after surgery was mainly very low. The confidence level of the evidence for static pain scores 24 h after surgery was mainly low. The confidence level of the evidence for OME 24 h after surgery was mainly very low. The confidence level of the evidence for postoperative nausea or vomiting was mainly low (Table 2.).
Table 2 Certainty of the evidenceNetwork analysis resultsNetwork diagram
Eleven distinct nerve block interventions were covered in the 18 included studies: circum-psoas block (CPB), FNB, I_FICB, lumbar erector spinae plane block at the L3 vertebra level (L3_ESPB), lumbar erector spinae plane block at the L4 vertebra level (L4_ESPB), LPB, PENG, lateral quadratus lumborum block (QLB1), anterior quadratus lumborum block (QLB3), S_FICB, and paravertebral nerve block at the T12 vertebra level (T12_PVB). Figure 3 illustrates the relationships between interventions. The line thickness is proportional to the number of comparative studies, and the node size is proportional to the sample size for each intervention. Node-splitting analysis was conducted for outcomes with closed loops (Fig. 4). The P values for the 24-hour postoperative static pain score, 24-hour postoperative OME, and postoperative vomiting were greater than 0.05, suggesting no local inconsistency. Due to the absence of closed loops in both the 24-hour postoperative dynamic pain scores and postoperative nausea data, node-splitting analysis was not conducted.
Fig. 3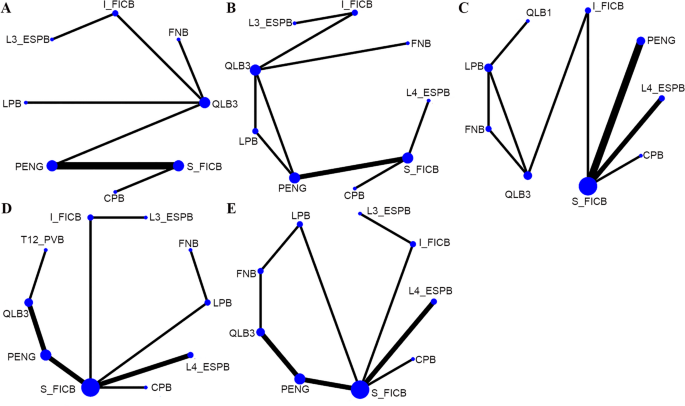
Network diagram. A 24-hour dynamic pain score after surgery; B 24-hour static pain score after surgery; C 24-hour OME after surgery; D Postoperative nausea; E Postoperative vomiting
Fig. 4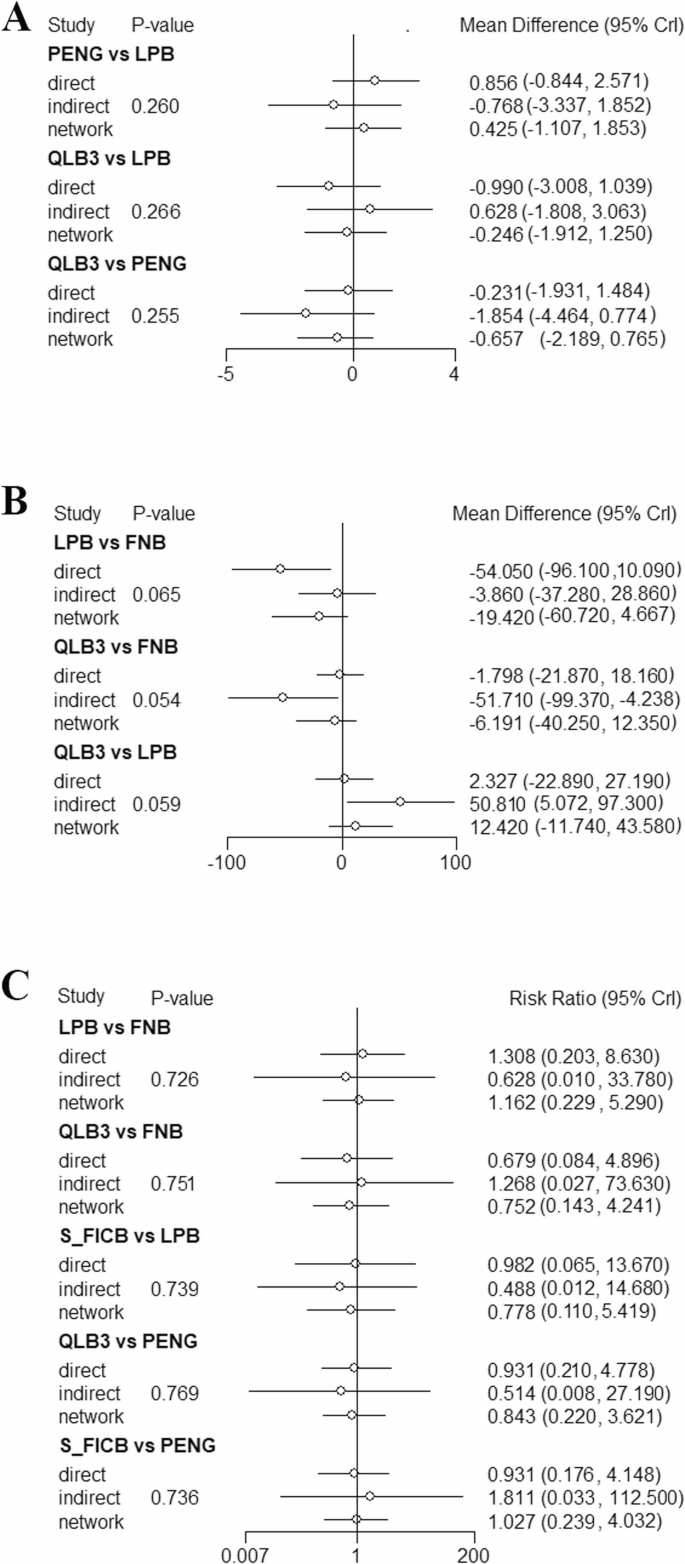
Node splitting analysis. A 24-hour static pain score after surgery; B 24-hour OME after surgery; C Postoperative vomiting
24-hour postoperative dynamic pain score
A total of 9 studies [32,33,34, 37, 41,42,43, 45], including 542 subjects, reported this outcome. The interventions included CPB, FNB, I_FICB, L3_ESPB, LPB, PENG, QLB3, and S_FICB. The results demonstrated that compared with S_FICB, CPB (MD = −0.57, 95% CrI: −0.89, −0.25), FNB (MD = −2.5, 95% CrI: −3.6, −1.41), I_FICB (MD = −2.94, 95% CrI: −4.72, −1.16), L3_ESPB (MD = −2.66, 95% CrI: −4.79, −0.52), PENG (MD = −1.84, 95% CrI: −2.08, −1.61), and QLB3 (MD = −2.04, 95% CrI: −2.64, −1.45) were associated with lower 24-hour postoperative dynamic pain scores. Compared with CPB, FNB (MD = −1.93, 95% CrI: −3.07, −0.79), I_FICB (MD = −2.37, 95% CrI: −4.18, −0.57), PENG (MD = −1.27, 95% CrI: −1.67, −0.88), and QLB3 (MD = −1.47, 95% CrI: −2.14, −0.80) were also associated with lower 24-hour postoperative dynamic pain scores (Table 2..). Based on the cumulative probability analysis, I_FICB (SUCRA: 85.71%) ranked highest in reducing 24-hour postoperative dynamic pain scores, followed by FNB (SUCRA: 77.00%), while S_FICB (SUCRA: 0.51%) ranked last. (Tables 3. and 4; Figs. 5 and 6). Subgroup analysis based on anesthesia method showed that in the spinal anesthesia group, CPB ranked highest for 24-hour dynamic pain scores. However, the general anesthesia group was not eligible for further analysis due to no closed loop. Subgroup analysis based on surgical approach showed that the postoperative group was not eligible for further analysis due to no closed loop, and the preoperative group was not eligible for further analysis due to DIC values greater than 5. (Tables 5, 6 and 7)
Table 4 Cumulative probability ranking tableFig. 5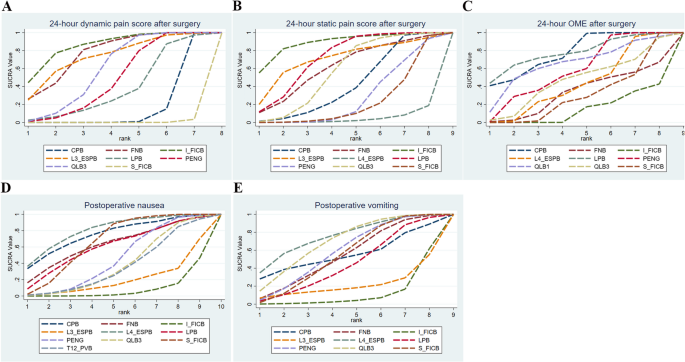
surface under the cumulative ranking curve line chart. A 24-hour dynamic pain score after surgery; B 24-hour static pain score after surgery; C 24-hour OME after surgery; D Postoperative nausea; E) Postoperative vomiting
Fig. 6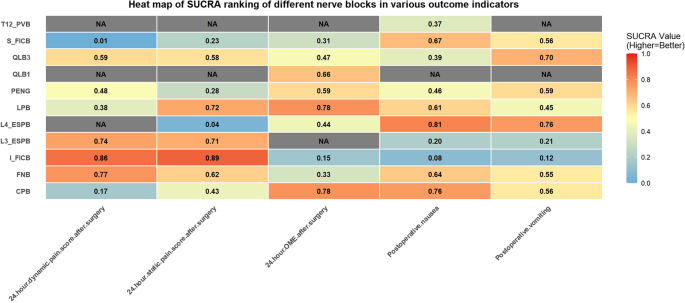 24-hour postoperative static pain score
A total of 10 studies [32,33,34,35, 37, 40, 41, 43,44,45], including 576 subjects, reported this outcome. The interventions included CPB, FNB, I_FICB, L3_ESPB, L4_ESPB, LPB, PENG, QLB3, and S_FICB. The results revealed that, compared with L4_ESPB, CPB (MD = −0.71, 95% CrI: −1.4, −0.02), I_FICB (MD = −1.88, 95% CrI: −3.56, −0.2), and LPB (MD = −1.25, 95% CrI: −2.28, −0.22) were associated with lower 24-hour postoperative static pain scores. Compared with PENG, LPB (MD = −0.66, 95% CrI: −1.12, −0.19) was associated with lower 24-hour postoperative static pain scores (Table 2..). Based on the cumulative probability analysis, I_FICB (SUCRA: 88.90%) ranked first in reducing 24-hour postoperative static pain scores, followed by LPB (SUCRA: 72.46%), while L4_ESPB (SUCRA: 4.37%) ranked last (Tables 3. and 4; Figs. 5 and 6). Subgroup analysis by anesthesia method showed that I_FICB ranked highest for 24-hour static pain scores in the spinal anesthesia group, while further analysis was not possible in the general anesthesia group due to no closed loop. Subgroup analysis by surgical approach showed that CPB ranked highest in the preoperative group, while further analysis was not possible in the postoperative group due to no closed loop (Tables 5, 6 and 7).
Table 5 Details of subgroupTable 6 SUCRA of subgroupTable 7 Global inconsistency tests of subgroup24-hour postoperative OME
A total of 12 studies [13, 30, 32,33,34,35,36, 38, 41,42,43,44], including 710 subjects, reported this outcome. The interventions included CPB, FNB, I_FICB, L4_ESPB, LPB, PENG, QLB1, QLB3, and S_FICB. The results suggested that, compared with CPB, I_FICB (MD = 14.56, 95% CrI: 9.42, 19.65), L4_ESPB (MD = 9.68, 95% CrI: 4.43, 14.91), PENG (MD = 6.22, 95% CrI: 0.37, 12.04), and S_FICB (MD = 11.41, 95% CrI: 6.73, 16.04) were associated with higher 24-hour postoperative opioid consumption. Compared with I_FICB, L4_ESPB (MD = −4.88, 95% CrI: −8.05, −1.7), PENG (MD = −8.34, 95% CrI: −12.44, −4.23), and S_FICB (MD = −3.15, 95% CrI: −5.25, −1.07) were associated with lower 24-hour postoperative opioid consumption. Additionally, PENG (MD = −5.2, 95% CrI: −8.73, −1.65) was associated with a significantly lower 24-hour postoperative opioid consumption than S_FICB (Table 3.). Based on the cumulative probability analysis, LPB (SUCRA: 78.10%) ranked first in reducing the 24-hour postoperative opioid consumption, followed by CPB (SUCRA: 77.96%), while I_FICB (SUCRA: 14.66%) ranked last (Tables 4 and 8.; Figs. 5 and 6). Subgroup analysis based on anesthesia method showed that in the spinal anesthesia group, DIC values were greater than 5, and in the general anesthesia group, network nodes were not connected. Hence, further analysis was not performed. Subgroup analysis based on surgical approach showed that CPB ranked highest in the preoperative group. Furthermore, analysis was not performed in the postoperative group due to no closed loop. (Tables 5, 6 and 7)
Table 8 League table (24-hour OME after surgery)Postoperative nausea
A total of 12 studies [12, 13, 30,31,32, 34, 37,38,39, 43,44,45], including 777 subjects, reported this outcome. The interventions included CPB, FNB, I_FICB, L3_ESPB, L4_ESPB, LPB, PENG, QLB3, S_FICB, and T12_PVB. The results indicated that, compared with I_FICB, CPB (RR = 0.09, 95% CrI: 0.01, 0.91), L4_ESPB (RR = 0.09, 95% CrI: 0.01, 0.59), and S_FICB (RR = 0.16, 95% CrI: 0.02, 0.54) were associated with a lower incidence of postoperative nausea (Table 4). Based on the cumulative probability analysis, L4_ESPB (SUCRA: 81.22%) ranked first in reducing postoperative nausea, followed by CPB (SUCRA: 75.87%), while I_FICB (SUCRA: 8.41%) ranked last (Tables 4 and 9.; Figs. 5 and 6). Subgroup analysis based on anesthesia method showed that L4_ESPB ranked first in the spinal anesthesia group. Network nodes in the general anesthesia group were disconnected, and further analysis was not performed. Subgroup analysis based on surgical approach showed that L4_ESPB ranked first in the preoperative group. Further analysis was not possible in the postoperative group since network nodes were disconnected (Tables 5, 6 and 7).
Table 9 League table (Postoperative nausea/vomiting)Postoperative vomiting
A total of 12 studies [12, 13, 30,31,32, 37, 38, 41,42,43,44,45], including 735 subjects, reported this outcome. The interventions included CPB, FNB, I_FICB, L3_ESPB, L4_ESPB, LPB, PENG, QLB3, and S_FICB. Compared with I_FICB, L4_ESPB (RR = 0.08, 95% CrI: 0, 0.94) and S_FICB (RR = 0.15, 95% CrI: 0.01, 0.98) were associated with a lower incidence of postoperative vomiting (Table 4). Based on the cumulative probability analysis, L4_ESPB (SUCRA: 76.09%) ranked first in reducing postoperative vomiting, followed by QLB3 (SUCRA: 70.06%), while I_FICB (SUCRA: 11.76%) ranked last (Tables 4 and 9.; Figs. 5 and 6). Subgroup analysis based on anesthesia method showed that network nodes in the spinal anesthesia group were not connected, and further analysis was not performed. L4_ESPB ranked first in the general anesthesia group. Subgroup analysis based on surgical approach showed that L4_ESPB ranked first in both the preoperative and postoperative groups (Tables 5, 6 and 7).
Summary of other adverse events
Due to the low incidence of other adverse events or the limited number of included studies, a network meta-analysis could not be performed. Thus, only a descriptive analysis is provided. Eight studies evaluated 24-hour postoperative quadriceps muscle strength. Among these studies, six studies [12, 31, 32, 35, 37, 41] reported no statistically significant differences in the distribution of quadriceps muscle strength rates (such as no block, paresis, and paralysis). Specifically, Bravo et al. [31] reported that the incidence of paralysis was 3.33% and 0% in the LPB group and S_FICB group, respectively. Aliste et al. [32] observed the incidence of paralysis was 0% and 10% in the PENG group and S_FICB group, respectively. Takeda et al. [41] found that the incidence of paralysis was higher in the QLB3 and FNB groups, at 44.44% and 39.29%, respectively. The remaining three studies [12, 35, 37] did not report any cases of paralysis. The other two studies [36, 43] also found no statistically significant differences between groups. Some other postoperative adverse events were also reported, none of which showed statistically significant differences between groups. Abdelaziz et al. [44] observed 1 and 3 cases of hypotension, and 1 and 0 cases of bradycardia in the S_FICB and L4_ESPB groups, respectively; Vamshi et al. [42] reported one case of respiratory depression in both the PENG and S_FICB groups. Urinary retention was reported in four studies. Zheng et al. [43] reported 1 case in the CPB group and 2 cases in the S_FICB group. Flaviano et al. [38] reported 5 cases in both the L4_ESPB and S_FICB groups. Et et al. [37] observed 1 case in the PENG group and none in the QLB3 group. Choi et al. [34] noted 2 cases in the PENG group and 1 case in the S_FICB group. One-year postoperative chronic pain was reported in two studies. Flaviano et al. [38] reported 6 cases in the L4_ESPB group and 3 cases in the S_FICB group, while Wang et al. [12] reported 1 case in the PENG group and 3 cases in the QLB3 group. Additionally, epidural spread was reported in two studies. Biboulet et al. [30] reported 4 cases in the LPB group and none in the FNB group, though statistical analysis of intergroup differences was not provided. Bravo et al. [31] reported 2 cases in the LPB group and none in the S_FICB group, with no statistically significant difference between groups. One study [39] additionally reported that a patient in the QLB3 group was readmitted after discharge due to pulmonary embolism. Seven studies reported the duration of hospital stay. One study [40] reported significantly prolonged hospitalization with LPB compared to PENG (p 31, 32, 34, 36, 39, 43] showed no statistically significant differences between groups.
Convergence diagnostics, sensitivity analysis, publication bias, heterogeneity analysis, and regression analysis
For all outcomes, overall consistency was assessed by comparing the consistency model and the inconsistency model using the DIC. The results indicated favorable consistency across all comparisons. The details are provided in Supplementary Material, Table S6. Convergence diagnostics were performed for the primary outcomes, and all R-hat values were close to 1, indicating model convergence (Supplementary Material, Figure S1-S4). Sensitivity analyses were conducted to evaluate the robustness of the results. After excluding studies that used data transformation, CPB ranked first for OME within 24 h postoperatively. Nonetheless, the number of included articles was small, and thus the results should be cautiously interpreted. No further analyses were performed for dynamic and static pain scores within 24 h postoperatively because network nodes were connected. The details are provided in Supplementary Material, Table S7-8. Publication bias was evaluated for all outcome measures using funnel plots. The funnel plots for all outcomes were symmetric, indicating insignificant publication bias (Fig. 7). Egger’s test also indicated no publication bias for the 24-hour postoperative static pain scores (p = 0.104), 24-hour postoperative dynamic pain scores (p = 0.803), 24-hour postoperative OME (p = 0.884), postoperative nausea (p = 0.397) and postoperative vomiting (p = 0.745) (Supplementary Material, Figure S5-S9). In addition, overall heterogeneity testing was performed for the main outcomes. The global heterogeneity (I2) for 24-hour postoperative static pain scores, 24-hour postoperative dynamic pain scores, 24-hour postoperative OME, postoperative nausea and postoperative vomiting was 63.1%, 92.0%, 79.1%, 54.7%, and 79.1% respectively (Supplementary Material, Figures S10-S14). Moderate heterogeneity was observed for the 24-hour postoperative static pain scores and postoperative nausea, which was acceptable for network meta-analysis. Given the high heterogeneity of 24-hour postoperative static pain scores, 24-hour postoperative OME and postoperative vomiting, regression analyses were conducted using data transformation and anesthesia method as covariates to explore potential sources of heterogeneity (Supplementary Material, Table S9). The analyses showed that none of these covariates accounted for the observed heterogeneity.
Fig. 7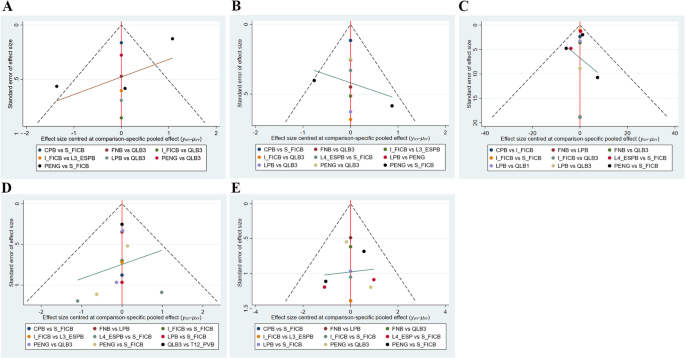
Funnel plot. A 24-hour dynamic pain score after surgery; B 24-hour static pain score after surgery; C 24-hour OME after surgery; D Postoperative nausea; E Postoperative vomiting