Parasite collection and DNA extraction
Parasite samples were collected from Chinese migrant workers who had returned from various African countries (Cameroon, the Central Africa Republic, the Democratic Republic of Congo, Liberia, and Ghana). Patients with malaria symptoms attended the Guangxi Shanglin Hospital from 2016 to 2019 and were diagnosed with malaria through microscopic examination of thick and thin blood smears stained with Giemsa, and then confirmed through nested PCR in the laboratory [13]. These patients who had been to two or more than two countries are excluded. The blood samples were stored at 4 °C at the time of collection and then transported to the laboratory and stored at −20 °C until analysis.
Parasite DNA was extracted from whole blood using the High Pure PCR Template Preparation Kit (Roche) following instructions from the manufacturer. Then, samples were diluted to a concentration of 1 ng/μL using 1 × Tris EDTA Buffer. Confirmation of P. falciparum infection was done using nested PCR targeting the small subunit ribosomal RNA gene as described previously [14].
HRM SNP barcodes and genotype determination
The P. falciparum 24 SNP molecular barcode assay was performed as described by Daniels et al. [7]. Genomic DNA from cloned strains of P. falciparum, including 3D7, Dd2, HB3, 7G8, and K10, were used as references or alternative control samples. The P. falciparum HRM SNP barcode assay was conducted as outlined by Bankole et al. [12]. Briefly, the HRM SNP barcode assay was executed on the ABI QuantStudio6 real-time PCR system. The PCR reaction mixture consisted of 10 μl, containing 1.0 μL of forward primer, 1.0 μL of reverse primer, 2.0 μL of double-distilled water, 4.0 μL of 2.5 × Light Scanner Master mix (BioFire Diagnostics Inc., Salt Lake City, Utah, USA), and 2 μl of DNA template. The PCR cycling conditions were as follows: an initial denaturation step at 95 °C for 2 min, followed by 40 cycles of 94 °C for 30 s, 64 °C for 60 s, and a final HRM cycle comprising 95 °C, 55 °C, and 95 °C, each for 15 s.
To ascertain the genotype of the samples, we analyzed the derivative melting temperature (Tm) curve for each individual measurement. Since P. falciparum exists in a haploid state within peripheral blood, we interpreted the detection of two alleles at any specific location as indicative of a mixed infection, whereas the presence of a single allele was deemed to represent a monoclonal infection. During the execution of the HRM SNP barcode assay on each test sample, reference and alternative allele control samples were assayed to identify the Tm curve of each reference and alternative SNP. By comparing the Tm peak generated by the control sample with that of the test sample, we identified each allele. The derivative Tm curve of each SNP for each sample was utilized to ascertain the genotype of the sample. Monomorphic genotypes were identified by their singular Tm peak and their alignment with a control Tm curve. Conversely, polymorphic genotypes were distinguished by their skewed or shifted Tm curves.
Population genetic analyses
When classifying a parasite sample as polygenomic, Sisya et al. [15] defined a minimum threshold of at least two heterozygous SNPs (N). We determined the complexity of infection (COI) through the COIL web tool [16], and the dispersion pattern of COI among patients offers insights into malaria transmission dynamics and epidemiology. Samples that possess no or, at most, one heterozygous SNP (N) within the barcode were utilized for subsequent analysis. The Mann–Whitney U test was used to measure differences between two groups. Statistical analysis was conducted using GraphPad Prism software version 6.0, and p-values
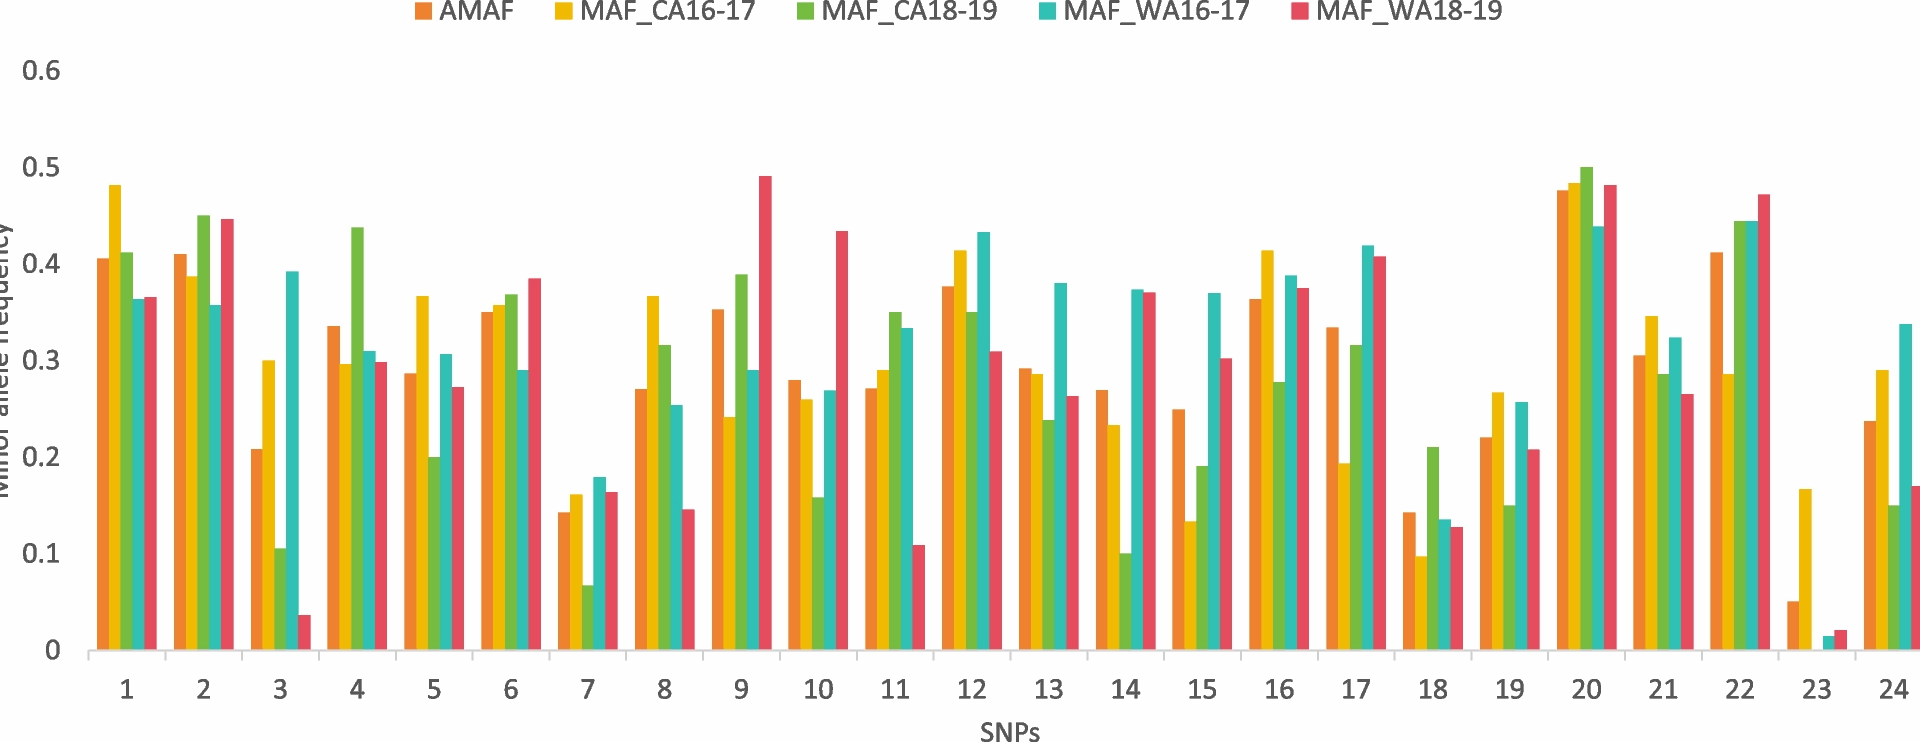
The calculation of Minor Allele Frequency (MAF) and its average follows a methodology outlined by Baniecki et al. [11]. In essence, MAF is derived by assessing the frequency of each allele for each SNP within a given population, based on the allele counts. For polymorphic genotypes, the reference and substitute alleles are assigned values that reflect their contribution, being half of what would be expected in a monotypic genotype. Building upon this, we determine the Average Minor Allele Frequency (AMAF), which is simply the unweighted mean of the MAF values for each SNP across two populations. This approach provides a comprehensive overview of the allelic diversity within and between populations.
We measured nucleotide diversity using the π statistic, which calculates the average pairwise differences among measured SNPs within a population, divided by the total number of SNPs measured. This gives an indication of the genetic variation within the population [11]. Expected heterozygosity (He) was obtained using the POPGENE software Version 1.31.
The genetic divergence among haplotypes was quantified by calculating the pairwise genetic distance (FST). This FST value was derived utilizing the DnaSP Version 5.0 software [17]. Furthermore, the genetic distance between paired populations was determined by employing Slatkin’s linearization method [18]. To reinforce the validity of these FST values, we harnessed the COIL network tools for the generation and subsequent analysis of FST estimates [16].
To compare the genetic architecture of parasite samples sourced from various locations and time points, we conducted a Principal Component Analysis (PCA) utilizing the online platform ClustVis [19]. Phylogenetic analysis was performed on the distance metric 1-PS using the “Ape” R package and visualized using the online tool iTOL [20]. Parasite sample transmission networks were constructed using the online tool StrainHub [21]. The implementation of the transmission network was based on the metric of degree centrality.
The model-based Bayesian method was used to divide individual parasite samples into genetic clusters by the STRUCTURE V2.3.4 software. The number of clusters (K) is determined by simulating K values from 1 to 5, and the posterior probability value of each K is estimated by the Markov Chain Monte Carlo (MCMC) method. The optimal K value is calculated based on Evanno’s ΔK statistical method.