Amazon dieback timing, spatial extent and implications
ESMs indicate high past GPP levels in the Amazon basin, which is the main driver of gross carbon flux into the land ecosystem and an indicator of vegetation activity, with a wide range of GPP estimates in the historical period (Figs. 1 and S1). GISS-E2-R and HadGEM2-ES estimate the highest historical GPP among all ESMs, and higher estimates compared to machine-learning and satellite-based products. Two CMIP5 ESMs, namely BCC-CSM1-1, MPI-ESM-LR and three CMIP6 ESMs, namely ACCESS-ESM1-5, CanESM5 and UKESM1-0-LL, exhibit higher present-day GPP in western Amazonia compared to the eastern region. This pattern is not supported by the machine learning–based FLUXCOM-X product, which is trained on eddy covariance flux tower data31, nor by the satellite-based MUSES product32 (Fig. S1). In some regions, model-derived GPP exceeds observational products by more than 1 kgC m−2 year−1, highlighting substantial biases in both magnitude and spatial patterns. Despite these discrepancies, we do not exclude any ESM from the analysis in order to explore Amazon dieback mechanisms.
Fig. 1: Amazon dieback areas identified in the models.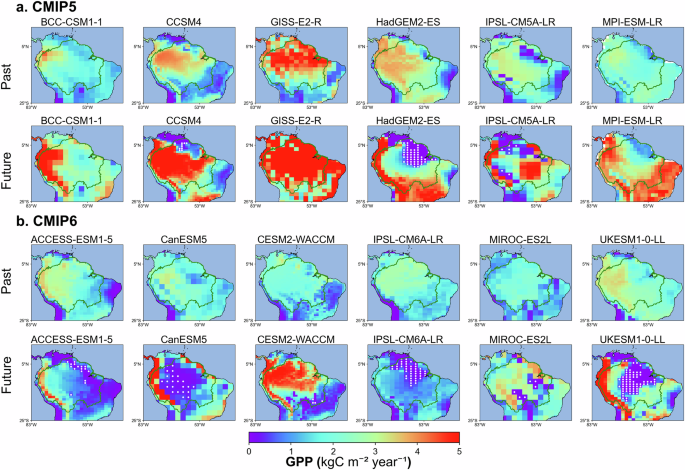
Localised Amazon dieback areas in a CMIP5 and b CMIP6 models. The spatial variation of gross primary production (GPP, kgC m−2 year−1) in the Amazon region in a six CMIP5 and b six CMIP6 models in the past, mean for the 1859–1899 period (first row) and future for the 2259–2299 period (second row). White dots in the future period row indicate dieback grid cells, as defined in this study. The green line indicates the Amazon basin area, as defined by Eva et al.70.
By the end of the 23rd century, nine out of twelve ESMs project substantial reductions in GPP, with identified dieback (Fig. 1). HadGEM2-ES, CanESM5, IPSL-CM6A-LR and UKESM1-0-LL project the largest dieback areas, covering up to two million km2. In contrast, CESM2-WACCM projects the smallest dieback area, less than 0.1 million km2 (Table 2).
Table 2 Area, timing and climatic conditions (mean ± 1 standard deviation, SD) of localised Amazon dieback in CMIP5 and CMIP6 models
The spatial pattern of dieback differs between models (white dots in Fig. 1). HadGEM2-ES and IPSL-CM6A-LR project dieback in the northern Amazon, CanESM5 and UKESM1-0-LL in the central Amazon and CESM2-WACCM and MIROC-ES2L in the eastern Amazon basin. Models with coarser spatial resolution, such as IPSL-CM5A-LR and MIROC-ES2L, show large spatial variations in GPP changes by the end of the 23rd century, with dieback grid cells sometimes adjacent to the grid cells of GPP increase. This pattern likely arises because adjacent grid cells represent different vegetation types (e.g. forest and grassland), each spanning large areas. The different vegetation types, in turn, exhibit varying levels of resilience to changing climatic conditions. This underscores the need for higher-resolution simulations to better capture localised ecological responses and transitions between forest and non-forest ecosystems. Furthermore, although coupled ESMs capture some cross-grid feedbacks through the atmosphere, their ecosystem components typically do not represent lateral ecological interactions between grid cells, meaning that dieback in one location does not directly influence neighbouring cells through ecological interactions. This limitation may lead to an overestimation of the Amazon rainforest’s stability.In our framework, the onset of Amazon dieback is defined as the point when the long-term trend in GPP begins a sustained decline, while completion is marked by GPP falling to around 20% of its peak value (see ‘Methods’). These definitions enable us to capture gradual ecosystem transitions that may be missed by abrupt-shift criteria. Applying this approach, we find that the majority of the models with Amazon dieback (six out of nine) project the onset of Amazon dieback within the 21st century (Figs. 2, S2 and Table 2). On average, Amazon dieback is projected to begin around year 2087 ± 49 and complete by year 2195 ± 25 in the considered grid cells under the RCP8.5 and SSP5-8.5 scenarios. While there is a weak tendency for models with higher equilibrium climate sensitivity (ECS) to simulate earlier Amazon dieback onset (Fig. 2f), this relationship is not consistent across models and is not statistically significant (R = –0.39, p = 0.31). Moreover, models with higher ECS—such as CanESM5 and IPSL-CM5A-LR—substantially overestimate present-day surface air temperature in the dieback-affected region (Tables 1, 2, Fig. 2b, see also black markers in Fig. 3, and refs. 33,34). This warm bias in present-day surface air temperature in the Amazon region reduces confidence in their projection of dieback timing and progression (Fig. 3).
Fig. 2: Mean changes in GPP over the Amazon dieback area by CMIP5 and CMIP6 models in the past and future RCP8.5/SSP5-8.5 scenarios.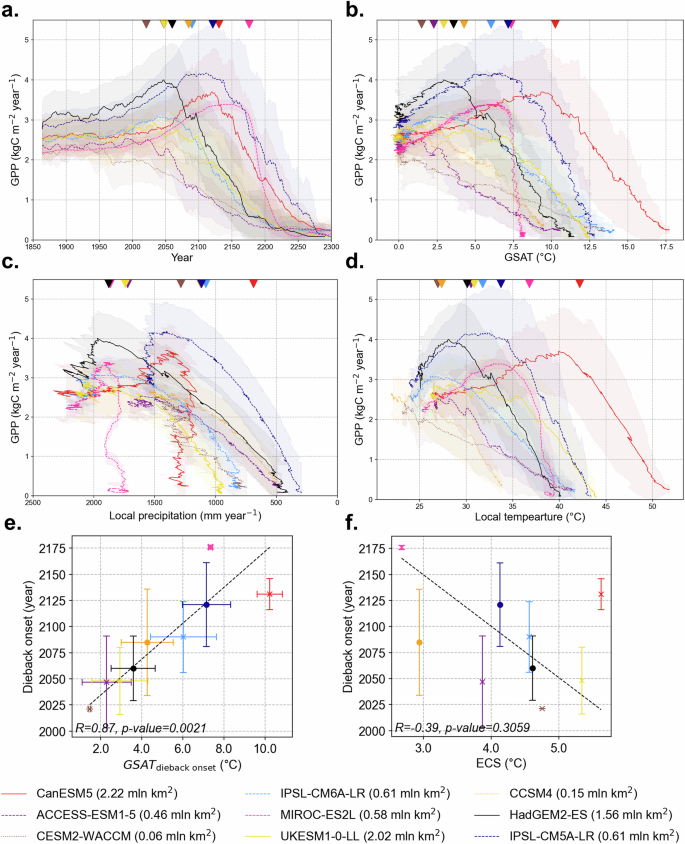
GPP (kgC m−2 year−1), averaged over dieback grid cells, plotted against a year, b global surface air temperature, GSAT change relative to 1859–1899 mean (°C), c precipitation (mm year−1) and d local surface air temperature (°C) averaged over dieback grid cells. Upside-down triangle markers at the top of each panel indicate the Amazon dieback onset year for each model. GPP, GSAT, local precipitation and temperature values are smoothed using a 15-year running mean. The shading corresponds to the inter-grid cell uncertainty range via one SD. The solid, dashed and dotted lines correspond to the models with dieback area over 1.5 million km2, 0.4 million km2 and less, respectively. e, f Show identified dieback onset year ±1 SD plotted against GSAT ± 1 SD at the time of the dieback onset (°C) and Equilibrium climate sensitivity, ECS (°C), respectively.
Fig. 3: Heatmaps of GPP in dieback grid cells plotted against air temperature and precipitation.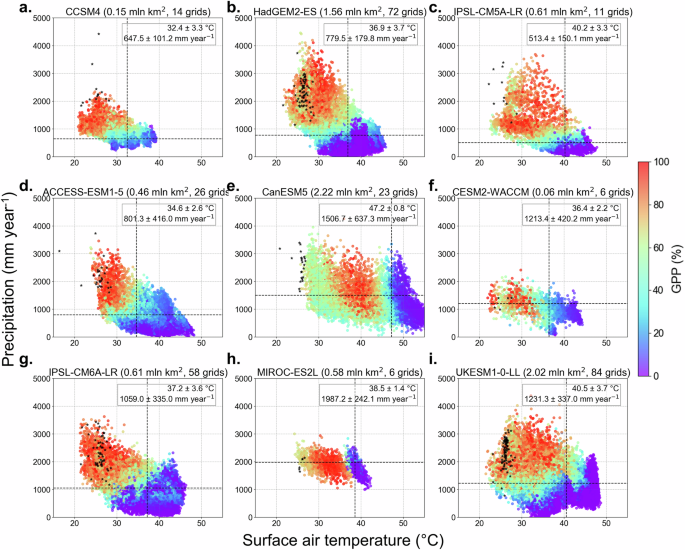
Scatter plots showing the temporal variation in GPP changes (%) relative to the maximum value in each grid cell for the Amazon dieback regions. Data spans from 2000 to 2300 for a–c CMIP5 and d–i CMIP6 models under the historical and future RCP8.5/SSP5-8.5 scenarios. Each dot represents a single grid cell value for a specific year, with colour mapping indicating the flux magnitude. The y-axis shows variation in precipitation (mm year−1) and the x-axis represents surface air temperature (°C). Black markers indicate the 2000–2023 mean precipitation and surface air temperature by ERA5 reanalysis at the dieback grid cells. Note that the number of black dots is different among models because the spatial resolutions of the models are different. Values in the boxes at the top right of each subplot indicate the inter-grid cell mean and uncertainty range via one SD of temperature and precipitation at which GPP values decrease to 20% of their maximum (i.e. timing of dieback occurrence). These thresholds are highlighted by vertical (temperature) and horizontal (precipitation) dashed lines.
There is considerable variation in the timing and duration of dieback among models. Models with smaller dieback areas, such as ACCESS-ESM1-5, CCSM4 and CESM2-WACCM, exhibit a gradual decline in GPP, starting in the early 2000s. In contrast, MIROC-ES2L projects the latest onset of dieback, beginning in the second half of the 22nd century, with the most abrupt GPP decline. This suggests that models with more resilient vegetation or slower carbon cycle feedbacks may delay dieback initiation, leading to a more sudden loss of productivity once thresholds are crossed. In the case of MIROC-ES2L, the delayed onset and rapid GPP decline may reflect such mechanisms, although further analysis of the model structure would be needed to confirm this. Notably, there is less inter-model variability in the timing of dieback completion than in onset, with a strong negative linear relationship between onset year and dieback duration (see Table 2). However, most ESMs project the dieback process to extend over a century (Table 2, Fig. 2a). The slow nature of this transition highlights the gradual degradation of ecosystem resilience, where declining GPP reflects the progressive weakening of vegetation productivity rather than an abrupt collapse. The interaction of climate-driven stressors, including increased drought frequency and rising temperatures, with land-use changes (LUC), discussed later, further compounds the ecosystem’s vulnerability.
The relationship between dieback onset and an increase in global surface air temperature (GSAT) relative to preindustrial period (1859–1899 mean) varies among models, with a range from 1.5 °C in CESM2-WACCM to 10.2 °C in CanESM5, and the inter-model mean value of 5.0° ± 2.9 °C (Table 2, Fig. 2b). On average, models that sustain higher Amazon GPP under moderate warming tend to experience more abrupt GPP losses once higher GSAT levels are reached. The timing of dieback onset shows a strong linear relationship with GSAT, with models that delay dieback exhibiting higher GSAT thresholds (Fig. 2e and Table 2). This suggests that models with more resilient Amazon vegetation maintain GPP for longer but experience more abrupt losses at higher warming levels. The inter-model consistency in this relationship, despite differences in spatial dieback patterns, highlights the role of vegetation endurance in shaping dieback dynamics.
Local climatic conditions, such as surface temperature and precipitation, play a key role in dieback progression (Fig. 2c, d, Fig. 3). Some models exhibit clear temperature thresholds, beyond which GPP decline accelerates sharply (Fig. 2d). Others display nonlinear responses to decreasing precipitation, with models such as CanESM5 and MIROC-ES2L, experiencing substantial GPP reductions even under relatively high precipitation levels (Fig. 2c). To more formally assess the relative influence of temperature and precipitation, we performed a standardised (z-scored) logistic regression analysis (see ‘Methods’ and Table S1). The results show that temperature is the dominant driver of dieback in most models, although precipitation exerts a strong influence in some, particularly among the CMIP5 ensemble. The contributions of temperature and precipitation are comparable for ACCESS-ESM1-5, IPSL-CM6A-LR and UKESM1-0-LL. These findings support the interpretation of temperature and precipitation thresholds while also accounting for their covariation. On average, annual local surface air temperature above 32.2 ± 4.8 °C and precipitation below 1394.3 ± 306.0 mm year−1 are associated with the onset of the Amazon dieback.
Across models, the Amazon dieback region is projected to shift from a carbon sink to a temporary carbon source of up to 0.5 GtC year−1 during the 22nd century (Fig. S3l). Although this source phase is transient, it has notable regional climate implications—including altered precipitation and warming feedbacks—that underscore the complex interplay between climate variables and carbon cycle dynamics, with the potential to amplify global climate change (Figs. S3 and S4). By the 23rd century, all models project a return to near-neutral or weak source conditions in the region (Fig. S3k).
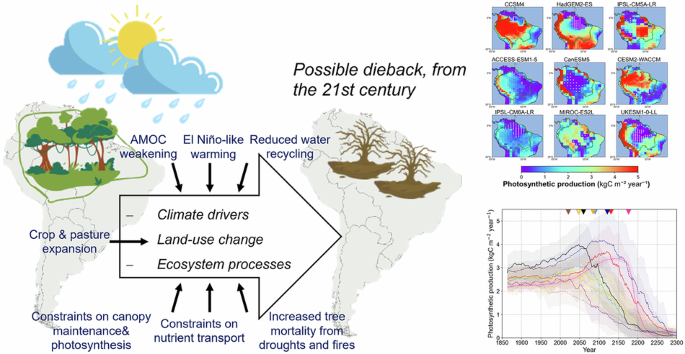
Amazon dieback mechanisms: climate
Previous studies have identified prolonged and intensified dry seasons, which reduce photosynthesis and increase tree mortality, as well as deforestation, as the primary drivers of potential Amazon dieback2,11,18,19,20,21,22. Under the considered RCP8.5 and SSP5-8.5 scenarios, changes in forest productivity and biomass strongly depend on variations in precipitation and surface air temperature within the dieback grid cells (Figs. 3 and S5, see also Table S1). CanESM5 and MIROC-ES2L show a stronger sensitivity of GPP to rising temperatures, while other models show a dependence on the combined effects of rising temperatures and decreasing precipitation. These results align with previous findings that Amazon dieback is primarily driven by compound stressors, where drought and heat act synergistically to reduce photosynthesis and increase ecosystem mortality10,11,14,18.
By the end of the 21st century, CanESM5 simulates the highest global land temperatures, leading to a large Amazon dieback area due to surface temperature increases (Fig. S3a). Localised dieback in this model coincides with mean annual surface air temperatures reaching 42.2 ± 1.5 °C in affected regions (Table 2, Fig. S3). Similarly, MIROC-ES2L projects localised dieback associated with mean annual surface air temperatures reaching 36.8 ± 0.6 °C, but this occurs later due to its lower global temperature trajectory. Among models, those with higher ECS tend to show earlier dieback onset, likely because they reach critical warming thresholds more quickly under the same radiative forcing, which may help explain the earlier dieback onset observed in some cases (Fig. 2f). However, this tendency is not robust across the ensemble, and the precise timing and extent of dieback is ultimately governed by differences in land surface and carbon cycle processes—including CO2 fertilisation, vegetation sensitivity to temperature and water stress and mortality formulations—which play a decisive role in determining forest resilience.
UKESM1-0-LL, an ESM that includes dynamic vegetation in its land module, simulates high surface air temperatures in dieback regions (Fig. 3, Table S1). However, unlike CanESM5 and MIROC-ES2L, UKESM1-0-LL exhibits a more combined dependency on both temperature and precipitation decline. The interaction between temperature-driven and moisture-driven stress appears to shift with climate conditions: at higher temperatures (combined with higher precipitation levels), GPP reduction is primarily temperature-driven, whereas at lower temperature ranges, dieback is influenced by both warming and declining precipitation (Fig. 3i). This suggests a nonlinear response, where UKESM1-0-LL’s dynamic vegetation allows for some initial resilience under moderate warming, but once critical temperature thresholds are reached, GPP declines more abruptly. This contrasts with models showing an early, gradual decline due to reduced precipitation (e.g. ACCESS-ESM1-5) or a delayed temperature-driven dieback (e.g. CanESM5, MIROC-ES2L).
The differences between models in temperature and precipitation thresholds for dieback imply that the Amazon’s resilience to climate change is still uncertain. Models that simulate dieback under lower precipitation but moderate warming (e.g. CCSM4, ACCESS-ESM1-5, IPSL-CM5A-LR and IPSL-CM6A-LR) suggest that the drought-induced tipping point could emerge before the temperature reaches extreme values. Conversely, models where dieback is primarily temperature-driven (e.g. CanESM5, MIROC-ES2L) suggest that rainforest loss accelerates once a critical heat threshold is crossed (Table S1). These differences reinforce the need for more observational constraints on the physiological responses of Amazon vegetation to heat and drought stress35,36.
Although global mean land precipitation is projected to increase with warming, a decrease is projected for the Amazon basin (Fig. S3d, e, refs. 28,35). In most considered models (except for CanESM5 and MIROC-ES2L), the precipitation decrease is more pronounced in the grid cells experiencing dieback, with annual precipitation falling below 1000 mm year−1 (Table 2, Fig. S3d–f). The precipitation reductions are likely triggered by large-scale atmospheric circulation changes, including a shift in the ITCZ27,28,35 over the Atlantic Ocean, as well as El Niño-like warming pattern23. In the long term, the warming-induced weakening of the AMOC is expected to drive dynamic shifts in the Atlantic ITCZ27,35,37,38. The projected AMOC decline during the 21st–22nd centuries (Fig. S6a, b) coincides with a southward ITCZ shift in most models (except HadGEM2-ES, BCC-CSM1-1 and UKESM1-0-LL). This shift occurs either concurrently with AMOC weakening (e.g. CESM2-WACCM, IPSL-CM6A-LR) or with some delay (Figs. S6, S7).
The southward shift of the ITCZ is expected to increase precipitation over the southern Amazon rainforest and northeastern Brazil27,39. However, this pattern is observed in only a few models, including IPSL-CM5A-LR (increased precipitation in northeastern Brazil), and IPSL-CM6A-LR and CCSM4 (increased precipitation over the southern Amazon rainforest). In contrast, six models with identified dieback project increased precipitation in the agricultural regions of southeastern Brazil and Argentina (Fig. S4a). This redistribution of precipitation may negatively impact the rainforest while benefiting agricultural productivity in those areas. We suggest that under high CO2 concentration scenarios, the increasing CO2 fertilisation effect reduces evapotranspiration, which in turn reduces water recycling and amplifies the decline in precipitation over the Amazon basin11,19. This may also contribute to local warming and vegetation stress. While CO2 fertilisation can help maintain LAI and partially sustain transpiration, the overall effect reinforces a feedback loop between declining vegetation function and regional hydroclimate (Fig. S4). Additionally, El Niño-like climate conditions, measured as the SST gradient between the eastern and western Pacific, become dominant in all ESMs from the 21st to the 23rd century (Fig. S6c). The projected ITCZ changes result in a hotter and drier northern Amazon rainforest, while the concurrent El Niño-like warming leads to drier and hotter conditions throughout the entire Amazon region (Fig S4).
Changes in Köppen-Geiger (KG) climate classifications provide a basis to evaluate whether the Amazon basin’s climate may become unsuitable for supporting tropical forest ecosystems (Fig. 4). While the present-day Amazon is predominantly classified as tropical rainforest, several models already simulate extensive areas as tropical savanna by the year 2000 (shown in light blue in Fig. 4), indicating a likely dry bias in their baseline climate (compare with Fig. 1a of ref. 40). This may reflect overestimated dry season length or underestimated precipitation. Despite these biases, most models project a clear shift from tropical to arid climate categories (shown in red in Fig. 4) in the 22nd and 23rd centuries, particularly in regions experiencing localised dieback. This trend is less pronounced in MIROC-ES2L and UKESM1-0-LL.
Fig. 4: Spatiotemporal change of Köppen-Geiger climate classes in the northern South America.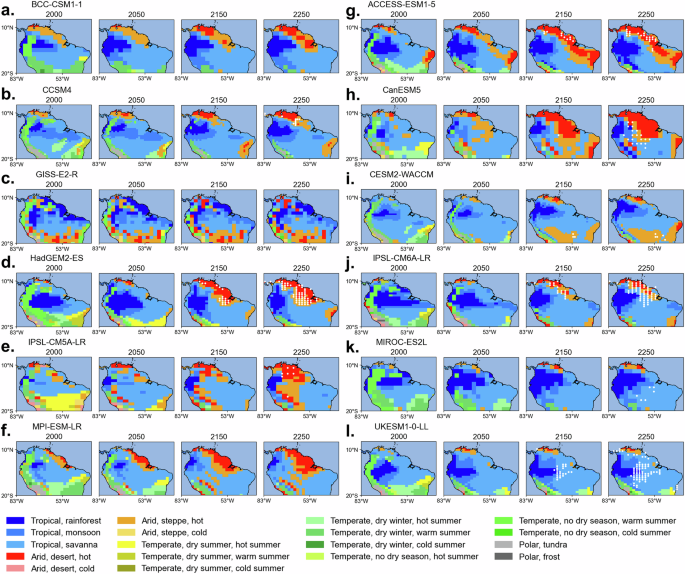
Spatial variation of Köppen-Geiger climate classes by a–f CMIP5 and g–l CMIP6 ESMs under RCP8.5 and SSP5-8.5 scenarios, averaged (using 50-year spans) around years 2000, 2050, 2150 and 2250. White dots indicate dieback grid cells, as defined in this study, but for each year.
In the KG system, arid climates are defined as those where annual precipitation falls below a temperature-dependent threshold (with higher precipitation demand in warmer regions), reflecting insufficient moisture to support dense vegetation40. These are further classified into hot deserts and hot steppes based on the degree of aridity and whether the mean annual temperature exceeds 18 °C. The KG classification defines tropical climates as having no month with an average temperature below 18 °C but does not impose an upper limit. As a result, even under extreme warming, the Amazon could remain classified as tropical, despite conditions becoming unsuitable for rainforest vegetation. In MIROC-ES2L, dieback occurs later and is strongly temperature-driven, with limited dependence on precipitation changes. In contrast, UKESM1-0-LL shows a more complex response, where dieback is initially influenced by both temperature and precipitation, but at higher temperatures, the dependency shifts toward temperature-driven stress. This aligns with the behaviour observed in Fig. 3, where UKESM1-0-LL’s dieback thresholds show a division between moderate-temperature precipitation dependence and extreme-temperature dominance by heat stress. Despite these changes, most of the Amazon dieback grid cells in both MIROC-ES2L and UKESM1-0-LL remain classified as tropical (but not ‘rainforest’) in the KG system. We suggest that high temperatures projected by these models at the timing of dieback exceed physiological limits for rainforest vegetation, leading to ecosystem degradation even though the region does not transition to an arid classification. This highlights a limitation of the KG system in ecosystem impact studies, as its coarse climate categories may fail to capture critical ecological thresholds and vegetation collapse.
CanESM5 exhibits an earlier shift (as early as the 21st century) toward a savanna-like ecosystem despite its GPP decline being strongly linked to temperature rise. This may be influenced by the way vegetation mortality is represented in CanESM5’s vegetation module, where ecosystem responses to low precipitation appear to be less pronounced. As a result, the forest persists under relatively dry conditions, but experiences more abrupt dieback once extreme temperatures are reached.
The KG classification can provide useful indications of climate shifts associated with dieback. In most models, the shift towards more arid and hot conditions in the areas of dieback matches the areas of GPP decrease (Figs. 3 and 4). Thus, while KG classification does not explicitly account for vegetation thresholds, its projected shifts may still offer insight into regions where long-term climatic conditions become less suitable for rainforest persistence.
Amazon dieback mechanisms: land-use change
Under the RCP8.5 and SSP5-8.5 scenarios, LUC emissions peak by the end of the 21st century, with most changes occurring in the periphery of the Amazon basin and land cover is assumed to remain constant beyond 210041,42 (Figs. S8, S9). We investigate the LUC impact on the Amazon dieback by analysing the dominant (as in year 2100) land cover types at the dieback grid cells (Figs. S10, S11).
In the CESM2-WACCM, which has the smallest total dieback area in the southeastern Amazon rainforest, dieback should be primarily driven by the LUC, i.e. conversion of primary vegetation to pastures and crops, as prescribed by LUH2 because the timing of dieback coincides with that of the crop expansion (Figs. 2, 5 and S10, S12). All grid cells identified as experiencing dieback correspond to those designated as pasture or cropland by 2100, with substantial land-use transformation beginning well before the dieback onset and continuing through 2100 (Fig. S10). Notably, these grid cells originally represented primary vegetation in the 19th century and were subsequently converted to other land cover types—indicative of land-use disturbance—throughout the historical period and into the future up to 2100, in accordance with the SSP5-8.5 scenario (Fig. S11). Grid-level analysis of model-reported crop fraction confirms this pattern: at least two of the six dieback-affected grid cells show crop fractions exceeding 40% (Fig. S12), suggesting LUC is a direct driver. However, GPP in these grids continues to decline gradually even after the land-use transition is complete, indicating that climate stress may also contribute.
Fig. 5: Time series of surface climate and carbon cycle changes in the dieback grid cells.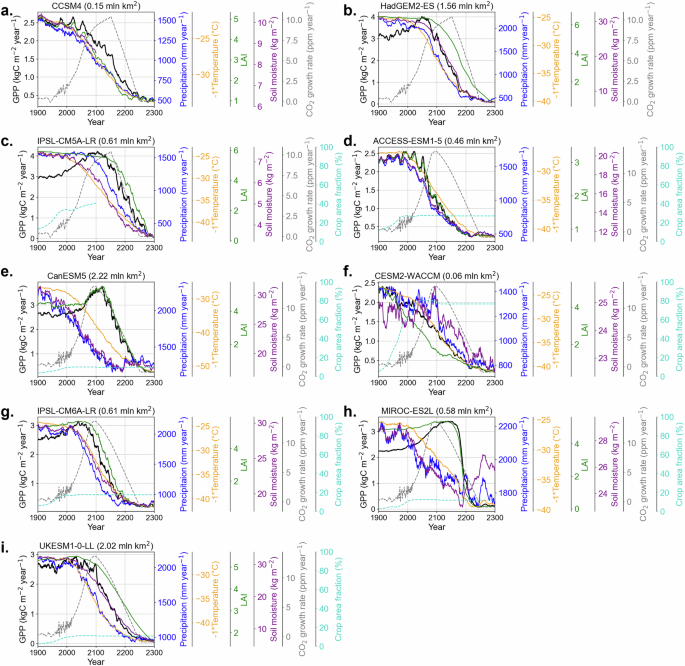
The temporal variation of changes in GPP (kgC m−2 year−1, black), precipitation (mm year−1, blue), −1 × surface air temperature (°C, orange), leaf area index, LAI (unitless, green), soil moisture in upper soil column (kg m−2, purple), crop area fraction (%, cyan) averaged over dieback grid cells, and global CO2 growth rate (ppm year−1, grey). Values are smoothed using a 15-year running mean. The data spans from 1900 to 2300 for a–c CMIP5 and d–i CMIP6 models under the historical and future RCP8.5/SSP5-8.5 scenarios. Soil moisture data beyond 2100 are not available for CCSM4, and, thus, are not shown.
Similarly, in all other models, secondary vegetation, pastures and crops increase at the expense of primary vegetation prior to the onset of dieback. In 1850, over 90% of the vegetation in the identified dieback grid cells was primary (Table S2). The fraction of primary vegetation declines by more than 50% of the dieback grid cells’ area by 2100 in four out of nine ESMs. This pattern suggests that even relatively moderate LUC activities, largely mitigated by forest regrowth within the 21st century43, can contribute to the dieback in the long term.
However, in several models (e.g. CanESM5, IPSL-CM6A-LR and UKESM1-0-LL), dieback predominantly occurs in grid cells dominated by primary vegetation (over 70% in 2100, Table S2), indicating minimal contributions from LUC. This implies that climate-driven dieback is possible even in undisturbed forest areas.
While projections by some models suggest that LUC can accelerate dieback, other models suggest the dieback can occur even in native vegetation grid cells, independent of deforestation. The long-term GPP decline in many grid cells, continuing well after major land-use transitions, further suggests a role for gradual climate stress (Figs. 5 and S12). Thus, addressing both deforestation and climate change issues is critical for preserving the Amazon rainforest4,10,13,18. Flores et al.18 suggest a safe boundary of 10% deforestation of the original forest, beyond which the risk of large-scale forest loss and ecosystem transition substantially increases. Further analysis is needed to quantify the extent to which LUC increases the risk of dieback.
Amazon dieback mechanisms: ecosystem
Changes in temperature and precipitation play a crucial role in regulating tropical GPP: cooler and wetter conditions generally increase ecosystem carbon uptake, while hotter and drier conditions decrease it. GPP also responds dynamically to other factors, such as light availability, nutrient levels (such as nitrogen and phosphorus) and ambient CO2 concentrations25,44,45,46. These environmental shifts influence the interplay between photosynthetic activity and canopy leaf area, which are key determinants of ecosystem-level GPP dynamics in tropical regions. To examine the mechanisms of GPP decrease in the Amazon dieback areas, we analysed the time series of GPP, alongside LAI, temperature and precipitation, averaged over the dieback grid cells (Fig. 5, see also Fig. S13 for non-dieback grid cells). In CCSM4, CESM2-WACCM and MIROC-ES2L, LAI decreases either simultaneously with or before the GPP decreases, suggesting that constraints on canopy maintenance and leaf growth contribute to the dieback (Fig. 5). In other models, the decrease in LAI occurs after the decrease in GPP, suggesting that reduced leaf-level photosynthetic activity is the primary driver of dieback.
The temperature increase and precipitation decrease either coincide or precede the GPP drop in all considered models. In IPSL-CM5A-LR, IPSL-CM6A-LR, CanESM5 and MIROC-ES2L, GPP continues to increase for some time despite the temperature and precipitation shifts (due to the CO2 fertilisation effect) but drops later. In all ESMs, dieback occurs when the mean surface air temperature of the grid cell exceeds 25 °C (Table 2). The relationship between photosynthesis and temperature follows a response curve, in which photosynthetic rates increase with temperature up to an optimal point46. However, beyond this temperature optimum, the efficiency of photosynthesis declines, as elevated temperatures disrupt key enzymatic and metabolic functions and enhance photorespiration, which reduces the overall carbon fixation efficiency46. Many models are parametrised to assume an optimal temperature for C3 tropical species around 25 to 30 °C, with a maximum tolerance near 45 °C25,47. In models where temperature is the primary driver of dieback, such as CanESM5 and MIROC-ES2L, the local surface temperature at dieback onset closely approaches this threshold (CanESM5: 42.2 ± 1.5 °C, MIROC-ES2L: 36.8 ± 0.6 °C; see Table 2). This suggests that localised dieback in these models is primarily driven by the direct impact of high temperatures on photosynthesis. Additionally, plant respiration increases exponentially with temperature, contributing to the dieback (see Fig. 3 of ref. 46). A comparison of adjacent grid cells with and without identified dieback in MIROC-ES2L and other ESMs reveals slightly higher temperatures in dieback grid cells (Fig. S13). This suggests that even small temperature differences may lead to the exceedance of the tolerance threshold, triggering the tropical forest dieback.
A closer examination of these adjacent grid cells offers deeper insight into the mechanisms contributing to Amazon dieback (Fig. S13). In all ESMs, dieback grid cells exhibit slightly higher temperatures and lower precipitation, conditions that weaken forest resilience. In contrast, non-dieback grid cells sustain higher GPP, either increasing or showing only minor declines (HadGEM2-ES, CanESM5, MIROC-ES2L, IPSL-CM5A-LR, CESM2-WACCM). Even in models where GPP declines (CCSM4, ACCESS-ESM1-5, IPSL-CM6A-LR and UKESM1-0-LL), it remains above the 80% threshold used to define dieback. We speculate that longer simulation periods beyond the 23rd century may reveal more extensive Amazon dieback.
CO2 modulates tolerance to high temperatures by suppressing photorespiration and enhancing tree water-use efficiency18,46,48,49. Under the RCP8.5 and SSP5-8.5 scenarios, global CO2 concentrations are projected to increase until the mid-23rd century; however, the CO2 growth slows by the late 21st to early 22nd century (Figs. 5 and S14). This slowdown may weaken its mitigating effect on photorespiration, reducing rainforest resilience and potentially contributing to dieback. Rising temperatures and declining precipitation further reduce soil moisture, limiting water availability for photosynthesis46,50,51,52. Soil moisture also regulates nutrient transport, a key factor in models with nitrogen and phosphorus limitations53. An additional source of uncertainty is the treatment of nutrient limitation. Models that include interactive nitrogen cycles simulate lower carbon uptake under elevated CO2 due to nutrient constraints on plant growth54. Although tropical forests are often considered phosphorus-limited (tropical forests are characterised by low P, which is essential for CO2 fertilisation54), nitrogen also plays a key role in regulating productivity, particularly in degraded or drier forest regions55. In our ensemble, all non-dieback models lack a nitrogen cycle. Among dieback models, three (CanESM5, HadGEM2-ES, IPSL-CM5A-LR) also lack nitrogen limitation, but all have high ECS values (>4), which amplify both warming and carbon cycle responses. The absence of nitrogen constraints in many models likely contributes to an overestimation of CO2 fertilisation effects and forest resilience, reinforcing the need for more comprehensive treatment of nutrient feedbacks in ESMs.
Temperature and precipitation extremes likely contribute to Amazon dieback through increased tree mortality. Observational studies show that climatic thresholds for tree mortality vary between species56,57, making tree mortality one of the most uncertain processes in biosphere models. Models include soil moisture and humidity thresholds for drought-induced mortality, but these are often poorly documented. The discrepancies in precipitation thresholds for tree mortality may partly explain inter-model differences in Amazon GPP decline (Figs. 2d and 3). Additionally, the fire impacts remain a major uncertainty. The limited number and inconsistencies of fire modules26,58 (Table 1) prevent a full quantitative assessment of fire impacts. Thus, fire impacts are likely underestimated in the considered CMIP5 and CMIP6 models. ESMs that include fire modules (CCSM4, IPSL-CM5A-LR and MPI-ESM-LR) project a continuous increase in fire emissions over the Amazon basin, with peak emissions extending beyond the 21st century (Fig. S9). Tropical fire risk is driven by a complex interplay of natural and anthropogenic factors and is exacerbated by the rising temperatures and decreasing precipitation (i.e. fire weather). As rising temperatures and decreasing precipitation intensify fire weather, the risk of large-scale forest loss is expected to grow beyond the 21st century. Recent studies highlight that fire–vegetation feedbacks can reduce ecosystem resilience and promote persistent forest degradation26,59,60. Repeated fires can lead to grass invasion, increased flammability and suppressed canopy recovery, particularly at the forest–savanna transition. These dynamics align with tipping point theory, where internal feedbacks sustain alternative ecological states61. The Global Tipping Points Report (2023) further emphasises that current models may underrepresent fire as a key accelerator of Amazon dieback6.
Three models include dynamic vegetation components (Table 1). Of these, UKESM1-0-LL, which projects substantial temperature increases and decreases in precipitation, and HadGEM2-ES, with a large decrease in precipitation, both show extensive dieback. Another model with a dynamic vegetation component, MPI-ESM-LR, does not predict dieback but simulates GPP decrease (Fig. 1). Dynamic vegetation enables species adaptation to warmer, drier conditions, but under severe climate change, plant functional types may not adjust quickly enough to prevent large-scale dieback.
Amazon dieback absence in some models
Three CMIP5 models—BCC-CSM1-1, GISS-E2-R and MPI-ESM-LR—do not project Amazon dieback. Notably, GISS-E2-R estimates the highest historical GPP, while BCC-CSM1-1 and GISS-E2-R project future GPP increases across much of the region. MPI-ESM-LR, on the other hand, simulates a moderate GPP decline in the northeastern Amazon, but this remains below the 80% decrease threshold used to define dieback in this study.
These models predict future GSAT changes ranging from the lowest values to near the inter-model mean, with moderate to negligible reductions in annual precipitation over the Amazon (Fig. S3). GISS-E2-R has the smallest GSAT increase by the late 21st century, alongside slight precipitation increases and a substantial increase in mean Amazon GPP. However, two other models (BCC-CSM1-1 and MPI-ESM-LR) also do not exhibit dieback, despite having global and Amazon temperature trends similar to models that do. This suggests that differences in carbon cycle parameterisations likely play a key role in the absence of dieback (Fig. S3).
To explore this, we analysed GPP, local surface temperature and precipitation changes in model grid cells where GPP increases by no more than 20% in the Amazon basin by the late 23rd century relative to the preindustrial period (Fig. S15). MPI-ESM-LR shows a moderate GPP decline despite an increased temperature (>40 °C) and reduced precipitation (−1), but this does not meet the dieback criteria. GISS-E2-R shows only a slight GPP decrease in response to moderate warming (>32 °C) and severe precipitation loss (−1). Since these climatic conditions overlap with those in models that do project dieback, we suggest that these ESMs employ a more relaxed carbon cycle parameterisation. We encourage future studies to investigate this in more detail. In contrast, BCC-CSM1-1 projects increased precipitation in these grid cells, likely due to a northward ITCZ shift (Figs. S3a, S7), creating more humid conditions that prevent dieback.