Sign up for the Starts With a Bang newsletter
Travel the universe with Dr. Ethan Siegel as he answers the biggest questions of all.
When it comes to science in general, and physics in particular, we don’t just want to know what’s going to happen under a given set of circumstances. We also want to know the answer to the key question of, “how much,” “how many,” or “in what amount,” when it comes to our answers. Being quantitative, and answering questions of amounts and timescales, not merely qualitative, is what separates a successful physical theory from one that must be discarded. In the expanding Universe, this is more important than ever, as questions of what we expect to form, when, and in what quantities, are essential for testing whether our theories of the Universe actually match up with our observed reality.
Clearly, we live in a Universe where stars came into existence long ago: back in the first few hundred million years of cosmic history. But is what we see compatible with what physics predicts when we take the expanding, accelerating Universe into account? That’s the big inquiry put forth by Patreon supporter Jeff Bonwick, who wants to know:
“Star formation makes qualitative sense: gas, gravity, time. In a static universe, it’s clearly inevitable. But the quantitative side seems really surprising: with a density on the order of one proton per cubic meter, and accelerating expansion, I’d expect the universe to have been born at “escape velocity”, i.e. that no star would ever form because everything was flying apart faster than gravity could pull it together… [so] how do we ever get enough matter density for a star to form?”
I’ll try my best to walk the tightrope in taking this one on: to share the results of quantitative work with you, but without making you go through the math or the equations yourself. Let’s dive in!

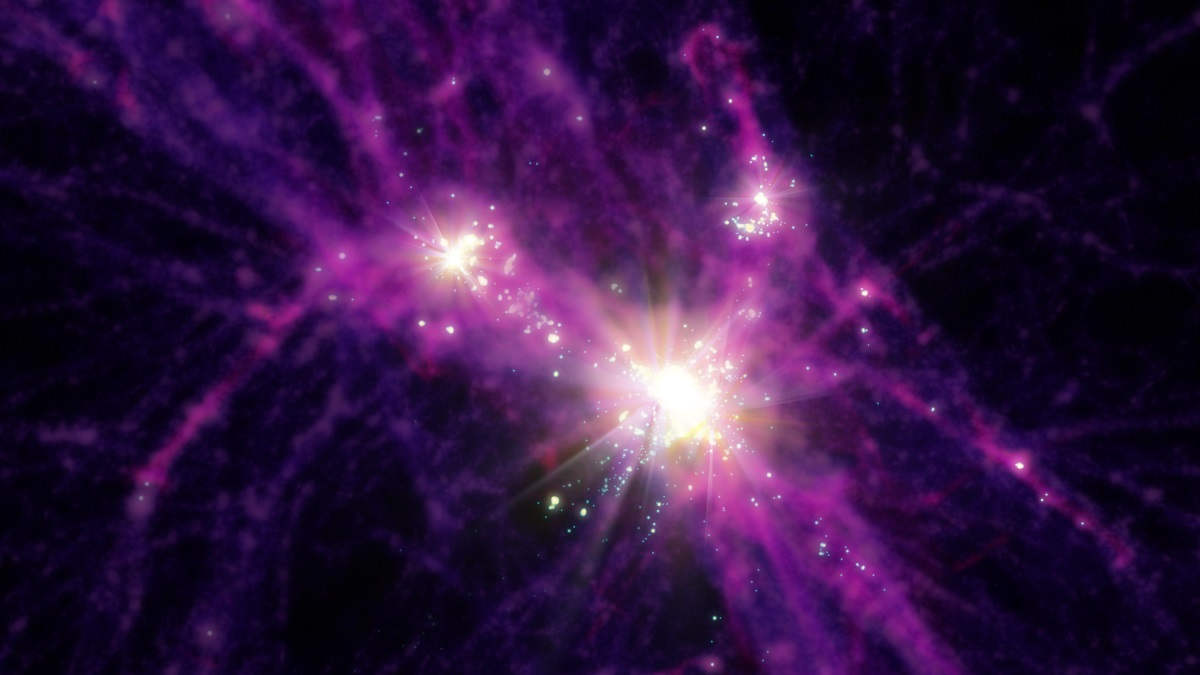
This image shows a two-dimensional projection of the cosmic web, stretching for approximately the size of the observable Universe (~46 billion light-years) in all directions. On scales smaller than about a billion light-years, the Universe is tremendously non-uniform. On the largest of cosmic scales, however, all regions are relatively equivalent, where if you sample different regions that are 10 billion light-years or more on a side, you’ll find that all regions have the same density to within 99.99%+ precision.
Credit: Millennium XXL simulation; modified by E. Siegel
The first thing we have to understand is that, on the largest of cosmic scales, the Universe itself is actually pretty smooth. Despite the fact that we have an enormous amount of structure in our Universe:
- rocky and icy bodies on small scales,
- many of which orbit giant planets, brown dwarfs, stars, and stellar remnants,
- which themselves are clustered into galaxies containing millions, billions, or trillions of these objects,
- where the galaxies themselves are distributed throughout a grand cosmic network of filaments, galaxy groups, and massive galaxy clusters,
we should understand both that these structures only appear on small-ish cosmic scales (scales smaller than a couple of billion light-years) and that they only represent large density fluctuations today, after millions and billions of years of cosmic evolution.
On the largest of cosmic scales, such as if you took a “dipper” that was ten or twenty billion light-years across and dipped it into a random place within the Universe, we find that all regions within the Universe are very similar. If you dip your dipper into one place as opposed to any other, you’d find that the densities of those regions were 99.997% similar, with only about a 0.003% difference in density, on average. Similarly, those are the approximate density differences that we estimate the Universe was “born” with back at the start of the hot Big Bang: differences of about the 0.003% (or 1-part-in-30,000) level. In fact, our theory of cosmic inflation, which provides the seeds of structure in the Universe that existed at the start of the hot Big Bang, is consistent with exactly that value.
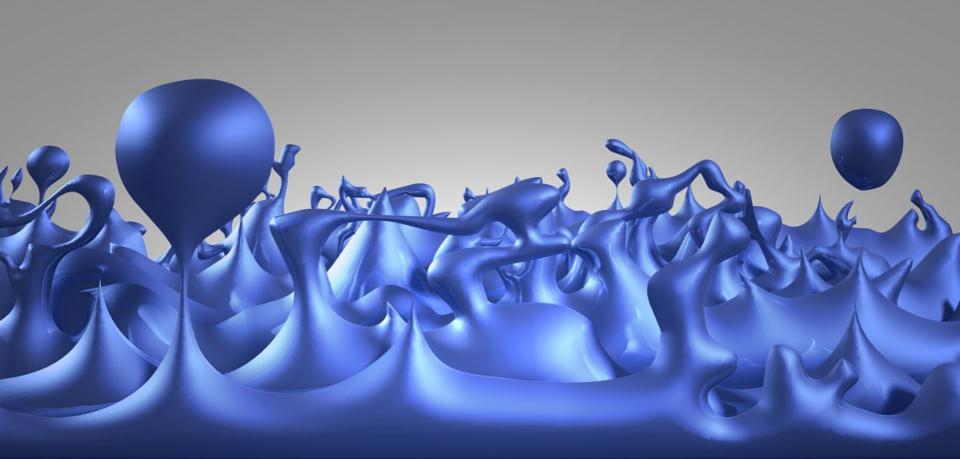
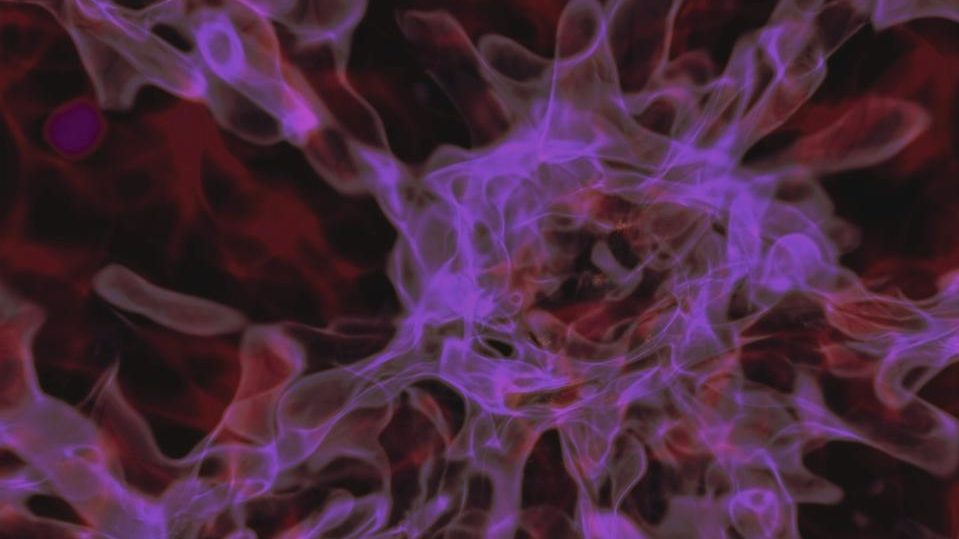
An illustration of the early Universe as consisting of quantum foam, where quantum fluctuations are large, varied, and important on the smallest of scales. Positive and negative energy fluctuations can connect to one another on these scales, creating minuscule, quantum wormholes. During cosmic inflation, these fluctuations are large in magnitude, and the exponential expansion of space can stretch these fluctuations to large, even cosmic scales.
Credit: NASA/CXC/M. Weiss
Let’s set this up, so you can understand how it happens. At all times, throughout the Universe, space isn’t just a constant, unchanging entity: a static sea, if you will. Instead, within space, and particularly important on small scales and on short timescales, there are fluctuations inherent to that space itself: quantum fluctuations. While there are many problems with the all-too-common analogy of “particle-antiparticle pairs popping in-and-out of existence,” the fluctuations in space — particularly in the energy present within that space at any given time — are very real.
During inflation, it isn’t matter or radiation that dominates the cosmic energy density, but rather the energy inherent to space itself. We sometimes think of this as field energy (due to the field causing inflation), as the zero-point energy of space itself (which is large, and much greater than zero, during inflation), or as being akin to a large cosmological constant. However, inflation can’t be truly approximated by a constant, as the magnitude of these fluctuations depends on the properties of inflation at any given moment, and those properties change as inflation nears its end. Those fluctuations, which get stretched across all cosmic scales, then imprint themselves into the overall cosmic energy density — at all locations in space — when inflation comes to an end, that field energy gets converted into matter, antimatter, and radiation, and the hot Big Bang begins.
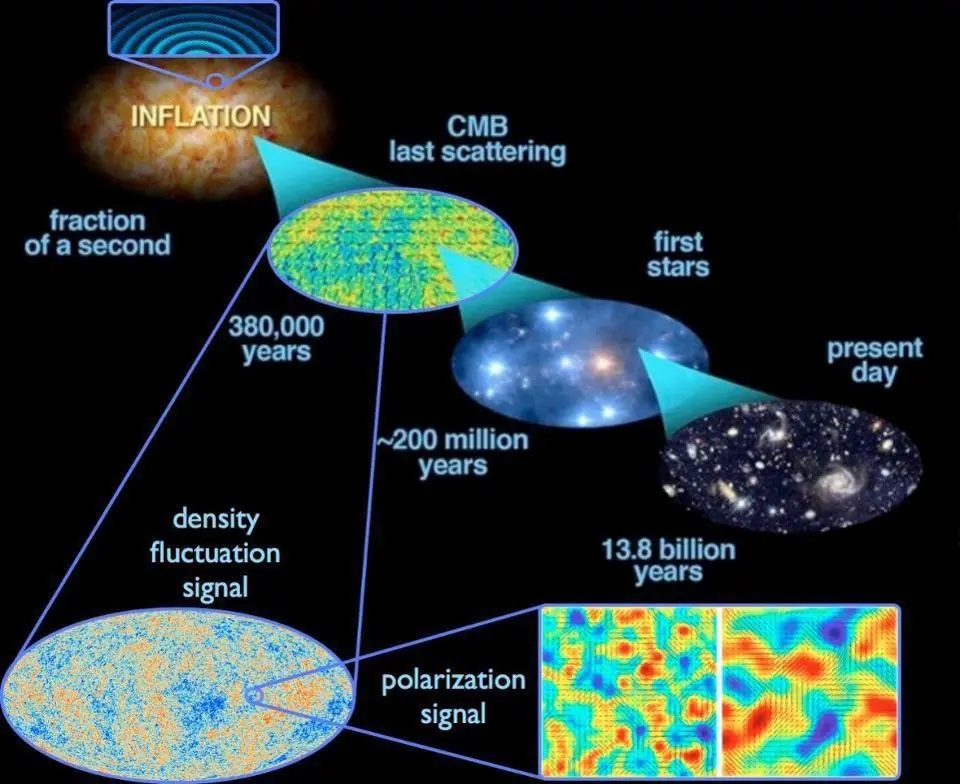
The quantum fluctuations inherent to space, stretched across the Universe during cosmic inflation, gave rise to the density fluctuations imprinted in the cosmic microwave background, which in turn gave rise to the stars, galaxies, and other large-scale structures in the Universe today. This is the best picture we have of how the entire Universe behaves, where inflation precedes and sets up the Big Bang. Unfortunately, we can only access the information contained inside our cosmic horizon, which is all part of the same fraction of one region where inflation ended some 13.8 billion years ago.
Credit: E. Siegel; ESA/Planck and the DOE/NASA/NSF Interagency Task Force on CMB research
Those are the conditions that, as far as we know, we expect the Universe to obey at the start of the hot Big Bang. The magnitude of what we call the “overdensities” and “underdensities” are about 1-part-in-30,000, which means that in any region of space, the departure from the average density will be approximately at that level: the 0.003% level. In reality, there’s a little bit of greater detail to these fluctuations than that.
- 0.003% represents the average departure from the mean density, but these density fluctuations are Gaussian, meaning they obey a Bell curve distribution.
- That means that, for every overdense region, there’s an equal-and-opposite underdense region.
- Also, 68% of the fluctuations fall within 0.003% of the average density, 95% fall within 0.006%, 99.7% fall within 0.009%, 99.99% fall within 0.012%, and so on.
- And that — because the field value that underlies inflation changes as inflation nears its end — the smallest cosmic scales have fluctuation magnitudes that are about 3% smaller than the magnitudes of the fluctuations on the largest cosmic scales.
We can’t see that initial spectrum of fluctuations directly, unfortunately; there are no directly observable signatures from the Universe that encode that information from those early times. The earliest we’re capable of probing comes another 380,000 years later: when we see the imprint of these fluctuations in the cosmic microwave background, or CMB. By that later time, the effects of gravitation at work, within the expanding Universe, have already appeared. Instead of a smooth spectrum of fluctuations at the 1-part-in-30,000 level, we have peaks-and-valleys that lead to larger-magnitude fluctuations on specific cosmic scales (particularly, certain large ones), and decreasing, smaller-magnitude fluctuations on other (particularly, smaller) cosmic scales.
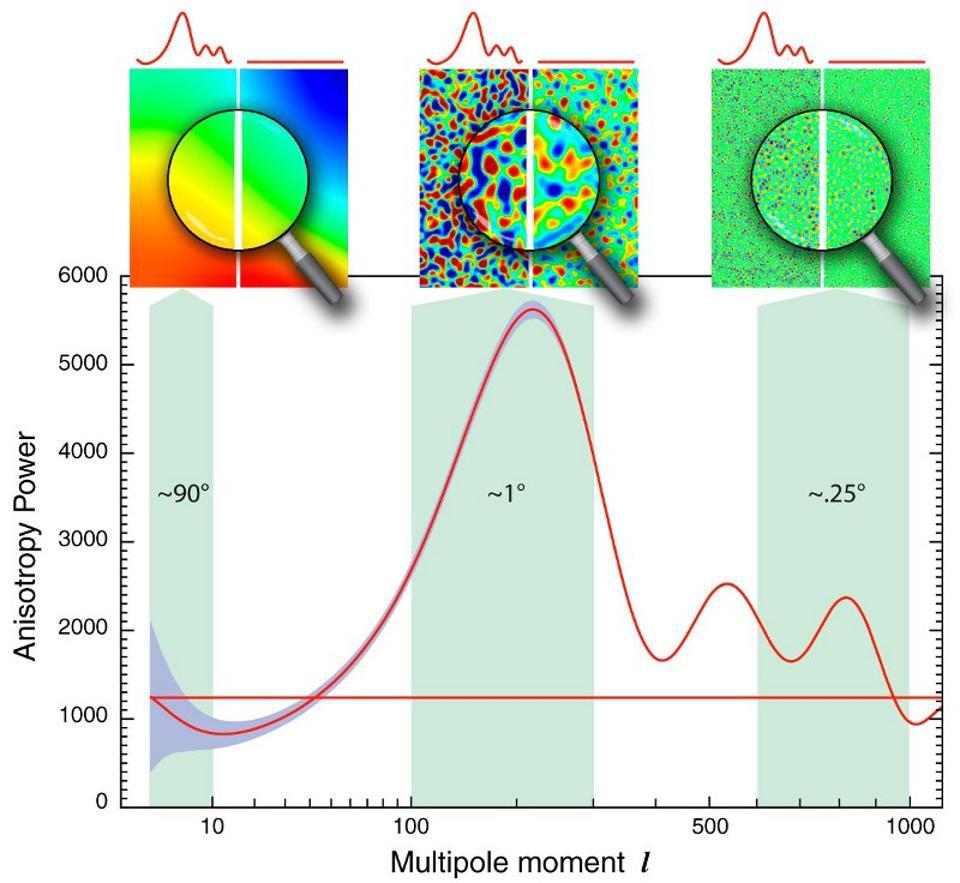
The fluctuations in the cosmic microwave background, as measured by COBE (on large scales), WMAP (on intermediate scales), and Planck (on small scales), are all consistent with not only arising from a (slightly tilted, but almost-perfectly) scale-invariant set of quantum fluctuations, but of being so low in magnitude that they could not possibly have arisen from an arbitrarily hot, dense state. The horizontal line represents the initial spectrum of fluctuations (from inflation), while the wiggly one represents how gravity and radiation/matter interactions have shaped the expanding Universe in the early stages.
Credit: NASA/WMAP science team
The maps we typically see of the CMB aren’t maps of the absolute temperature of the Universe at that time; that would be a wildly uninteresting map, as it would simply display a single solid color, representing a temperature of 2.7255 K everywhere. What we typically show, instead, are the temperature variations superimposed atop that nearly-perfectly-uniform background: temperature variations of just tens or maybe up to a couple of hundred of microkelvin. Those temperature variations correspond not to inherent differences in the temperature of the Universe at that time, but rather to the density differences in different regions of space.
How does that work?
Imagine that you had a uniform — this time, a truly perfectly uniform — background of radiation, with the same temperature, the same energy, and the same distribution everywhere. However, instead of having that radiation exist in space that has a uniform density everywhere, now imagine that your space is irregular: with different amounts of matter-and-energy, and hence, different gravitational potentials, in different locations. When the radiation that comes from those different regions arrives at your eyes, it will no longer appear perfectly uniform, because the radiation that originated:
- in the regions of greater-than-average density will have had to climb out of larger-than-average gravitational potential wells, losing more energy than average and appearing as “cold spots,”
- in the regions of average density will have climbed out of average gravitational potential wells, leading to an average energy loss and appearing as “average temperature spots,”
- in the regions of below-average density will have climbed out of a smaller-than-average gravitational potential well, losing less energy than average and hence appearing as “hot spots.”
That’s how we translate the observed CMB fluctuations into density fluctuations back at that long-ago epoch: 380,000 years after the start of the hot Big Bang, or at a redshift of z = 1089.
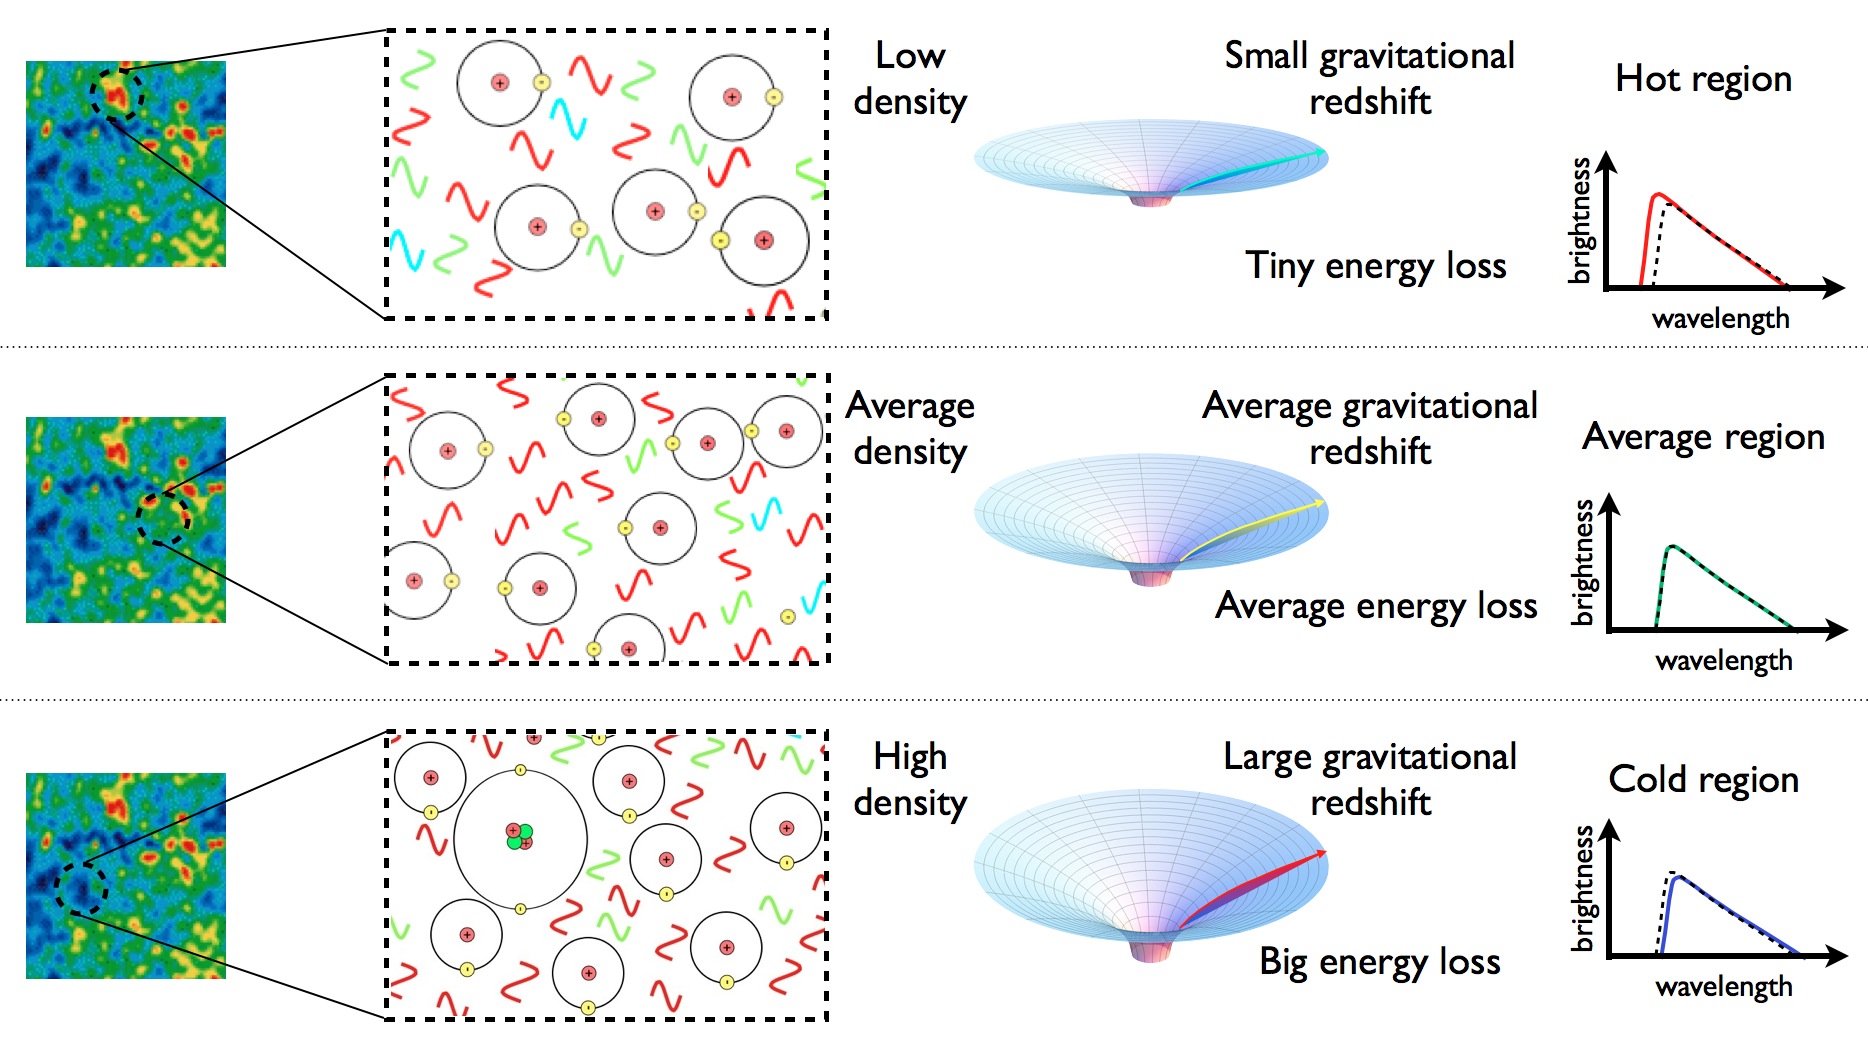
Regions of space that are slightly denser than average will create larger gravitational potential wells to climb out of, meaning the light arising from those regions appears colder by the time it arrives at our eyes. Vice versa, underdense regions will look like hot spots, while regions with perfectly average density will have perfectly average temperatures.
Credit: E. Siegel/Beyond the Galaxy
Back at these early times, even with the density enhancements brought about by gravitational growth, the largest-magnitude density fluctuations are still small compared to the average cosmic density: less than a single part in 1000. Sure, there are cosmic scales that have higher density fluctuations than average (such as on angular scales of around 1 degree), and there are rare “outlier” regions that are much more overdense than a typically overdense region, but the departures from the average density are still small compared to the average density itself.
And all this time, the Universe has been expanding: driving the average density down, expanding the distance separating any two individually overdense regions, and diluting the matter distribution in the Universe. On large cosmic scales — particularly on scales larger than the cosmic horizon at the time, or the distance a light signal could’ve traversed since the start of the hot Big Bang — the density decreases, and the magnitude of the overdense regions doesn’t grow.
But on scales smaller than the cosmic horizon, which includes all angular scales below around 10 degrees that get imprinted in the CMB, the matter density can grow, relative to the cosmic average, faster than the expanding Universe dilutes the density. The “growth factor” of these fluctuations (the sub-horizon fluctuations) is determined by what we call the Meszaros effect, named after Peter Meszaros, who predicted it back in the early 1970s. It basically states that the growth rate of any density imperfection, whether an overdensity that’s gaining mass from its less-dense surroundings or an underdensity that’s giving up mass to its denser surroundings, is proportional to the matter density at that time divided by the radiation density at that time.
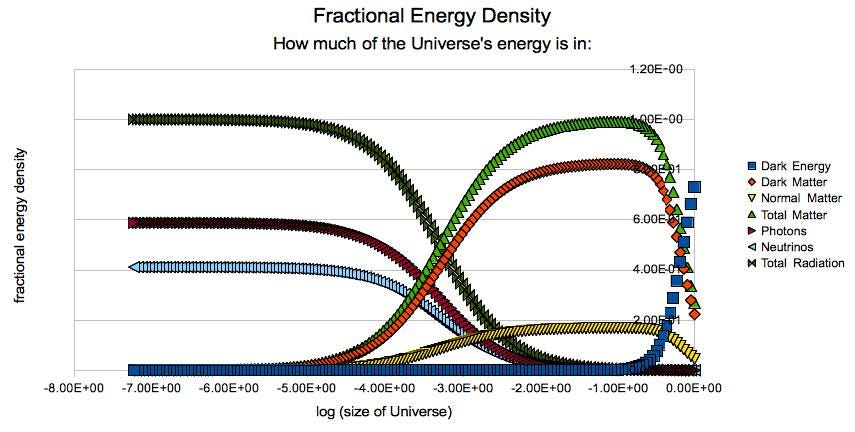
The relative importance of different energy components in the Universe at various times in the past.
Dark matter has been largely important for extremely long cosmic times, and we can see its signatures in even the Universe’s earliest signals. Meanwhile, radiation was dominant for the first ~10,000 years of the Universe after the Big Bang. Note that in the future, when dark energy reaches a number near 100%, the energy density of the Universe (and, therefore, the expansion rate) will remain constant arbitrarily far ahead in time.
Credit: E. Siegel
This is an incredibly powerful — and quantitative — prediction. Today, the total matter density of the Universe, including both dark and normal matter, is about 30% of the critical density, give or take a few percent. The radiation density is only about 0.008% of the critical density: a much lower value. But back when the Universe was smaller, younger, and had expanded less, radiation had a higher relative importance to matter. For example, back when the CMB was first emitted, at a redshift of z = 1089, radiation was a factor of 1089 more important relative to matter than it is today, giving them more like a 1:3 ratio instead of a 1:3200 ratio like they exhibit today.
As the Universe expands, cools, and dilutes, matter becomes more relatively important compared to radiation. That means, according to the Meszaros effect, that as we come to later and later times, the strength and magnitude of the overdensities (and also underdensities) relative to the average density increases.
Of course, the Meszaros effect is only an accurate description for how density imperfections grow within the expanding Universe under a certain set of conditions: when the strength of an overdensity (or underdensity) is very small compared to the average density. It’s sort of like if you have $100 and then I say, “I’m going to increase your amount of money by 1%, and then a bit later, by a further 1%,” you can approximate the amount of money you’ll get by increasing your $100 by 2%: to $102. But if I were to increase that initial $100 by 1% a hundred times, rather than two times, you wouldn’t want to approximate that by increasing your $100 by 100%: to $200. By forgetting about compound interest, you’d miss out on a huge set of gains, as the true amount of money you’d be owed after a hundred separate 1% increases would net you a cool $270: far more than the $200 you would’ve predicted under a single 100% increase.
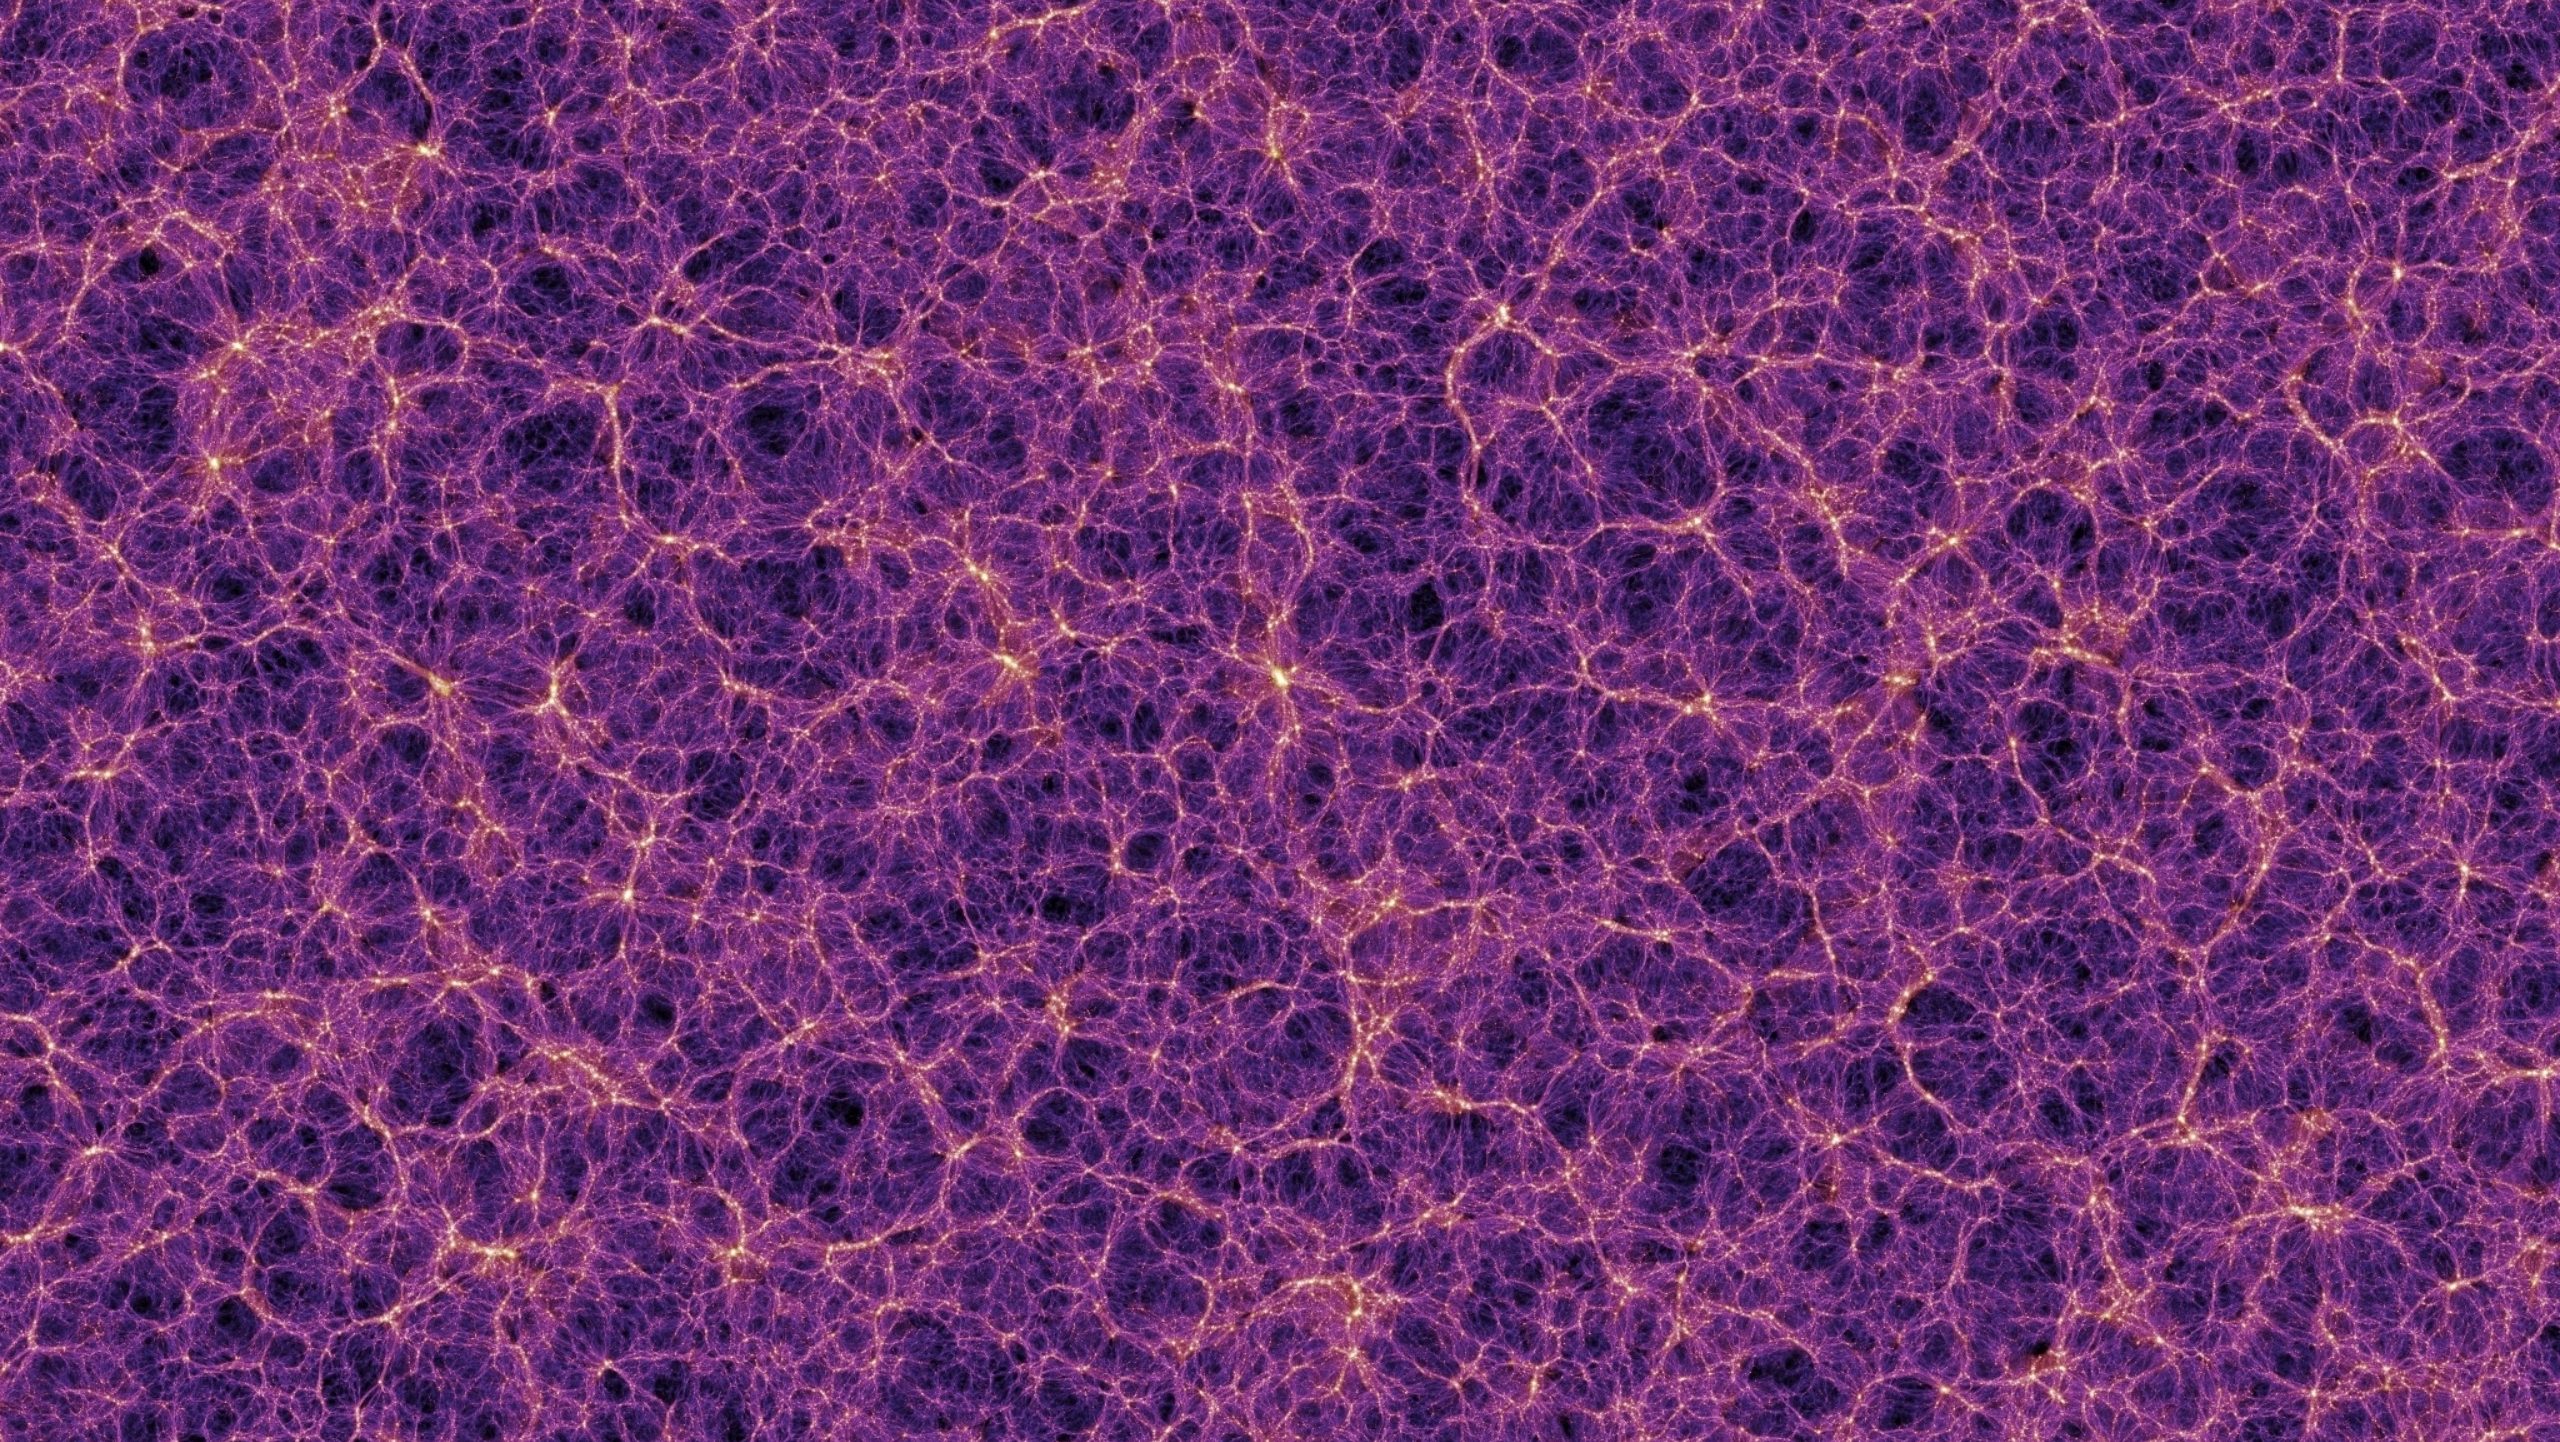
In modern cosmology, a large-scale web of dark matter and normal matter permeates the Universe. On the scales of individual galaxies and smaller, the structures formed by matter are highly non-linear, with densities that depart from the average density by enormous amounts. On very large scales, however, the density of any region of space is very close to the average density: to about 99.99% accuracy. On scales larger than a few billion light-years, no structures will ever form, owing to the presence and late-time domination of dark energy.
Credit: The Millennium Simulation, V. Springel et al.
That difference — between compounding or not compounding your interest — shows up in a significant way when the total amount of interest you earn becomes similar to, and comparably large to, your initial investment balance. This is analogous to when the Meszaros effect is and isn’t a good approximation for how your densities grow in the expanding Universe. It’s a good approximation when the overdensity/underdensity of a specific region is small compared to the average density, but it’s insufficient (and too low of an approximation) when those overdense (or underdense) regions are sufficiently large (or small) compared to the average density.
In the field of cosmic structure formation, we call this the difference between the “linear regime,” which is where overdensities and underdensities are small and where the Meszaros effect is a good approximation, and the “nonlinear regime,” which is where overdensities and underdensities grow large, and where the Meszaros effect is no longer a good approximation.
For the largest-magnitude overdensities, including the rarest, largest-magnitude initial seed fluctuations that are on the optimal cosmic scales to grow and collapse the fastest, that corresponds to a timetable of somewhere between 30-100 million years. After that amount of time has passed:
- density fluctuations have grown comparable to the average density,
- the Meszaros effect no longer applies, as real density growth is now stronger and faster,
- we have to consider the (fully) nonlinear regime instead of just the linear regime approximation,
- and the larger a density fluctuation grows, the more successfully it draws matter into it from its less dense surroundings.
In fact, once an overdense region becomes about 68% denser than the average density of the Universe, it crosses over that “imaginary threshold” between a mere overdense region, that continues to expand along with the expanding Universe, and a gravitationally bound one that will persist as a bona fide structure, even once dark energy rises to prominence and becomes the dominant factor in our cosmos’s expansion.
The overdense regions that the Universe was born with grow and grow over time, but are limited in their growth by the initial small magnitudes of the overdensities, the cosmic scale on which the overdensities are found (and the time it takes the gravitational force to traverse them), and also by the presence of radiation that’s still energetic, which prevents structure from growing any faster. It takes tens-to-hundreds of millions of years to form the first stars; small-scale clumps of matter exist long before that, however. Until stars form, the atoms in these clumps remain neutral, requiring ionizing, ultraviolet photons to render them transparent to visible light.
Credit: Aaron Smith/TACC/UT-Austin
For theorists, linear structure formation is our bread-and-butter: it’s easy to predict, compute, and calculate. The ambiguities are very small, and this is why it’s such a strong test of our standard cosmological model to probe the structures that form on the largest scales of all: they’re still in the linear regime. In fact, on scales greater than a couple billion light-years, they’ll never leave the linear regime in our dark energy-dominated Universe. If we didn’t have the seed fluctuations we have in our cosmos on intermediate and small cosmic scales, we never would have formed a single star at all; it truly would have been an impossibility.
But for structure formation that enters the nonlinear regime, there is no easy analytical solution like there is in the linear regime. We have no other resort than to perform our calculations numerically, and to simulate the growth of structure formation. The growth of structure, particularly at later times, is very highly sensitive to what the initial conditions are. If there are slightly more extremely overdense regions than a pure “Bell curve” of Gaussian random fluctuations would indicate, our structure formation story changes significantly, as overdense regions can become gravitationally bound (and trigger the formation of stars) much more quickly than with purely Gaussian fluctuations, as expected from inflation.
When we put all of the pieces together — at least, to the best of our abilities — we learn under what conditions, and at what times and in how many locations, we expect structures to become gravitationally bound. It’s then merely a matter of calculating and simulating baryonic physics, or the physics of the normal, atom-based matter in each bound region, to understand how and when stars form within them.
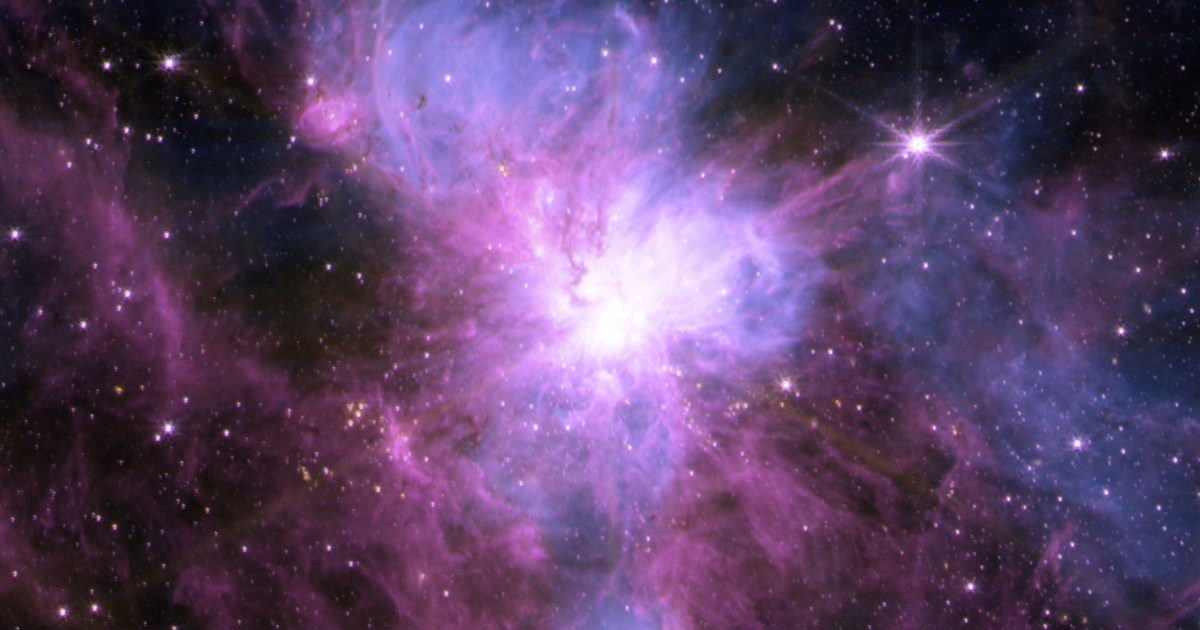
An artistic representation of a starburst galaxy, where the entire galaxy itself behaves as a star-forming region, using data from the FIRE (Feedback in Realistic Environments) simulation that includes strong bursts of star-formation. For the first ~3 billion years of cosmic history, the star-formation rate rose and rose until reaching a peak, but has fallen off significantly in the ~10-11 billion years since. Whether starburst galaxies become red-and-dead or will form new stars later on depends on factors we have not yet fully understood, especially at early times.
Credit: Aaron M. Geller, Northwestern, CIERA + IT-RCDS
These uncertainties, in both our knowledge of the initial conditions and also of the exact physics of nonlinear structure formation, are why there are so many different estimates for when, exactly, star-formation should begin in our Universe, and for how ubiquitous it became at the earliest of cosmic times. However, it isn’t a mystery why or how stars form at all; that part we do understand! Simply by starting with:
- a spectrum of large-enough seed fluctuations,
- on all (but particularly on small, sub-horizon) cosmic scales,
- in an expanding Universe that gravitates,
- with the ingredients of dark matter, normal matter, and radiation,
- where the radiation density drops more quickly, owing to cosmic expansion, than the matter density,
we are guaranteed to wind up with bound, matter-dominated structures once a sufficient amount of time has passed. And then, usually in short order, the sufficiently large quantities of normal matter within those gravitationally bound structures will contract, cool, fragment, and collapse, leading to the formation of stars for the first time, and then many times over thereafter.
I like to think of the Universe as a race: between expansion, which works to drive the matter in the Universe apart, and gravitation, which works to bring everything together. On sufficiently small cosmic scales — scales that enter (or re-enter, considering inflation) the cosmic horizon at early times — gravitational growth happens early, the Meszaros effect becomes important quickly, and in many such regions, structures become gravitationally bound early on, leading to the formation of stars. On scales that are too large, however, this never occurs; dark energy becomes important and drives even the initially overdense regions apart, which is why there are no real “supercluster” structures (including Laniakea) in the Universe; the ones we see are phantasmal, and are actively being torn apart by dark energy even today. It’s only because of the cosmic seeds of structure, planted by inflation at very early times on small cosmic scales, that we have stars, galaxies, and a structure-rich Universe today. At last, even without working through the math yourself, you now have a quantitative explanation for how this occurs.
Send in your Ask Ethan questions to startswithabang at gmail dot com!
Sign up for the Starts With a Bang newsletter
Travel the universe with Dr. Ethan Siegel as he answers the biggest questions of all.