Authors: Roger E. Cohen, Kristen B. W. McQuinn, Alessandro Savino, Max J. B. Newman, Daniel R. Weisz, Andrew E. Dolphin, Martha L. Boyer, Matteo Correnti, Marla C. Geha, Mario Gennaro, Karoline M. Gilbert, Nitya Kallivayalil, Jack T. Warfield, Benjamin F. Williams, Alyson M. Brooks, Andrew A. Cole, Evan D. Skillman, Christopher T. Garling, Jason S. Kalirai, Jay Anderson
First Author’s Institution: Rutgers the State University of New Jersey, NJ, USA
Status: Published in the Astrophysical Journal
Dwarf galaxies are very small structures astrophysically speaking, containing only up to a few billion stars. They provide a surprisingly heterogeneous and interesting population that can help us understand galaxy evolution in a unique way, given their much smaller mass. One of the key factors that might determine how dwarf galaxies evolve is their environment, as recent observations suggest that dwarfs that are close to massive galaxies differ from those that are more isolated in terms of structure, star formation history, and gas content. One of the main methods to explore these differences is to look at the ages of stars as a function of radius from the galaxy’s center. Most dwarf galaxies have the youngest stars in the center and the oldest near the outskirts, leading to a so-called “outside-in” age gradient.
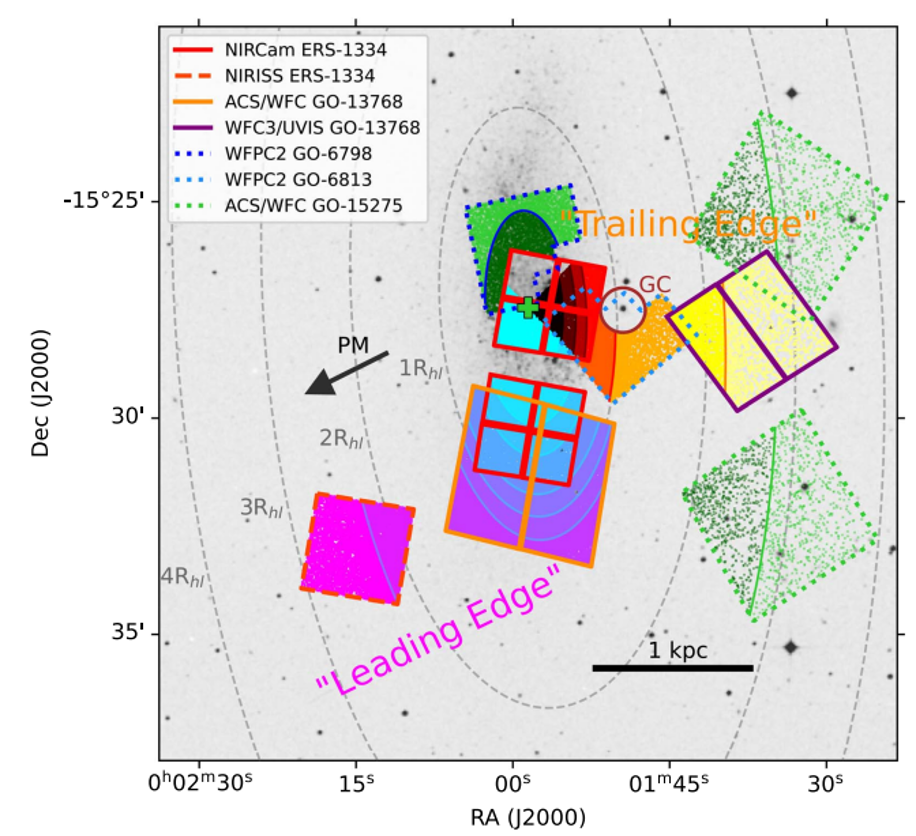 Figure 1: Overlays showing the regions of JWST and HST observations of the WLM galaxy. As both JWST and HST have small fields of view, the whole galaxy is not imaged. Here PM refers to proper motion, and the leading edge (along the direction of travel) and trailing edge are also identified. Figure 1 in today’s paper.
However, there are some exceptions that showcase different gradients, like “inside-out” or flat. All of these exceptions show signs of interactions with other galaxies in the past, suggesting that environment plays a key role in the star formation in these small galaxies. This is at odds with many predictions from simulations, which suggest that internal processes (like stellar feedback) are more important than what’s going on around the dwarf. Disentangling the different factors that shape these small galaxies is difficult, but looking at isolated dwarfs that are not satellites of massive systems can help pinpoint what internal processes are doing, without having to worry about external interactions.
There’s one big problem: finding isolated dwarfs is much easier said than done. There simply aren’t that many of them in the Local Group (our galactic neighborhood), and by their nature, dwarfs are small and faint, so finding more of them at greater distances is difficult. One of the few examples we do have is called the Wolf–Lundmark–Melotte Galaxy (hereafter WLM), which is the prototypical isolated dwarf in the Local Group. Today’s paper takes advantage of this nearby isolated system to try and generate a star-formation history of the galaxy using Hubble Space Telescope (HST) and James Webb Space Telescope (JWST) observations. Figure One shows the location of these observations, spanning a range of radii and angular positions in the galaxy. This collection of data at different locations means the star-formation history can be spatially resolved, and we can look for how stellar populations might differ in different parts of the galaxy.
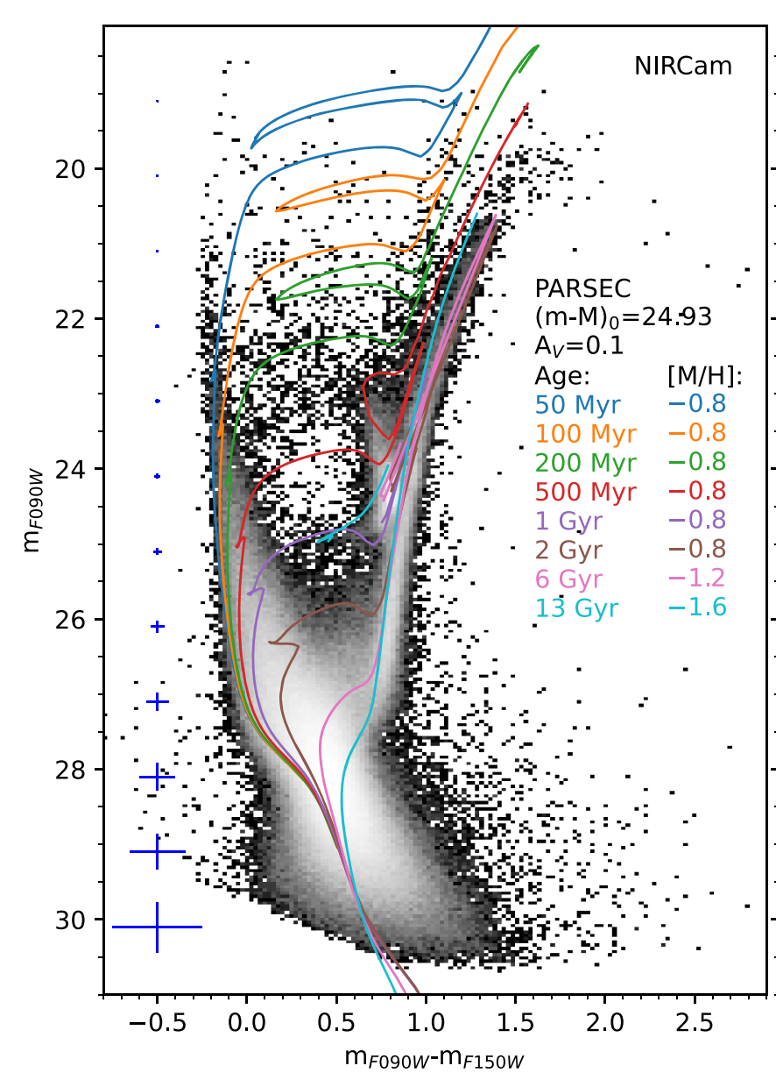 Figure 2: Color-magnitude diagram for one of the JWST-observed regions of WLM. X-axis shows the color, represented by the difference in brightness between two filters, and the y-axis shows the magnitude in one of those filters. The colored lines represent the patterns made by stellar populations of different ages. Adapted from Figure 2 in today’s paper.
The images from HST and JWST are high enough resolution that we can identify individual stars in WLM (check out the featured image for this bite: all those specks you see are non-Milky Way stars!). By plotting the magnitude of each star on one axis and color-calculated using the difference in brightness between two filters-on the other, you can generate the aptly named color-magnitude diagram (CMD). Figure 2 shows a CMD for one of the JWST fields in WLM. CMDs allow us to trace the age of the stellar population, since as stars get older they will change positions on the diagram in well-established ways. The colored lines in Figure 2 are isochrones, representing the patterns made by a collection of stars at the same age, but with varying masses. An old stellar population, as represented by the teal line, will have mainly red stars, whereas a younger stellar population, as seen in the dark blue line, will have more bright and blue stars. As not all the stars in WLM formed at one time, the shape of the observed CMD can be seen to be a combination of many different stellar population ages.
By running many models of these stellar populations at different ages and combining them until they fit the data, we can extrapolate what the star-formation history of WLM must have been. As seen in Figure 3, once you’ve identified what combination of stellar populations works best, you can estimate when star formation was happening over the 13 billion year history of the galaxy.
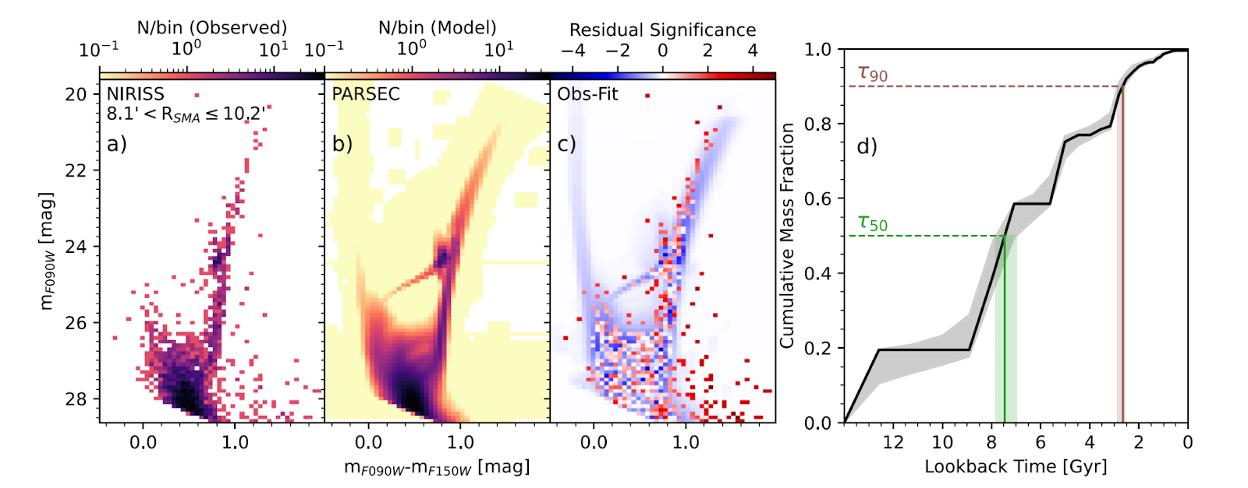 Figure 3: An example of how star-formation histories are generated from color-magnitude diagrams (CMDs). From left to right is shown: CMD of JWST observations in one region of the WLM galaxies. Best-fit model CMD generated by combining many models of stellar populations of different ages. Differences between the model and observations, demonstrating a good fit. The assumed star-formation history for this region, based on the best-fit model. Figure 4 in today’s paper.
Figure 4 shows the cumulative star formation history for four observations at four different positions. They found that regions at larger radii formed more of their stars earlier, as seen in the steep rise at the beginning of the cumulative plot compared to the stellar populations closer to the center of the galaxy. This follows the general trend of dwarf galaxies having the oldest stars near the outskirts, forming an “outside-in” age gradient.
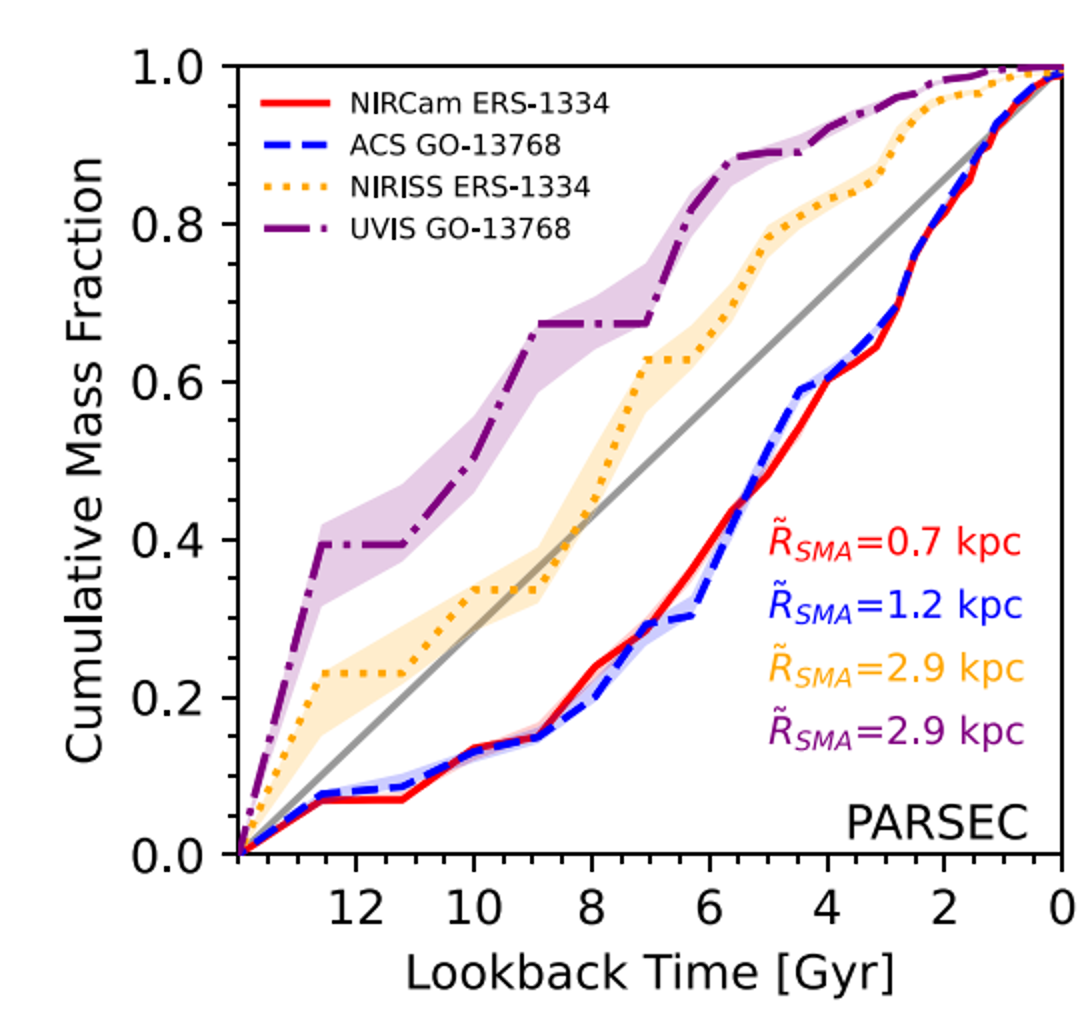 Figure 4: Star-formation history for stellar populations at four different locations in the WLM galaxy. The y-axis shows the cumulative mass fraction: what proportion of the galaxy’s total mass was formed by a given age. The red and blue lines represent observations closer to the center of the galaxy, while the purple and yellow represent regions at a larger distance, with the purple along the leading edge and the yellow along the trailing edge of the galaxy. Adapted from Figure 6 in today’s paper.
Interestingly, despite the two outer fields being at the same radius, they show different histories, suggesting that there is a dependence not just on distance from the center, but also angle. And it’s not random either. When looking at the way WLM is moving through the sky, the stars on the leading edge are younger than those on the trailing edge. This suggests that there might be some sort of triggered star formation due to interactions of WLM and the intergalactic medium. As it turns out, even isolated galaxies might still be impacted by their environment, even if there aren’t any other galaxies around! Understanding if this is common in other isolated dwarf galaxies remains uncertain, but having detailed observations like these from HST and JWST is proving quite useful for studying the stellar systems of dwarfs in greater detail.
Astrobite edited by Veronika Dornan
Featured image credit: NASA, ESA, CSA, Kristen McQuinn (Rutgers University); Image Processing: Zoltan Levay (STScI)
-
Skylar Grayson is an Astrophysics PhD Candidate and NSF Graduate Research Fellow at Arizona State University. Her primary research focuses on AGN feedback processes in cosmological simulations. She also works in astronomy education research, studying online learners in both undergraduate and free-choice environments. In her free time, Skylar keeps herself busy doing science communication on social media, playing drums and guitar, and crocheting!