Phenotypic evaluation of hybrid and parental lines
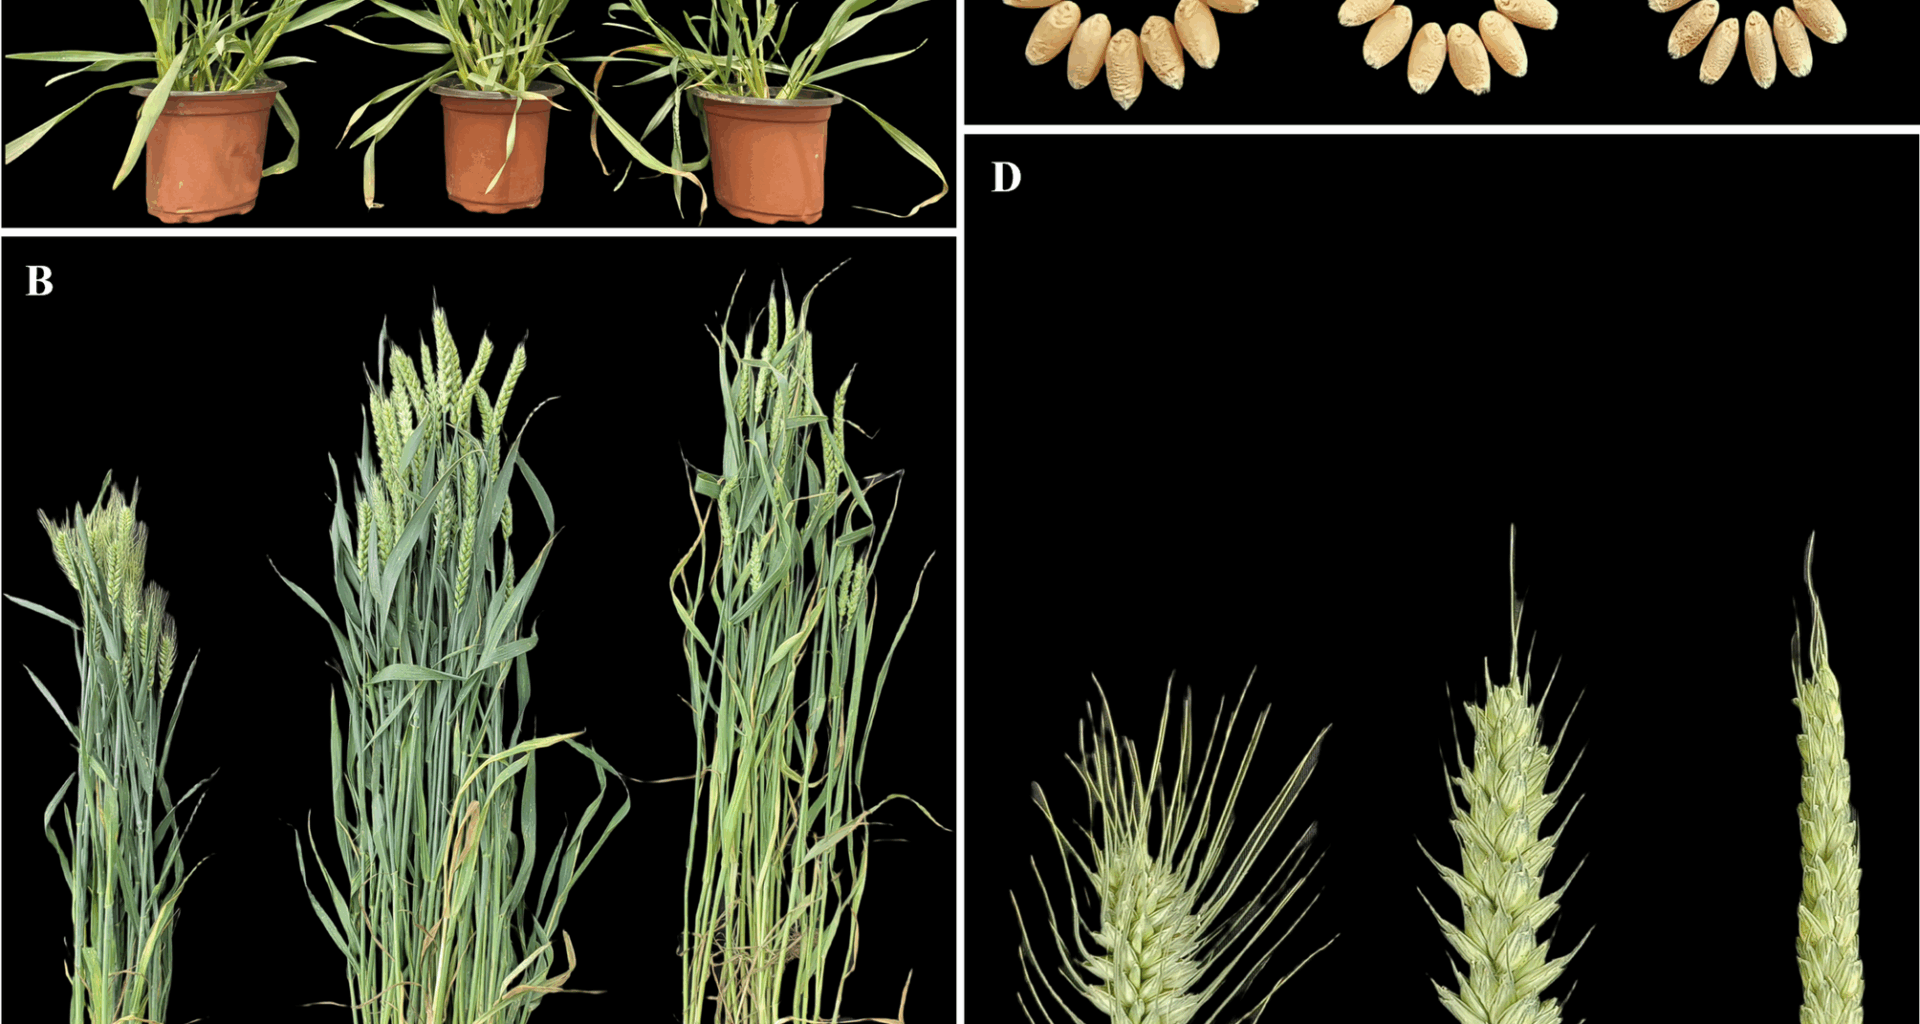
Phenotypic assessments revealed enhanced hybrid vigor in hybrid BC98, characterized by increased seedling vigor and biomass accumulation at the seedling and adult stages (Fig. 1A, B). Adult BC98 exhibited superior agronomic traits, which included higher spike numbers and grain yields per plant (Table 1). Notably, compared with both parental lines, BC98 presented significantly more spikelets per spike, demonstrating substantial mid-parent heterosis (MPH) and better-parent heterosis (BPH; p 1; Fig. 1C, D). Additional heterotic traits included plant height, flag leaf area, spike length, and weight per 1000 grains (Table 1). These results confirmed the robust heterosis of BC98, particularly with respect to yield-related traits. Additionally, for most yield-related heterosis traits, BC98 surpassed the parental line BN4199 (a widely cultivated commercial variety), highlighting the potential of BC98 in agricultural applications.
Fig. 1
Phenotypic evaluation of the wheat hybrid BC98 and its parental lines. The plant lines in each figure are displayed in the following order: BN4199, BC98, and CL0438. (A) Heterotic phenotypes at the seedling stage. (B) The heterotic phenotypes at the adult plant stage. (C) Heterotic phenotypes of the grains. (D) The heterotic phenotypes of the spikes
Table 1 Evaluation of heterosis for yield-related agronomic traits in the hybrid BC98Transcriptome sequencing of hybrid wheat and parental lines
This study performed transcriptome sequencing of flag leaves from hybrid BC98 and the parental lines BN4199 and CL0438 during the AN and GF stages via the Illumina NovaSeq 6000 platform. A sequencing depth of more than 10 Gb per sample was obtained (total of 18 samples, including biological triplicates), and 66.4–104.3 million high-quality reads per sample were aligned to the Chinese Spring wheat reference genome (IWGSC RefSeq v2.1), resulting in an overall mapping rate of 86.8%, with 86.4% of clean reads being uniquely mapped (Table S1). The biological replicates were highly consistent (average Pearson r = 0.95) (Figure S1). After filtering, 92,845 high-confidence protein-coding genes were identified (Table S2). Among the 47,838 expressed genes (FPKM ≥ 1), the expression levels were categorized as high (FPKM ≥ 50, 4.3% or 2,068 genes), moderate (20 ≤ FPKM
Differences in expression between hybrid and inbred parents
Comparative transcriptomic analysis revealed dynamic expression divergence between the hybrid BC98 and its parental lines at the AN and GF stages. At the AN stage, 15,229 DEGs (|log2FC| ≥ 1, p 2A, Table S3). The hybrid BC98 exhibited a BN4199-biased expression profile, with fewer upregulated DEGs relative to the parental line BN4199 (5,623 DEGs; 17.3% upregulated) than the parental CL0438 (9,108 DEGs; 20.2% upregulated). At the GF stage, the number of DEGs identified between the parental lines decreased (10,328 parental DEGs; 46.7% of total genes), but the upregulated/downregulated gene ratios increased (Fig. 2B, Table S3). Notably, 46.0% of the DEGs identified between the parental lines at the AN stage and 37.9% at the GF stage overlapped with those identified between BC98 and CL0438, whereas only 29.4% at the AN stage and 28.1% at the GF stage overlapped between BC98 and BN4199 (Fig. 2C, Table S3). Hierarchical clustering analysis confirmed the hybrid BC98’s expression bias toward the parental BN4199 (Fig. 2D).
Fig. 2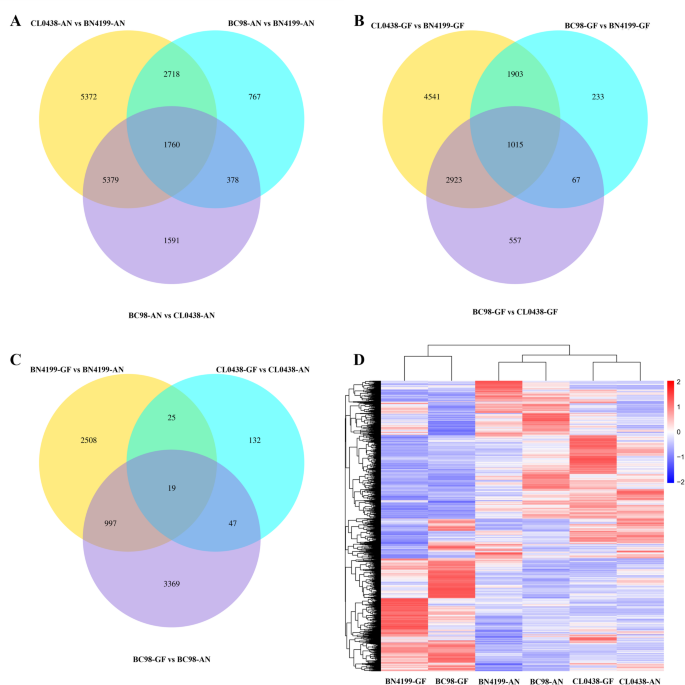
Venn diagram comparisons and hierarchical clustering analysis of differentially expressed genes (DEGs) among the plant lines. (A) Venn diagram comparison of the DEGs at the anthesis (AN) stage. (B) Venn diagram comparison of the DEGs at the grain-filling (GF) stage. (C) Venn diagram comparison of the DEGs between the AN and GF stages. (D) Hierarchical clustering analysis of the DEGs among the plant lines. The color scale in (D) represents the log10(FPKM + 1) values, with red indicating relatively high expression and blue indicating relatively low expression
A comparative analysis across the developmental stages revealed distinct expression dynamics in the hybrid BC98 and its parental lines. Stage-specific DEGs were identified in BC98 (4,432 DEGs), BN4199 (3,549 DEGs), and CL0438 (223 DEGs) when the AN and GF stages were compared (Fig. 2C, Table S3). The hybrid BC98 shared 1,016 DEGs with the parental line BN4199 but only 66 with the parental CL0438. Notably, TraesCS4B02G178500 (a VQ domain-containing protein), which was upregulated in BC98 at the GF stage (Fig. 2C), delays leaf senescence by suppressing WRKY75 [42]. Further comparison of the two development stages revealed 3,549, 223, and 4,432 DEGs in BN4199-GF vs. BN4199-AN, CL0438-GF vs. CL0438-AN, and BC98-GF vs. BC98-AN, respectively (Table S3).
A Venn diagram revealed that 1,088 genes were differentially expressed between the two development stages in at least two genotypes (Fig. 2C). GO enrichment analysis revealed that these DEGs were significantly enriched in multicellular organismal processes (GO:0032501) and nutrient reservoir activity (GO:0045735) (Table S4). Multiple organismal processes (GO:0032501) involve primarily serine/threonine protein kinases, which use phosphorylation to regulate signal transduction and tissue differentiation [43]. Moreover, nutrient reservoir activity (GO:0045735) was enriched with germin-like protein genes involved in cell wall remodeling, starch‒sugar metabolic flux regulation, and responses to biotic/abiotic stresses [44]. Notably, the GO analysis revealed that the hybrid BC98 was more similar to the parental line BN4199 in terms of developmental signaling regulation and metabolic characteristics. This pattern was further confirmed through hierarchical clustering of the 1,088 DEGs (Figure S2).
Collectively, these gene expression results closely aligned with the phenotypic observations. Specifically, the parental lines BN4199 and CL0438 presented strong complementary traits, with BN4199 serving as the high-value parent for critical yield-related characteristics, such as the weight per thousand grains and single-plant yield. These results highlight the central role of BN4199 in increasing the yield of hybrid plants.
Dynamic changes in differential gene expression patterns affect heterosis
To elucidate the transcriptomic divergence between the F1 hybrids and their parental lines, we classified DEGs from two critical developmental stages into additive and non-additive gene expression patterns using the MPV as the reference baseline. At the AN stage, 7,087 genes (39.5%) presented additive expression, which declined numerically but increased proportionally to 5,545 genes (49.3%) at the GF stage. In contrast, the non-additive genes dominated at the AN stage (10,873 genes; 60.5%) but decreased numerically and proportionally at the GF stage (5,692 genes; 50.7%) (Fig. 3A and Tables S5, S6). The non-additive genes were further categorized into parental dominant (high/low-parent dominance) and over/underdominant types. At the AN stage, parental dominance accounted for 96.1% of the non-additive genes (6,969 BN4199-dominant genes vs. 3,485 CL0438-dominant genes), whereas the over- and underdominant types were rare (2.5% and 1.4%, respectively). At the GF stage, parental dominance remained predominant (98.7%), with the BN4199-dominant genes consistently outnumbered the CL0438-dominant genes (61.1% vs. 37.5%). The number of overdominant and underdominant genes further decreased to 51 (0.9%) and 25 (0.4%), respectively. Notably, the BN4199-dominant genes accounted for more than 60% of the non-additive genes across both developmental stages, indicating that their alleles likely serve as key drivers of heterosis by regulating critical pathways.
Fig. 3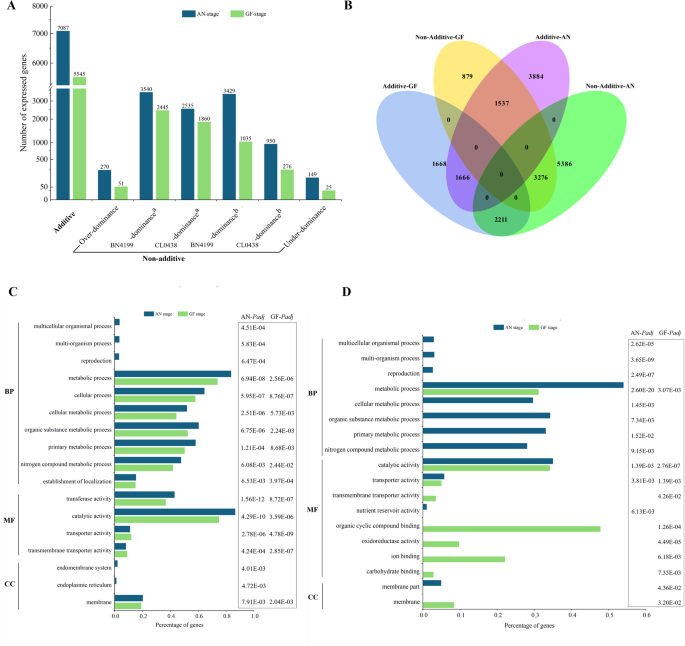
Comparative analysis and functional enrichment analysis of additive and non-additive genes in hybrid plants across developmental stages. (A) Distribution of additive and non-additive genes at the anthesis (AN) and grain-filling (GF) stages. a denotes high-parent dominance, and b indicates low-parent dominance. (B) Venn diagram depicting inheritance pattern transitions between the AN and GF stages. (C) Gene Ontology enrichment of the additive genes. (D) Stage-specific Gene Ontology enrichment patterns of BN4199-dominant genes in the hybrids at the AN and GF stages
The non-additive genes presented greater developmental stage-dependent expression changes, declining by 47.9% (5,181 genes) from the AN stage to the GF stage, compared with only 21.8% for the additive genes (Fig. 3A and Tables S5, S6). Consequently, the proportion of additive genes increased from 39.5% at the AN stage to 49.3% at the GF stage, indicating a shift from non-additive interactions governing early growth to additive genetic complementation driving grain filling. Examining the degree of conservation in the expression patterns between the developmental stages revealed distinct dynamics between the non-additive and additive gene expression patterns. At the GF stage, 30.1% of the non-additive genes (3,276 genes) maintained the same non-additive expression patterns, whereas 20.3% (2,211 genes) shifted to additive patterns (Fig. 3B). In contrast, the additive genes presented lower stability, with only 23.5% (1,666 genes) retaining their original expression patterns and 21.7% (1,537 genes) transitioning to non-additive expression patterns. These findings demonstrated that gene expression patterns display distinct growth stage-specific adaptability in response to developmental and environmental cues. These observations were also consistent with prior studies of transcriptional plasticity in rice hybrids [45].
Functional enrichment analysis of genes whose expression patterns are linked to heterosis
We performed comprehensive GO enrichment analyses to investigate the molecular functions and biological contributions of additive and non-additive genes to heterosis. Among the additive genes, 1,394 genes (19.7% of the 7,087 additive genes) at the AN stage and 1,013 genes (18.3% of the 5,545 additive genes) at the GF stage were significantly enriched (adjusted p 3C, Table S7). Among the genes involved in BP, metabolic processes (GO:0008152; 83.5% at the AN stage and 73.7% at the GF stage) and cellular processes (GO:0009987; 64.3% and 57.8%) were enriched at both developmental stages, whereas reproductive processes (GO:0022414; 3.1%) were specifically enriched at the AN stage. Among these processes, the additive genes involved in core metabolic and cellular pathways were consistently enriched at both stages, including primary metabolic processes (GO:0044238; 58.0% vs. 50.1%), cellular metabolism (GO:0044237; 51.8% vs. 44.2%), organic substance metabolism (GO:0071704; 60.2% vs. 52.3%), protein metabolism (GO:0019538; 38.6% vs. 29.3%), establishment of localization (GO:0051234; 15.2% vs. 14.9%), catalytic activity (GO:0003824; 86.4% vs. 74.8%), transporter activity (GO:0005215; 11.0% vs. 11.8%), and membrane-associated components (GO:0016020; 20.1% vs. 19.0%). These results indicate that additive genes primarily sustain basal cellular metabolism and macromolecule biosynthesis, which aligns with previous heterosis studies [16]. Stage-specific enrichment patterns reflect the dynamic nature of these functional adaptations, and the high proportion of genes involved in catalytic activity suggests that they play essential regulatory roles. KEGG enrichment revealed stage-coordinated metabolic network remodeling (Table S8). At the AN stage, characteristic pathways including starch and sucrose metabolism (ko00500), plant-pathogen interaction (ko04626), diterpenoid biosynthesis (ko00904), and alpha-linolenic acid metabolism (ko00592) collectively supported reproductive organ development and environmental adaptation. Transitioning to the GF stage, the pathway network markedly shifted toward reproductive optimization, with flavonoid biosynthesis (ko00941), plant hormone signal transduction (ko04075), ABC transporters (ko02010), and circadian rhythm (ko04712) dominating resource allocation efficiency. This metabolic remodeling from “defense priming” at the AN stage to “reproduction priority” at the GF stage was sustained by conserved pathways, such as phenylpropanoid biosynthesis (ko00940), homologous recombination (ko03440), and starch and sucrose metabolism (ko00500), maintaining basal stress resilience and genomic stability, while stage-enhanced transport and signaling pathways enabled precise developmental transitions. These KEGG patterns aligned closely with GO enrichment of additive genes, corroborating the centrality of core metabolism. Notably, the significantly enriched amino acid biosynthesis pathway (GO:0019538) at the AN stage and the enhanced nitrogen metabolism (Ko00910) at the GF stage worked synergistically to maintain protein metabolic continuity. Furthermore, the enrichment of ABC transporters (Ko02010) at the GF stage corresponded functionally to the elevated activity of “establishment of localization” (GO:0051234) identified in GO analysis. This coordinated regulation demonstrates that additive genes maintain heterosis through a highly active metabolic-catalytic homeostasis system that forms a fundamental support network, while developmental stage-dependent pathway reorganization facilitates the dynamic transition of heterosis from reproductive development at anthesis to assimilate partitioning during grain filling, thereby providing the molecular basis for achieving both high and stable yields.
Among the non-additive genes, GO analysis revealed 2,175 (20.0% of the 10,873 genes) and 930 (16.3% of the 5,692 genes) significantly enriched genes at the AN and GF stages, respectively (Table S7). Among the BN4199-dominant genes, we observed unique patterns in those belonging to BP: metabolic processes (GO:0008152; 53.9% at the AN stage vs. 31.1% at the GF stage) and reproductive processes (GO:0022414; 2.6% exclusively at the AN stage) (Fig. 3D). MF analysis revealed that catalytic activity (GO:0003824; 34.9% vs. 34.1%) and transporter activity (GO:0005215; 5.7% vs. 4.9%) were enriched. At the AN stage, the stage-specific MF terms included nutrient reservoir activity (GO:0045735; 1.0%), and at the GF stage, they included organic cyclic compound binding (GO:0097159; 47.7%), oxidoreductase activity (GO:0016491; 9.7%), ion binding (GO:0043167; 22.0%), and carbohydrate binding (GO:0030246; 2.8%). In contrast, the CL0438-dominant genes were not enriched and included primarily catalytic activity (GO:0003824; 39.5%) at the GF stage (Table S7). These findings demonstrate that BN4199-dominant alleles contribute disproportionately to functional GO terms. This observation also suggests that these BN4199-dominant alleles play stage-specific regulatory roles in heterosis.
The KEGG pathway analysis of the GF-stage BN4199-dominant genes revealed several key pathways contributing to parental dominance (Table S9), which included metabolic pathways (ko01100), endoplasmic reticulum protein processing (ko04141), carbon metabolism (ko01200), plant‒pathogen interaction (ko04626), glutathione metabolism (ko00480), phenylpropanoid biosynthesis (ko00940), and circadian rhythm (ko04712). Notably, we identified many functionally characterized genes associated with yield and stress resilience, likely contributing to BC98 heterosis. These genes included RBCS (Rubisco small subunit), which is involved in photosynthetic carbon assimilation [46]; SPS (sucrose-phosphate synthase), which regulates sucrose biosynthesis [47]; IPT (isopentenyltransferase), which is a cytokinin biosynthesis rate-limiting enzyme that enhances stress tolerance and yield [48]; CYP90B1, which encodes a brassinosteroid biosynthesis enzyme critical for development and stress response [49]; circadian regulators TOC1 and ELF3, which coordinate growth‒stress balance via light signaling [50] and are implicated in crop heterosis [51]; and Hsp90.2-B, which positively regulates photosynthetic efficiency and grain weight through actin-dependent chloroplast protein targeting [52].
Allele-specific expression patterns in hybrid wheat
Allelic variation is widespread in plant genomes. Significant transcriptional divergence can occur between parental alleles of hybrids, representing one of the key molecular mechanisms underlying heterosis [15]. The ASE analysis of the hybrid BC98 identified 31,862 SNPs at the AN stage and 20,048 SNPs at the GF stage in the transcribed regions of the genome, which corresponded to 5,982 (62.8% of total SNP-qualified genes) and 4,958 (64.0% of total SNP-qualified genes) protein-coding genes, respectively (Table 2). After correcting for Type I errors (q BC98-biased, 52.2% and 881 CL0438BC98-biased genes, 47.8%), which increased to 2,299 (46.4%) at the GF stage (1,317 BN4199BC98-biased genes, 57.3% and 982 CL0438BC98-biased genes, 42.7%) (Fig. 4A, Band Tables S10, S11). By classifying according to allelic expression ratios, we obtained the following results: monoallelic expression: 0.9% (AN) vs. 1.0% (GF); preferential expression: 66.5% (AN) vs. 60.8% (GF); and biallelic expression : 32.5% (AN) vs. 38.2% (GF). These ASE patterns revealed several key developmental dynamics in hybrid wheat. The increased predominance of BN4199-derived allelic bias at the GF stage suggests temporal activation of critical alleles from this parent, potentially regulating grain-filling or storage protein synthesis. This allelic bias highlights the dynamic selection of advantageous parental alleles across developmental phases. Furthermore, the observed increase in ASE genes from 1,844 at the AN stage to 2,299 at the GF stage indicates the progressive expansion of allele-specific regulatory networks in the hybrids, likely integrating complementary parental genetic effects to coordinate complex trait optimization during reproduction. Finally, the concurrent decline in preferential expression and the rise in balanced biallelic expression imply a developmental shift in regulatory strategies—from partial dominance driven by single-allele superiority to overdominance/dominance complementarity. These regulatory changes reinforce heterosis phenotypes through stage-specific modulation of allelic contributions.
Table 2 SNPs associated with allele-specific expression in hybrids across developmental stagesFig. 4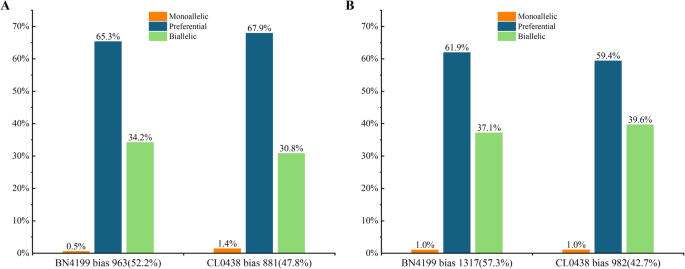
Allele-specific expression patterns in the hybrids at the anthesis (AN) and grain-filling (GF) stages. Proportions of genes with monoallelic expression, preferential expression, and biallelic expression profiles in the hybrids at the AN stage (A) and GF stage (B)
The developmental stage comparison of 2,988 ASE genes revealed 2,038 (68.2%) genes with stable allelic bias, 241 genes with switched preferences (132 switching from BN4199BC98- to CL0438BC98-biased alleles, 109 switching from CL0438BC98- to BN4199BC98-biased alleles), and 709 newly biased genes (Table 3). This plasticity is consistent with the ability of wheat to adaptively rewire its transcriptional processes during development [21]. The increased BN4199BC98 bias observed at the GF stage highlights the genome dominance of the parental line BN4199 during late-stage heterosis, which is consistent with prior studies that indicated regulatory divergence among the alleles in hybrids [15].
Table 3 Stage-specific analysis of allelic expression variation in the hybrids
The KEGG divergence underscores genes revealed distinct stage-specific metabolic priorities (Figure S3). At the AN stage, top enriched pathways included thiamine metabolism (ko00730), citrate cycle (TCA cycle) (ko00020), porphyrin and chlorophyll metabolism (ko00860), plant hormone signal transduction (ko04075), and alpha-Linolenic acid metabolism (ko00592), indicating emphasis on energy production and photosynthetic machinery. In contrast, at the GF stage, ASE genes prioritized glyoxylate and dicarboxylate metabolism (ko00630), glycine, serine and threonine metabolism (ko00260), plant hormone signal transduction (ko04075), protein processing in endoplasmic reticulum (ko04141), and TCA cycle (ko00020), highlighting shifts toward amino acid metabolism, protein modification, and carbon remobilization. Notably, plant hormone signal transduction (ko04075) and TCA cycle (ko00020) were conserved across stages.
Developmental dynamics of cis- and trans-regulatory divergence
The regulatory divergence in the hybrid BC98 was dissected by comparing the ASE ratios (cis effects) and parental expression divergence (trans effects = total divergence − cis effects) across the developmental stages (Fig. 5A, B). Among the 5,982 genes at the AN stage, 11.5% (688 genes) exhibited cis-only regulation, 12.4% (742 genes) had trans-only regulation, and 15.5% (929 genes) had cis-trans interactions, whereas 38.2% (2,283 genes) exhibited no divergence (classified as “conserved”) (Tables S12, S13). Further examination of the 929 cis-trans interaction genes revealed three subtypes [53, 54]. In the enhancing subtype (cis + trans), both cis- and trans-regulatory mechanisms promoted the expression of identical parental alleles (423 genes, 7.1%). This subtype included identical and opposite scenarios (Table S12). In the antagonistic subtype (cis × trans), the cis- and trans-regulatory mechanisms acted in opposite directions on the same and different alleles (192 genes, 3.2%). In the compensatory subtype, cis-enhancement and trans-suppression of specific alleles offset each other, resulting in nonsignificant differences in gene expression between the parents or the hybrids, whereas the expression of the homologous allele remains independently regulated (314 genes, 5.1%). At the GF stage, cis-only regulation increased to 15.2% (753/4,957 genes), surpassing trans-only regulation (10.2%, 508 genes) and compensatory regulation (15.0%, 744 genes) (Tables S12, S14). The cross-stage analysis of 7,736 genes revealed conserved regulatory patterns in 21.8% of the cis-only regulated genes, 9.4% of the trans-only regulated genes, and 30.7% of the cis-trans interaction genes (Table S15).
Fig. 5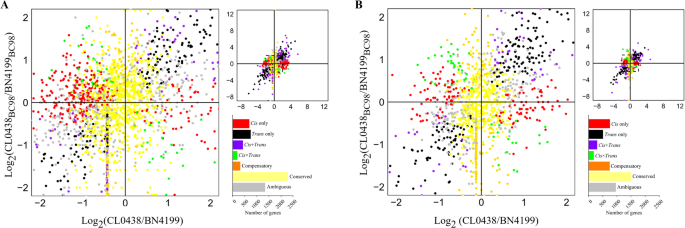
Classification of cis- and trans-regulation in wheat hybrids. The composite plot of the scatter plot and bar graph summarizes allele-specific expression divergence between the parental lines and the F1 hybrids. The genes are color-coded according to the classified cis- and trans-regulatory mechanisms. The bar graphs show the stage-specific gene counts of the regulatory categories detected in the wheat flag leaves at the anthesis (A) and grain-filling (B) stages
Developmental shifts were evident by the enhanced cis-only regulation at the GF stage (30.2% of the significant-effect genes vs. 29.2% at the AN stage), which agreed with the reproductive-phase cis-predominance observed in maize [16]. Moreover, trans-only regulation declined in the wheat hybrids (20.4% at the GF stage vs. 31.5% at the AN stage) (Table S12). Compensatory regulation increased from 5.1% at the AN stage to 15.0% at the GF stage, suggesting that adaptive balancing mechanisms were activated. Notably, the cis-trans regulatory genes at the GF stage presented a 1.3-fold expression bias toward the BN4199BC98 allele, which was also consistent with what was observed among the global expression trends.
Associations between cis- and trans-regulatory divergence and gene expression patterns
In hybrid plants, expression divergence between parental alleles may arise from variations in cis-regulation and/or trans-regulation [55]. This study compared the contributions of these regulatory mechanisms to expression divergence at different developmental stages. At the AN stage, the median absolute expression divergence attributable to cis-only (1.25-fold) and trans-only regulation (1.34-fold) was not significantly different (Wilcoxon test, p = 5.76e − 01) (Fig. 6A). In contrast, cis-only derived divergence significantly exceeded trans-only derived divergence at the GF stage (1.32-fold vs. 1.13-fold; p 6B), with the cis-only contribution (% cis) increasing proportionally to the magnitude of the divergence [16] (Fig. 6C, D). Overall, the developmental transition from trans- to cis-dominant regulatory control likely reflects the biological shift of wheat from growth plasticity at the AN stage to metabolic specialization during the GF stage. This regulatory rewiring balances developmental flexibility (mediated by early trans-regulation) with trait stability (enforced by late cis-regulation), providing a mechanistic foundation for heterosis.
Fig. 6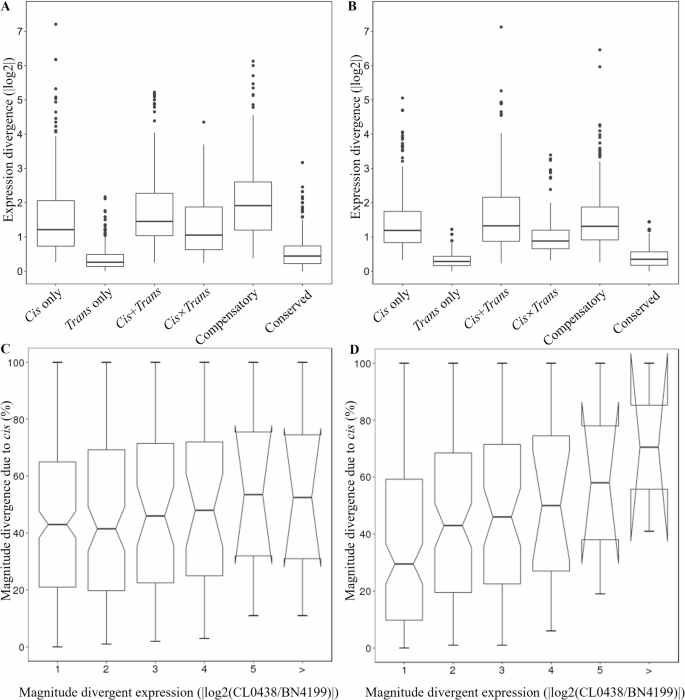
Contributions of cis- and trans-regulation at different developmental stages. The absolute magnitude of the gene expression divergence in the parental lines resulting from cis-only, trans-only, cis + trans, cis × trans, compensatory, and conserved regulation in wheat flag leaves at the anthesis (AN) stage (A) and grain-filling (GF) stage (B). Box-and-whisker plots showing the percent contribution of cis-only regulation (% cis) to total divergence, categorized by the magnitude of parental log2 expression differences (x-axis) in wheat flag leaves at the AN (C) and GF stages (D)
Non-additive gene expression was the most common form of gene expression at the AN stage, particularly within the trans-only (45.9% BN4199-dominant) and cis×trans antagonistic (46.2% BN4199-dominant) categories (Table S16). Cis-only genes presented relatively greater proportions of additive expression (45.3% at the AN stage, increasing to 55.4% at the GF stage). These findings indicate that cis-only regulation prefers additive expression at the GF stage, which likely stabilizes developmental processes by minimizing transcriptional noise and sensitivity to environmental cues. This phenomenon has also been observed in maize [16, 56]. Cis×trans antagonistic regulation had the lowest proportion of additive expression (34.6% at the AN stage, 44.4% at the GF stage) and was the primary driver of non-additive expression. Additionally, cis×trans antagonistic regulation primarily mediated positive overdominance in this study, which is consistent with previous findings that cis×trans antagonism promotes transgressive expression [57]. At the GF stage, trans-only and cis×trans antagonistic regulation exhibited significant biases toward BN4199 (33.0% and 30.6%, respectively), highlighting their importance in BN4199-dominant allele expression.
Collectively, these processes support a two-phase model, which states that transient trans-driven responses at the AN stage shift to stable cis-dominant regulation at the GF stage (Fig. 5A, B and Table S12). The rice HoliB model demonstrated that insufficient genetic backgrounds (e.g., low transcription factor/substrate availability) lead to functional constraints in parental homozygotes, thereby generating non-additive effects in F1 hybrids. Conversely, optimized backgrounds restore additive expression patterns by alleviating these limitations [45]. Our two-phase model extends the rice paradigm by integrating developmental stage-specific transitions in regulation.
Identification of gene co-expression modules in the hybrid
Gene co-expression network analysis enables the identification of functionally coordinated gene modules and reveals how their expression patterns are associated across samples. This approach helps uncover potential biological heterogeneity. Using WGCNA, 23,719 expressed genes were found to be clustered into 18 co-expression modules (Figure S4), representing gene clusters with significantly coordinated expression patterns. We focused subsequent analysis on the Brown and Red modules based on three key criteria (Figure S5): (1) Stage-specific association at the target phase: In the hybrid BC98 at the GF stage, the Brown module exhibited the highest positive ME value (ME = 0.20), while the Red module exhibited the most negative ME value (ME = −0.27); (2) Largest magnitude of dynamic change: The Red module displayed the greatest shift in ME value within hybrid BC98, changing from ME = 0.33 at the AN stage to ME=−0.27 at the GF stage (ΔME = 0.60), the largest ΔME observed among all modules; (3) Significant Genotype × Developmental Stage interaction: Multifactor ANOVA confirmed a highly significant interaction effect for both modules (Brown: F = 12.65, p F = 8.96, p = 0.003), strongly linking their expression patterns to heterosis and developmental transition. This highlights the spatiotemporal regulatory role of these modules in heterosis. These findings also align with previous reports on dynamic co-expression module regulation during developmental transitions in wheat spikes [58], maize inflorescences [59], and rice flowering time [60]. Consequently, the Red and Brown modules were prioritized for subsequent analyses.
The ME value of the Brown module increased from the AN to GF stage (ΔME = + 0.47), accompanied by enrichment in three GO categories: BP associated with “protein transport localization”, CC associated with “vesicle membrane systems”, and MF associated with “GTPase activity” (Fig. 7A, Table S17). These findings collectively revealed a hierarchical regulatory network underlying heterosis formation when plants are transitioning between the AN stage and the GF stage, where GTPase activity (MF) drives vesicle transport (CC), which mediates protein targeting (BP). This coordinated mechanism markedly enhances protein transport efficiency during the GF stage. Its regulatory timing perfectly synchronizes with peak protein synthesis and translocation demands in flag leaves while transitioning to the reproductive phase. The KEGG pathway analysis further corroborated these results, identifying enriched pathways, such as “protein processing in endoplasmic reticulum” (ko04141) and “protein export” (ko03060), which together form a “synthesis-processing-transport” axis (Fig. 7B, Table S18). This network likely enhances photosynthate unloading through ER chaperones and Rab GTPases [61, 62], while its suppression at the AN stage allows pollen development to be prioritized [63]. The Red module displayed significant activation at the AN stage (p 7C, Table S19). Its downregulation at the GF stage coincided with the beginning of leaf senescence [64], suggesting that the source‒sink transitions were mediated by a circadian rhythm (ko04712) through kinase/isomerase activity (Fig. 7D, Table S20) [65, 66].
Fig. 7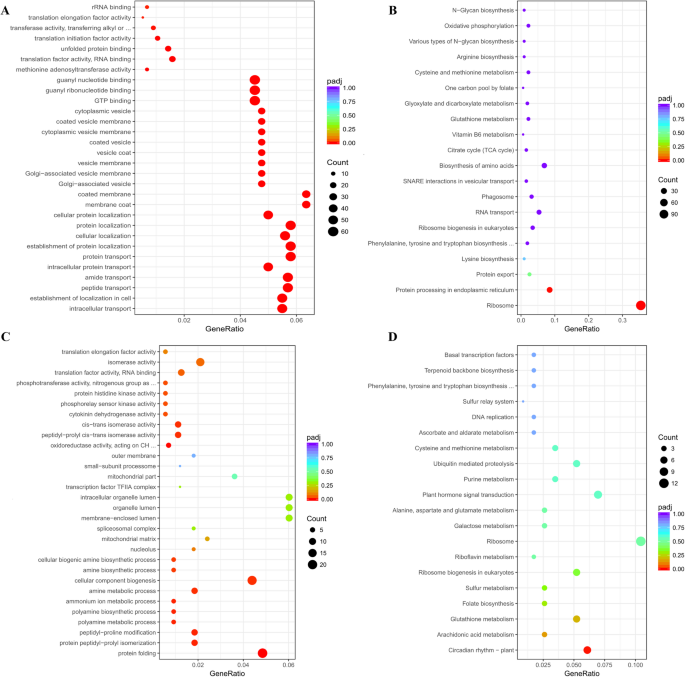
Functional enrichment and pathway analysis of co-expression modules. (A) GO term enrichment of the Brown module; (B) KEGG pathway enrichment bubble plot of the Brown module; (C) GO term enrichment of the Red module; (D) KEGG pathway enrichment bubble plot of the Red module
Identification of hub genes and transcription factors in the target modules
Co-expression network analysis revealed 14 hub genes potentially associated with heterosis, including six genes from the Brown module and eight from the Red module (Fig. 8; Figure S6A, B; Tables S21-S23). In addition, 13 transcription factors (TFs) belong to the AP2/ERF, bHLH, HD-ZIP, MYB, NAC, and Dof families (Table S24). The Brown module included hub genes that regulate protein homeostasis (e.g., TraesCS2D02G057700 encoding a kinase/chaperone [67]) and stress adaptation (TraesCS7A02G242200 encoding an ATPase [68]). Notably, the hub gene HSP90.2-B (TraesCS7B02G149200) orchestrates various biological processes. For example, this gene orchestrates chloroplast precursor protein transport to increase photosynthetic efficiency and grain filling [52], gibberellin-mediated hormone signaling to optimize reproductive development [69], metabolic enzyme stabilization under abiotic stress [70], and molecular scaffolding to coordinate the developmental transition from vegetative to reproductive growth [71]. In this study, HSP90.2-B exhibited BN4199-biased expression at the AN stage and overdominance at the GF stage. These developmental stage-specific dominance dynamics and their functional versatility suggest that HSP90.2-B potentially serves as a key regulator of heterosis and associated yield-related traits in hybrid wheat. The Red module, which is activated at the AN stage, harbors hub genes that primarily govern stress-responsive isomerase activity (TraesCS2D02G276000) [72] and sugar metabolism (TraesCS3B02G067900) [73]. A key AP2/ERF family transcription factor (TF) in the brown module (TraesCS2A02G417300) exhibited BN4199-biased high-parent dominance at the GF stage (Fig. 8), suggesting its role in increasing yield in hybrid plants. Similarly, the AP2/ERF and NAC TFs in the red module coordinate the stress response and transitions between developmental stages [74, 75]. qRT‒PCR validation confirmed the reliability of the RNA-seq data (R² = 0.85) (Figure S7 and Table S25).
Fig. 8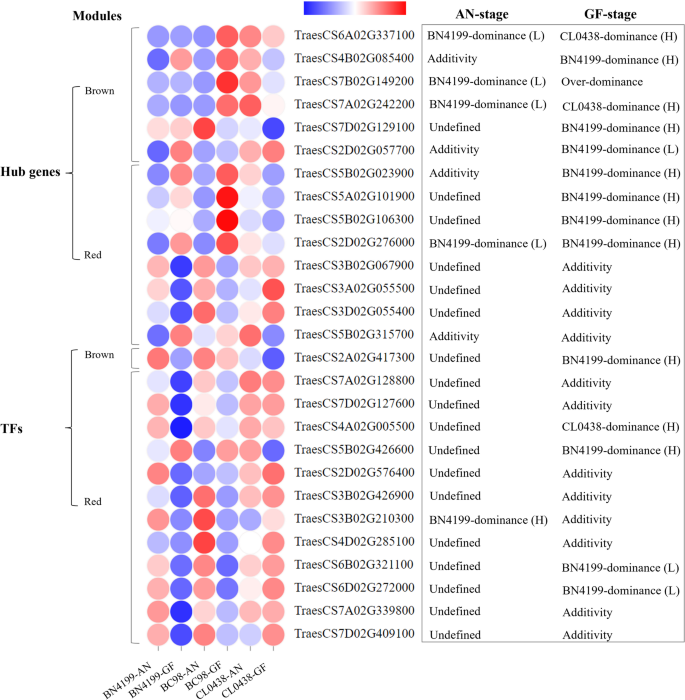
Hub genes and key transcription factors (TFs) identified in the two target modules. L and H between parentheses denote low-parent dominance and high-parent dominance, respectively. The AN and GF stages represent the anthesis and grain-filling stages, respectively. The color gradient from blue to red indicates increasing gene expression levels. The blue‒white‒red gradient represents Z score-normalized expression levels (µ = 0, σ = 1), with blue indicating baseline expression (Z = 0) and red denoting significant upregulation (Z ≥ 2)