Study participants
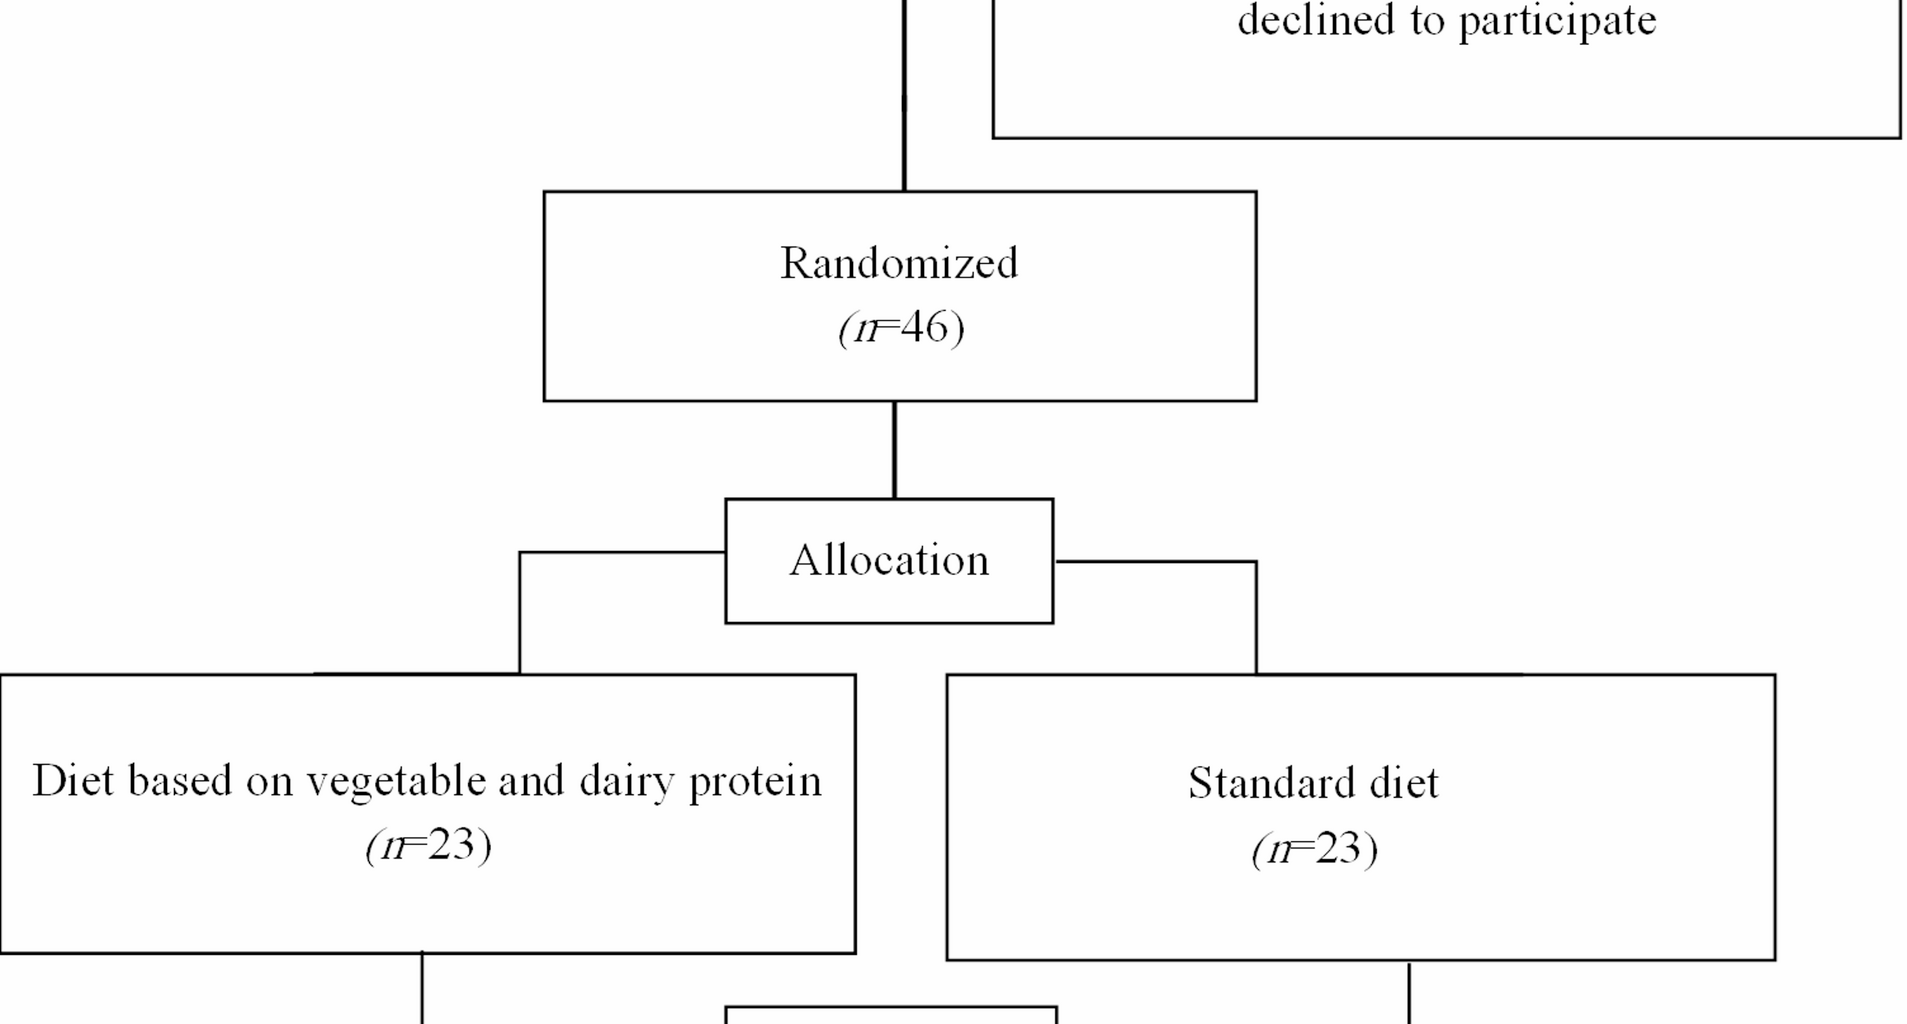
Forty-six patients with cirrhosis, diagnosed for at least six months by a gastroenterologist and aged between 30 and 60 were recruited from the specialized gastroenterology clinics at Shariati and Imam Khomeini hospitals affiliated with Tehran University of Medical Sciences from September 2023 to July 2024. Subjects were not included in the study who had a MELD score greater than 18, Child class C, active gastrointestinal bleeding, serum creatinine higher than 1.5 mg/dl during the last month, consumed alcohol and tobacco in the last six months, or were pregnant or lactating women. Those suffering from diabetes, lung issues, heart failure, mental disorders, liver carcinoma or other cancers, acute viral hepatitis, cholestatic cirrhosis, autoimmune cirrhosis, various autoimmune diseases, hyperuricemia, musculoskeletal disorders, as well as corticosteroid and immunosuppressive consumers were also not included. In the cases of the occurrence of serious complications during the study and the need for hospitalization or liver transplant, changing the patient’s medication protocol, and non-compliance with the study protocol (less than 70% compliance), patients were supposed to be excluded from the study.
Due to the lack of similar studies, the sample size was calculated using G-Power software, equal to 21 people in each group, taking into account the first type error of 5%, the test power of 80%, and the effect size of 0.8 (Cohen’s d), which was increased to 23 people in each group considering the 10% chance of attrition.
Study design
This randomized, placebo-controlled trial, designed according to the CONSORT guidelines, was conducted on 46 individuals with cirrhosis after obtaining written informed consent.
Before the intervention, participants underwent a one-week “run-in” period during which we gathered a range of data such as general demographic information, socioeconomic status, disease history, and the use of drugs, supplements, alcohol, and tobacco using a general questionnaire. Dietary intake was evaluated using a 24-hour food record for three days. The severity of malnutrition in patients was determined using the RFH-SGA questionnaire. At the end of the run-in period and after performing the aforementioned evaluations, the patients were randomly allocated into two groups using stratified block randomization with size two by stratifying age (30–45 and 46–60), sex (male or female), and malnutrition status (adequately nourished, moderately malnourished, or severely malnourished). Stratified randomization was achieved by generating a separate block for each combination of covariates (age, sex, and malnutrition status), and participants were assigned to the appropriate block. Random sequence was generated using the random allocation software (RAS). Malnutrition status was determined by the Royal Free Hospital-Global Assessment (RFH-GA) algorithm [35]. The intervention group received a prescribed diet based on vegetable and dairy protein, and the control group received a prescribed standard isocaloric diet for 12 weeks. The protocol of this study was approved by the Ethics Committee of Tehran University of Medical Sciences (ethics number: IR.TUMS.MEDICINE.REC.1402.048) and was registered at the Iranian Registry of Clinical Trials (ID: IRCT20220426054667N3).
Intervention
According to the latest guidelines, both the intervention and control groups were given the same diet in terms of energy and macronutrients (1.3 times REE energy using the Harris-Benedict formula, 1.2 g of protein per kilogram of body weight, 30% of total calories from fat, and 50–55% of carbohydrates from total calories) but differed in the type of protein consumed. The number of servings of bread, grains, vegetables, fruits, and oils were the same in both groups depending on the estimated energy intake according to the healthy eating pyramid. However, the intervention group was instructed to consume vegetable protein including legumes, soybeans, soy milk, and nuts, whereas, the control group was asked to consume all sources of protein such as legumes, meat, poultry, fish, eggs, and nuts.
Dairy foods that were recommended to consume in both groups included low fat (1.5%) milk or yogurt and low fat, low salt cheese. The control group were instructed to consume two servings as recommended in a standard diet based on the healthy eating pyramid. The intervention group were asked to consume 3–4 servings depending on the required energy intake. The diets were prescribed for 12 weeks in the form of a menu consisting of three meals and four snacks.
Anthropometric measurements
For each patient who participated in the study, anthropometric assessments, including weight, height, BMI, skinfold thickness in the area of the triceps muscle (TSF), mid-arm circumference (MAC), and mid-arm muscle circumference (MAMC), were conducted at the beginning and end of the study. Weight was measured with minimal clothing and no shoes using a digital scale with an accuracy of 100 g. The standing height of the subjects was measured without shoes using a standard height meter with an accuracy of 0.5 cm. The BMI of individuals was also determined by dividing weight in kilograms by the square of height in meters. A caliper was used to measure TSF. First, using the thumb and index finger, a vertical fold of skin and subcutaneous fat was taken in the posterior-middle position of the left arm while standing, and then it was pulled up to separate it from the underlying muscle tissue. The opening of the caliper was placed in contact with the two layers of skin, and 2–4 s after applying full pressure of the caliper, the thickness of the skin was measured in millimeters. For a more accurate measurement, the average of three measurements with an interval of at least 15 s was included. MAC was measured using a tape measure at the midpoint of the left arm, at the distance between the elbow and the tip of the shoulder, with an accuracy of 0.1 cm, while in a standing position, and the person’s hand was free, parallel to the body. To ensure precision, the average of two measurements with an interval of at least 15 s was included. MAMC was calculated using the following formula:
$$\mathrm{MAMC}=\mathrm{MAC}-\left(3.1416\times\mathrm{TSF}\right)$$
Assessment of malnutrition severity
The severity of malnutrition in patients was determined using the RFH-SGA algorithm. This assessment tool is designed for the population of cirrhosis patients, and the severity of malnutrition is determined based on BMI, MAMC, and food intake adequacy.
Nutritional intake assessment
Participants’ dietary intake was evaluated using a three-day food record (including two normal days and one day off) at the beginning and the end of the study. A one-day food record was also taken from the patients at the third, sixth, and ninth weeks to evaluate the compliance with the prescribed diets. If a participant’s energy intake was less than 70% of their total energy expenditure (TEE), they were considered noncompliant. Additionally, for the intervention group specifically, noncompliance also occurred if the ratio of protein intake from vegetable and dairy sources to total protein intake was less than 70%.
To determine the amount of macronutrients and micronutrients received by patients based on food records, Nutritionist IV software (First Databank, Hearst Corp., San Bruno, CA, USA) was utilized according to Iranian foods.
Physical activity assessment
The physical activity of study subjects was recorded at the beginning and end of the study, including one weekday and one day off. The level of physical activity in MET-h/day was calculated based on the activities performed, using the standard MET table.
Biochemical measurements
Blood samples (10 cc) were collected after a 12-h overnight fasting at the beginning and end of the intervention. The blood sample was poured into tubes without an anticoagulant and left for 30 min at the laboratory temperature until the blood clotted. Then the tube was placed in a centrifuge at 3000 rpm for 10 min to separate the serum. After this step, the serum samples were transferred into 200-microliter micro tubes and stored in −80 °C until the analyses were performed. It is worth noting that a serum hemolysis check was performed to assess serum quality. Serum concentrations of inflammatory biomarkers, including tumor necrosis factor-alpha (TNF-α), and interleukin 6 (IL-6) were measured using the enzyme-linked immunosorbent assay (ELISA) test with the commercial kits (Karmania Pars Gene Co., Rafsanjan, Iran) with a sensitivity of 2 pg/ml, inter-assay precision of 2+, inter assay precision of %2.5, and intra assay precision of %3.7; and total oxidant status (TOS) with the sensitivity of 23 µmol/ml, inter assay precision of %3.6, and intra assay precision of %4.5.
The concentration of serum creatinine was measured using the colorimetric/Jaaffe method (Biorex Fars, Shiraz, Iran). Serum total bilirubin concentration was also measured using the Jendrassik-Grof method (Biorex Fars, Shiraz, Iran). To measure prothrombin time (PT), tissue thromboplastin and calcium ions were added to the patient’s plasma, and the time taken for plasma coagulation was measured. Since the patient’s PT test was performed with the reference tissue reagent, the ratio of the patient’s PT to the control is equal to the INR.
Statistical analysis
SPSS software version 26, was applied for all analyses. Normal distribution of the data was evaluated using the Kolmogorov-Smirnov test. The Paired-Samples t-test or its non-parametric equivalent, the Wilcoxon Signed-Rank test, was used to assess the differences in each group. For comparing quantitative variables between the study groups, the independent samples t-test or Mann-Whitney U test was applied, while the chi-square and Mann-Whitney U test were applied for nominal and ordinal variables, respectively. Analysis of covariance (ANCOVA) was applied to determine the impact of the intervention when adjusted for baseline values for normally distributed variables and Quade Nonparametric ANCOVA for non-normally distributed variables. Quantitative variables with normal distribution were represented as mean ± standard error (SE), while median (25-75th interquartile range) was reported for those with non-normal distribution. Also, the qualitative data were reported as frequency and percentage. A p-value of