A total of 125 patients were followed up over 40 days. Of these, 56 (44.8%) were females and 67 (53.6%) were males. The proportion of deaths was marginally higher among males (56.7%) compared to females (50.0%), although this difference did not reach statistical significance (p = 0.453). The median age of surviving (censored) patients was 41 years (interquartile range (IQR): 30–58), compared to 50 years (IQR: 34–66) among those who died (p = 0.097). No statistically significant differences in survival status were observed across age groups (p = 0.520).
In univariate comparisons, patients who died exhibited higher median PCT levels (3.2 ng/ml, IQR: 0.7–24.6) compared to survivors (0.5 ng/ml, IQR: 0.2–1.3; p 3/µL; p 3/µL; p p p = 0.491), monocyte (p = 0.219), or lymphocyte counts (p = 0.084) (Table 2).
Table 2 Sociodemographic and clinical characteristics of patients followed for 40 daysICU sepsis survival estimates
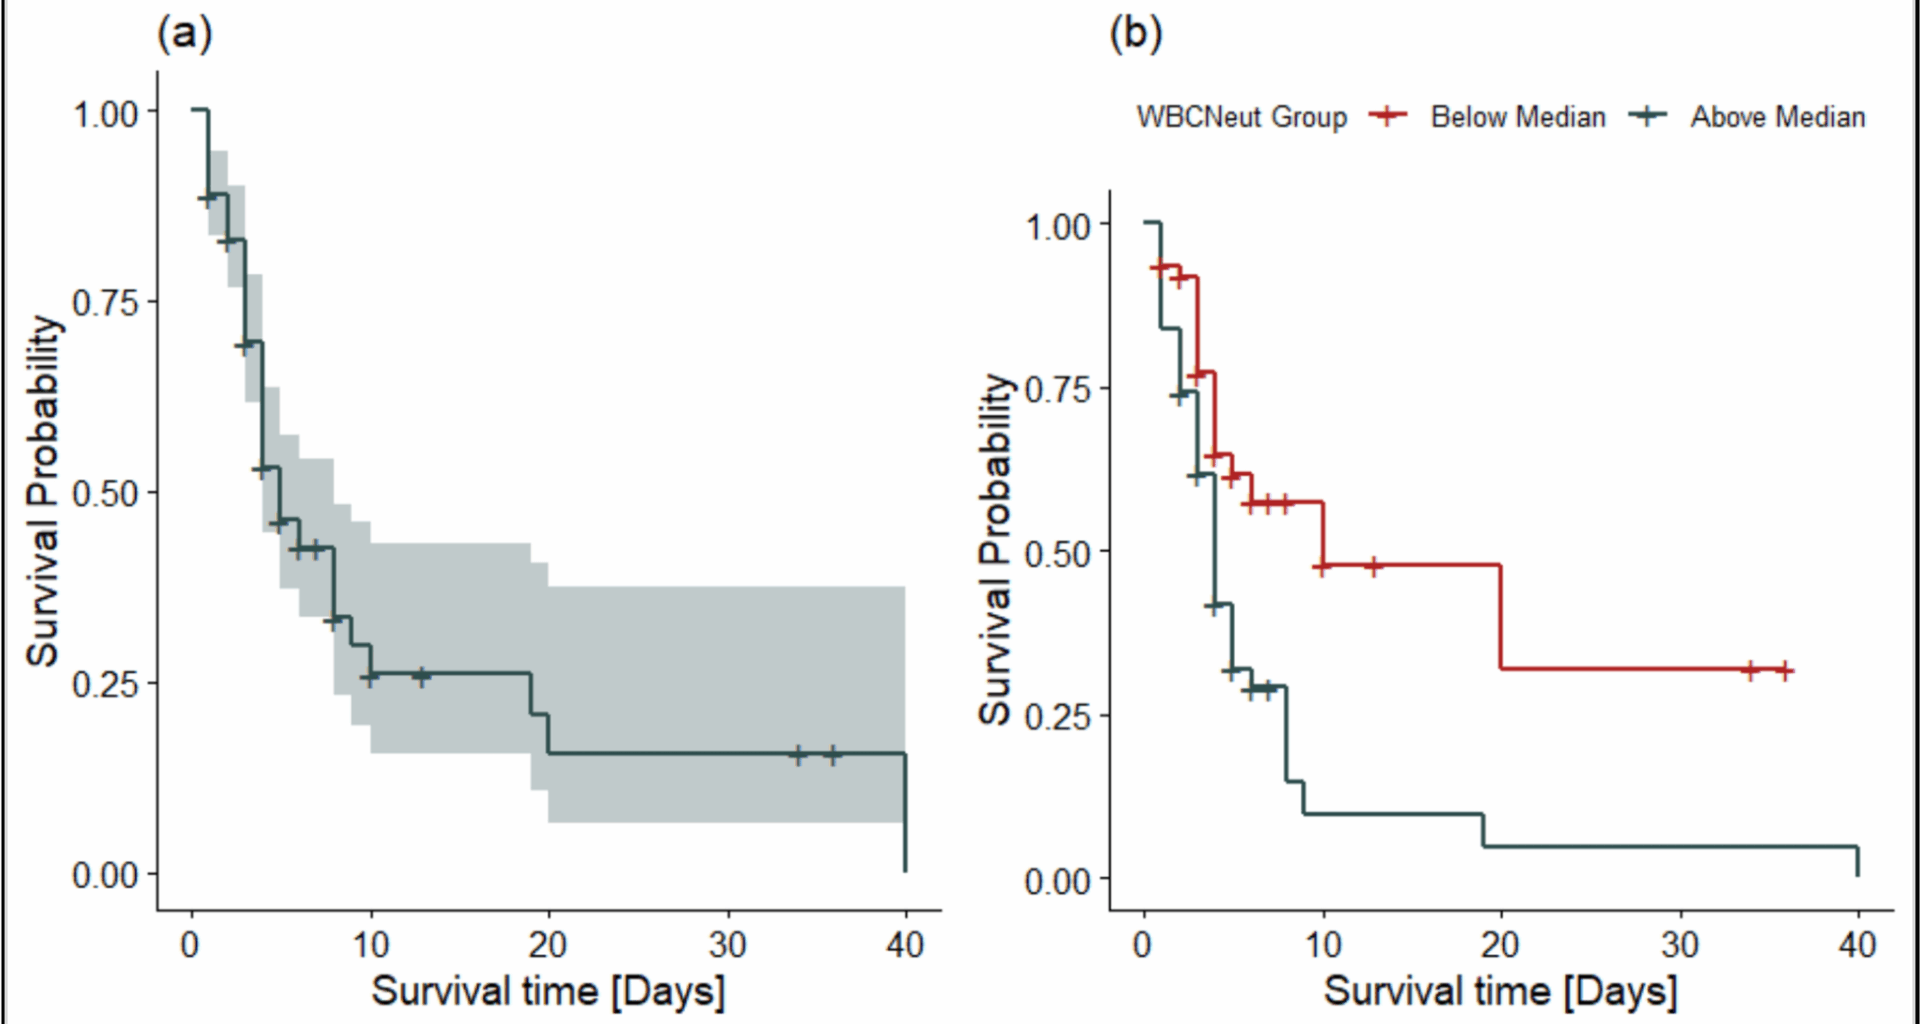
The Kaplan–Meier survival curve (Fig. 1a) depicts the probability of survival over time among ICU patients diagnosed with sepsis. Survival probability declined sharply within the first 10 days, indicating a high early mortality risk. Beyond day 10, the survival curve plateaued, suggesting that patients who survived the initial critical phase faced a reduced subsequent risk of death. By day 20, the estimated survival probability was approximately 25%. The 95% confidence intervals widened at later time points due to the diminishing number of patients at risk. In Fig. 1b, the survival curves demonstrate notable differences between neutrophil strata. Although the survival curve for patients with neutrophil counts below the median initially dipped below 100% due to early adverse events, death within 24 h of enrollment, these individuals demonstrated consistently higher survival probabilities throughout the follow-up period. In contrast, patients with higher neutrophil counts showed a steeper early decline in survival, indicating increased early mortality risk.
Fig. 1
Kaplan–Meier survival curves for ICU patients with sepsis: a Overall Kaplan–Meier survival estimate shows that survival probability declined sharply within the first 10 days, indicating a high early mortality risk. b Kaplan–Meier survival estimates stratified by neutrophil count show that patients with higher neutrophil counts experience a steeper early decline in survival, indicating an increased risk of early mortality
Multicollinearity assessment
We assessed multicollinearity among covariates using variance inflation factors. All VIFs were below 2.5 (mean VIF = 1.85), indicating no evidence of problematic collinearity (Table 3). The highest VIF was observed for the elderly age group (VIF = 2.41), which remained within acceptable thresholds. Moderate collinearity was noted between TotalWBC and WBCNeut. Given the stronger biological plausibility and greater clinical specificity of neutrophil count as an infection- and sepsis-related marker, WBCNeut was retained in the primary Cox regression models. To account for the potential contribution of overall leukocyte burden, TotalWBC was evaluated in separate models as part of the sensitivity analyses, where it replaced WBCNeut in otherwise equivalent model specifications.
Table 3 VIF for Cox model predictors of survivalProportional hazards assumption test
We assessed the proportional hazards assumption using Schoenfeld residuals for each covariate and globally. None of the individual variables, including sex, age group, PCT, neutrophil count (WBCNeut), monocytes, or NLR, showed significant deviation from proportionality (all p > 0.05). The global test (χ2 = 4.23, df = 8, p = 0.836) indicated no evidence of violation of the proportional hazards assumption for the model as a whole.
Time-dependent discrimination of predictive models for ICU mortality
Time-dependent AUCs were constructed to assess and compare the discriminative performance of ten multivariable Cox models (all adjusted to age and sex) across the 40-day follow-up period. As illustrated in Fig. 2 (also Supplementary Table S1), full models incorporating both clinical variables and either neutrophil count or total WBC count consistently yielded the highest and most stable AUCs, particularly during the first 10 days (AUC ~ 0.76–0.78), followed by a gradual decline thereafter. The minimal model, which excluded biomarker data, exhibited the weakest performance throughout, with AUCs falling below 0.5 after day 20. Models combining PCT with neutrophils or WBC outperformed single-biomarker or PCT-only models, especially in early follow-up. The overall decline in AUCs over time likely reflects the waning predictive value of baseline measurements and increasing variability in clinical outcomes.
Fig. 2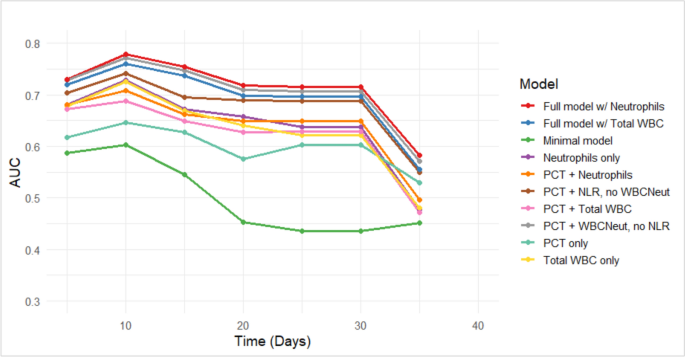
Time-dependent AUC curves for eight Cox models predicting ICU mortality over 40 days
ROC curve analysis of sepsis biomarkers
To evaluate short-term predictive accuracy, ROC curves for Models 5–10 were evaluated at days 6, 10, and 15. The time-dependent AUCs reflect the probability of death by each time point, derived from Cox models predicting ICU mortality over a 40-day follow-up period (Fig. 2). Multiple intervals were explored, and these specific points were chosen because they consistently demonstrated higher discriminative performance. Clinically, they correspond to approximately the end of the first week, mid-second week, and end of the second week of ICU admission, periods that often reflect patient reassessment in critical care. This approach allowed for the evaluation of model discrimination at time intervals that are meaningful for tracking changes in patient risk over the early course of ICU admission, without implying these are standardized decision points. The analysis showed that Models 9 and 10, incorporating clinical data plus neutrophil count (Model 9) or total WBC count (Model 10), consistently outperformed simpler models. At days 6 and 10, both achieved AUCs of 68–71%, indicating good short-term discriminative performance. Although predictive accuracy declined slightly by day 15 (AUC ~ 66%), these models remained comparatively stable, highlighting the added value of integrating multiple biomarkers for early sepsis mortality risk stratification (Fig. 3). A sensitivity analysis of Cox regression models using various biomarker combinations is provided in Supplementary Table S1.
Fig. 3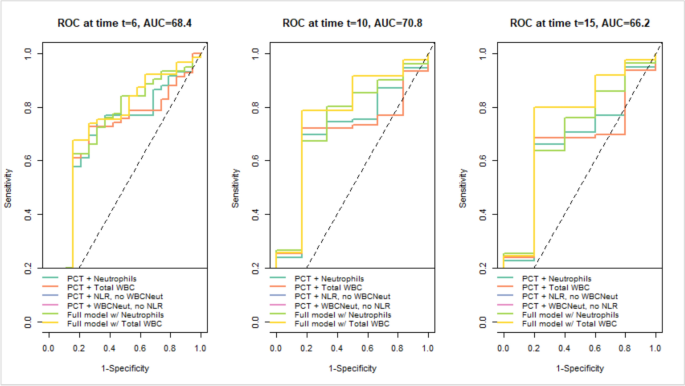
ROC curves showing sensitivity vs. specificity for Models 5–10 at days 6, 10, and 15
Predictors of ICU mortality in sepsis
In the final multivariable Cox regression model 5, elevated neutrophil counts emerged as the only independent predictor of mortality among ICU patients (Table 4). After adjusting for key demographic and biomarker covariates, higher neutrophil counts were strongly associated with increased ICU mortality. Specifically, a ~threefold increase in neutrophil count was associated with a twofold higher hazard of death [aHR (adjusted hazard ratio) = 1.99, 95% CI 1.37–2.88; p 4).
Table 4 Biomarker and demographic factors associated with survival in ICU patientsModel-building process
We conducted a sensitivity analysis to evaluate the robustness and consistency of Cox regression models under varying combinations of covariates, with a particular focus on WBC markers. All models included sex and age group as adjustment variables; however, these demographic covariates consistently showed non-significant associations with survival, suggesting limited predictive utility in this context.
In contrast, models incorporating neutrophil count (WBCNeut), NLR, or total white blood cell count (total WBC) demonstrated statistically significant positive associations with increased hazard of death, indicating that elevated levels of these markers may serve as useful indicators of poor prognosis. Specifically, WBCNeut was significantly associated with mortality in Models 3, 5, and 9, while total WBC showed similar associations in Models 4 and 6, and NLR in Model 7.
Combination models (Models 5–10), which included Procalcitonin (PCT) alongside WBCNeut, NLR, or total WBC, generally achieved better model fit, as reflected in higher log-likelihood values (ranging from − 226.349 to − 230.581). Models 9 and 10 demonstrated the strongest predictive performance, consistent with ROC curve analysis showing higher AUC values (~ 68–71%), indicating moderate-to-good discrimination. Although Model 7 (log-likelihood = − 226.787) fit the data slightly better, Model 5 (AIC = 467.367; log-likelihood = − 227.684) was selected for the final analysis due to its lower AIC and more consistent, interpretable predictor estimates, providing a robust model. Importantly, the key findings regarding WBC-related markers were consistent across models, supporting the robustness and reliability of the results.