Overview
At the end of the second quarter of 2025, the general government gross debt to GDP ratio in the euro area (EA20) stood at 88.2%, increasing when compared with 87.7% at the end of the first quarter of 2025. In the EU, the ratio also increased from 81.5% to 81.9%.
Compared with the second quarter of 2024, the government debt to GDP ratio increased in both the euro area (from 87.7% to 88.2%) and the EU (from 81.2% to 81.9%).
At the end of the second quarter of 2025, the general government debt was made up of 84.2% debt securities in the euro area and 83.7% in the EU, 13.2% loans in the euro area and 13.8% in the EU and 2.5% currency and deposits both in the euro area and in the EU.
Due to the involvement of EU Member States’ governments in lending to certain Member States, quarterly data on intergovernmental lending (IGL) are also published. The IGL as percentage of GDP at the end of the second quarter of 2025 stood at 1.4% in the euro area and at 1.2% in the EU.
These data are released by Eurostat, the statistical office of the European Union.
Euro area and EU general government gross debt
2024Q2
2025Q1p
2025Q2p
Euro area
(million euro)
13 098 702
13 479 829
13 676 633
(% of GDP)
87.7
87.7
88.2
(million euro)
333 380
347 548
348 060
(% of total debt)
2.5
2.6
2.5
(million euro)
11 006 069
11 343 303
11 518 957
(% of total debt)
84.0
84.2
84.2
(million euro)
1 759 252
1 788 979
1 809 617
(% of total debt)
13.4
13.3
13.2
(million euro)
224 235
215 784
216 518
(% of GDP)
1.5
1.4
1.4
EU
(million euro)
14 302 996
14 827 895
15 047 308
(% of GDP)
81.2
81.5
81.9
(million euro)
358 436
376 029
374 933
(% of total debt)
2.5
2.5
2.5
(million euro)
11 950 659
12 390 419
12 591 907
(% of total debt)
83.6
83.6
83.7
(million euro)
1 993 901
2 061 448
2 080 469
(% of total debt)
13.9
13.9
13.8
(million euro)
224 235
215 784
216 518
(% of GDP)
1.3
1.2
1.2
Government debt at the end of the second quarter of 2025 by Member State
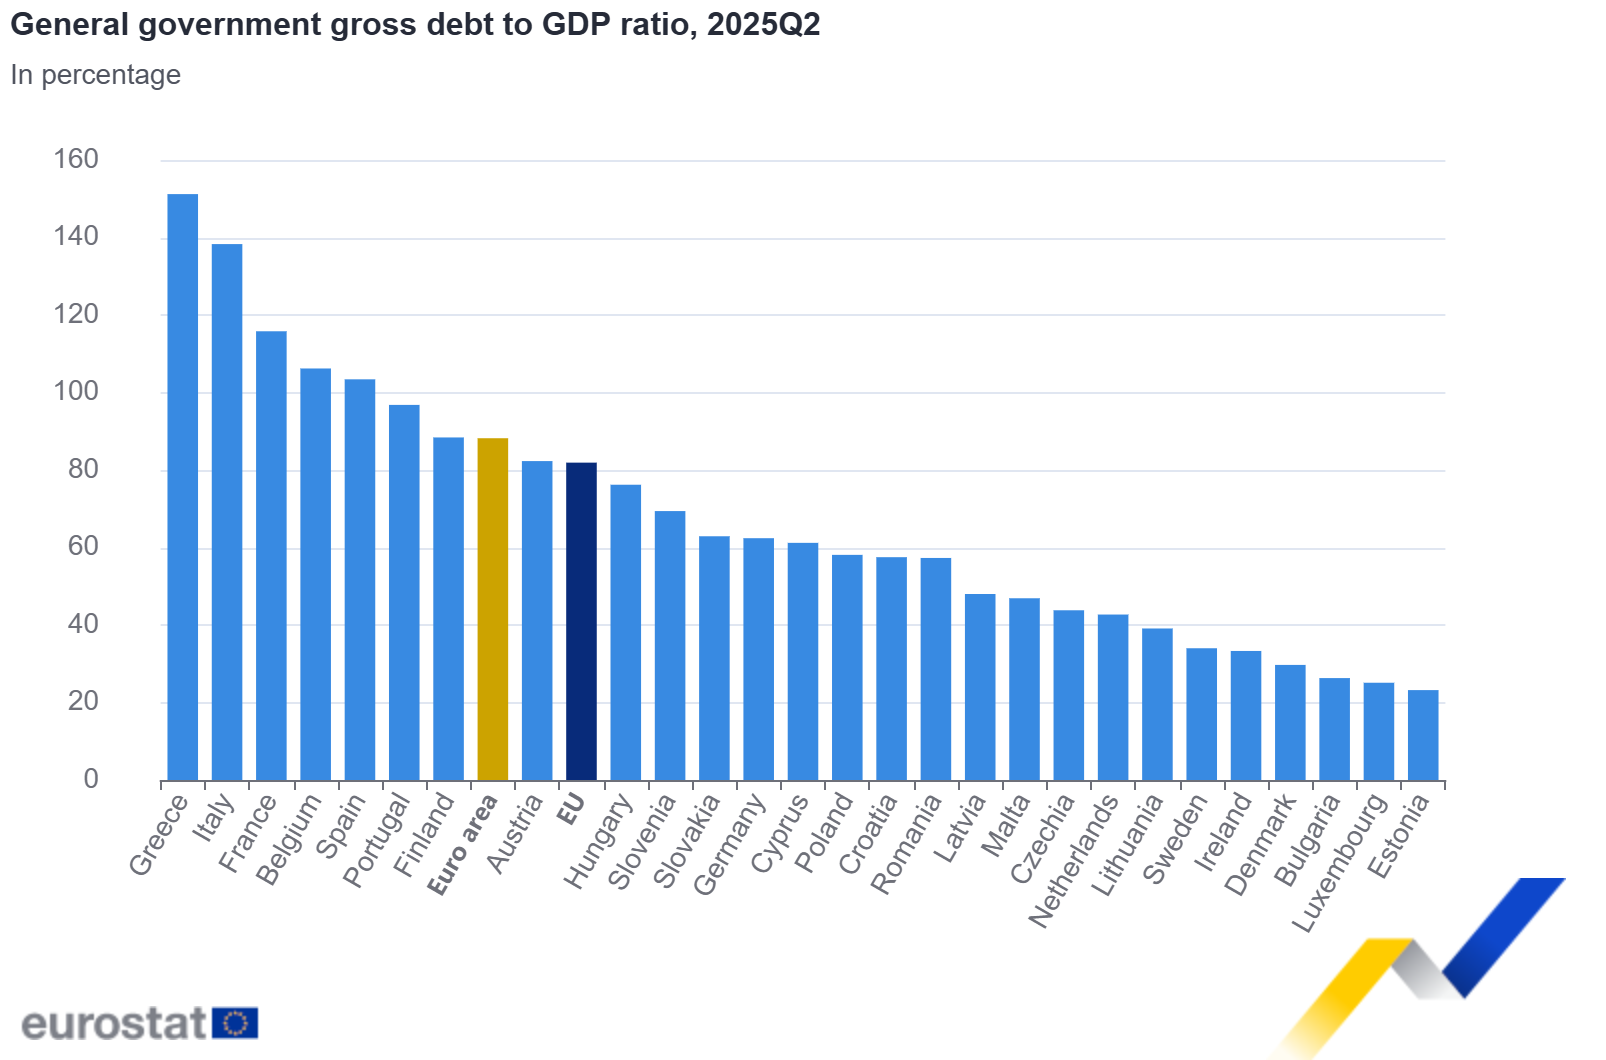
The highest ratios of government debt to GDP at the end of the second quarter of 2025 were recorded in Greece (151.2%), Italy (138.3%), France (115.8%), Belgium (106.2%) and Spain (103.4%), and the lowest ratios were recorded in Estonia (23.2%), Luxembourg (25.1%), Bulgaria (26.3%), and Denmark (29.7%).

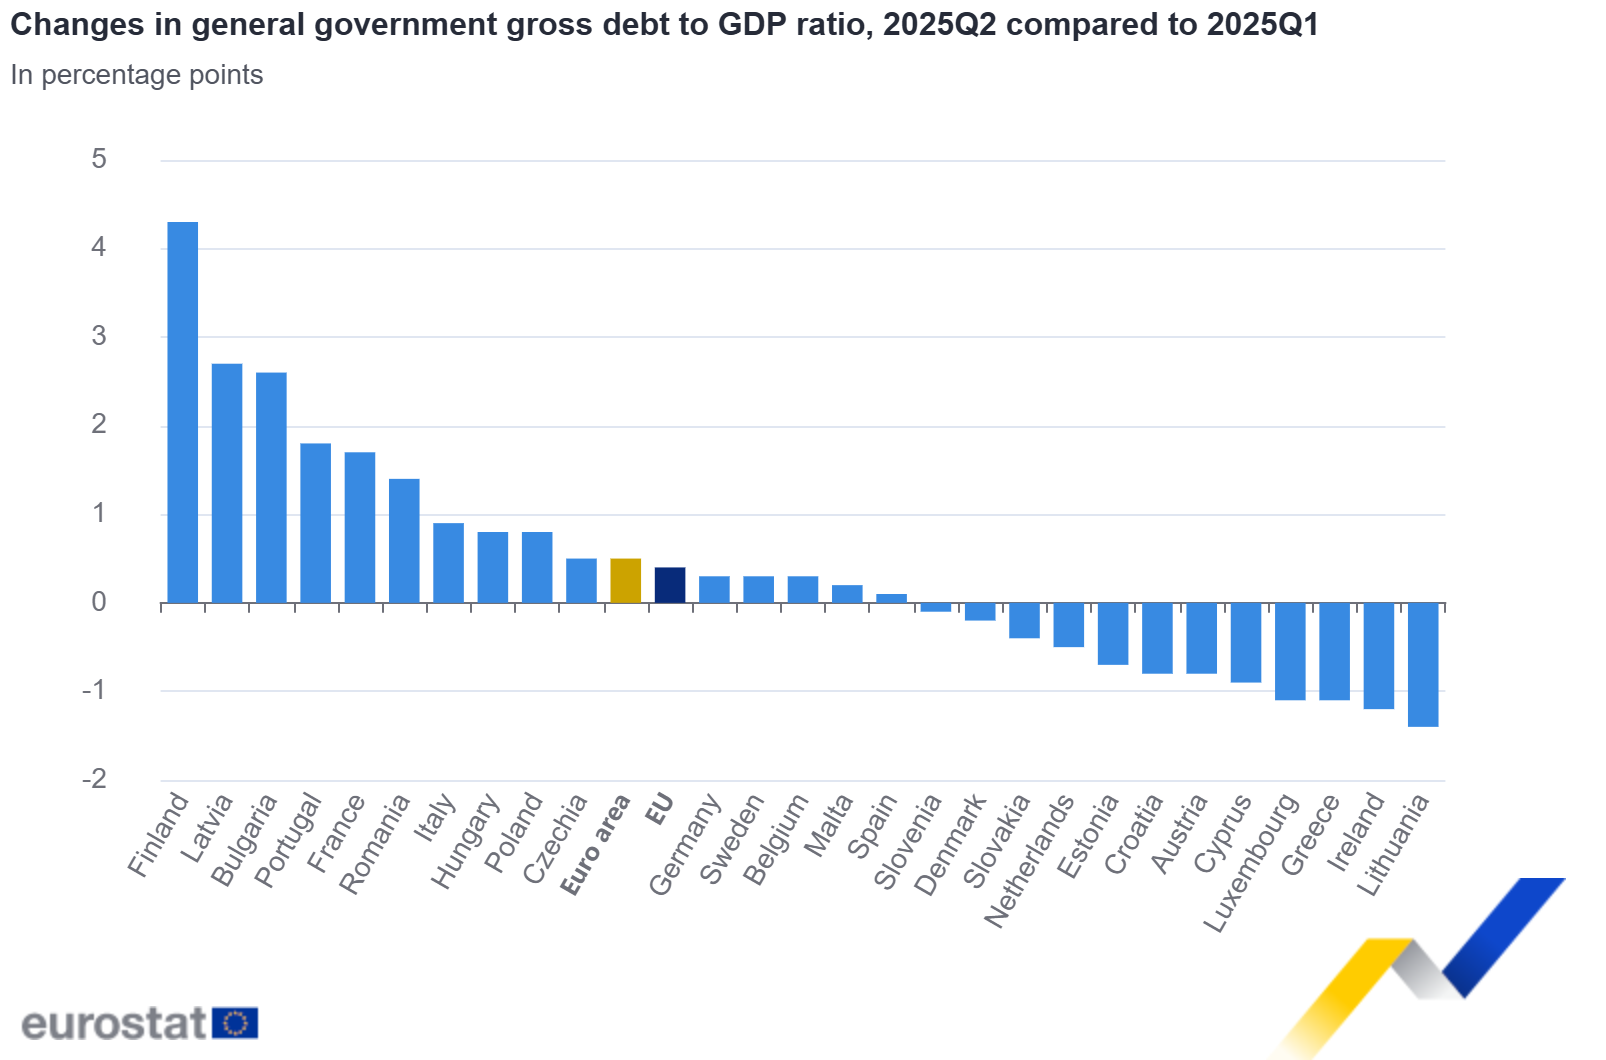
Compared with the first quarter of 2025, fifteen Member States registered an increase in their debt to GDP ratio at the end of the second quarter of 2025 and twelve registered a decrease. The largest increases in the ratio were observed in Finland (+4.3 percentage points – pp), Latvia (+2.7 pp), Bulgaria (+2.6 pp), Portugal (+1.8 pp), France (+1.7 pp) and Romania (+1.4 pp). The largest decreases were recorded in Lithuania (-1.4 pp), Ireland (-1.2 pp), Greece and Luxembourg (both -1.1 pp).

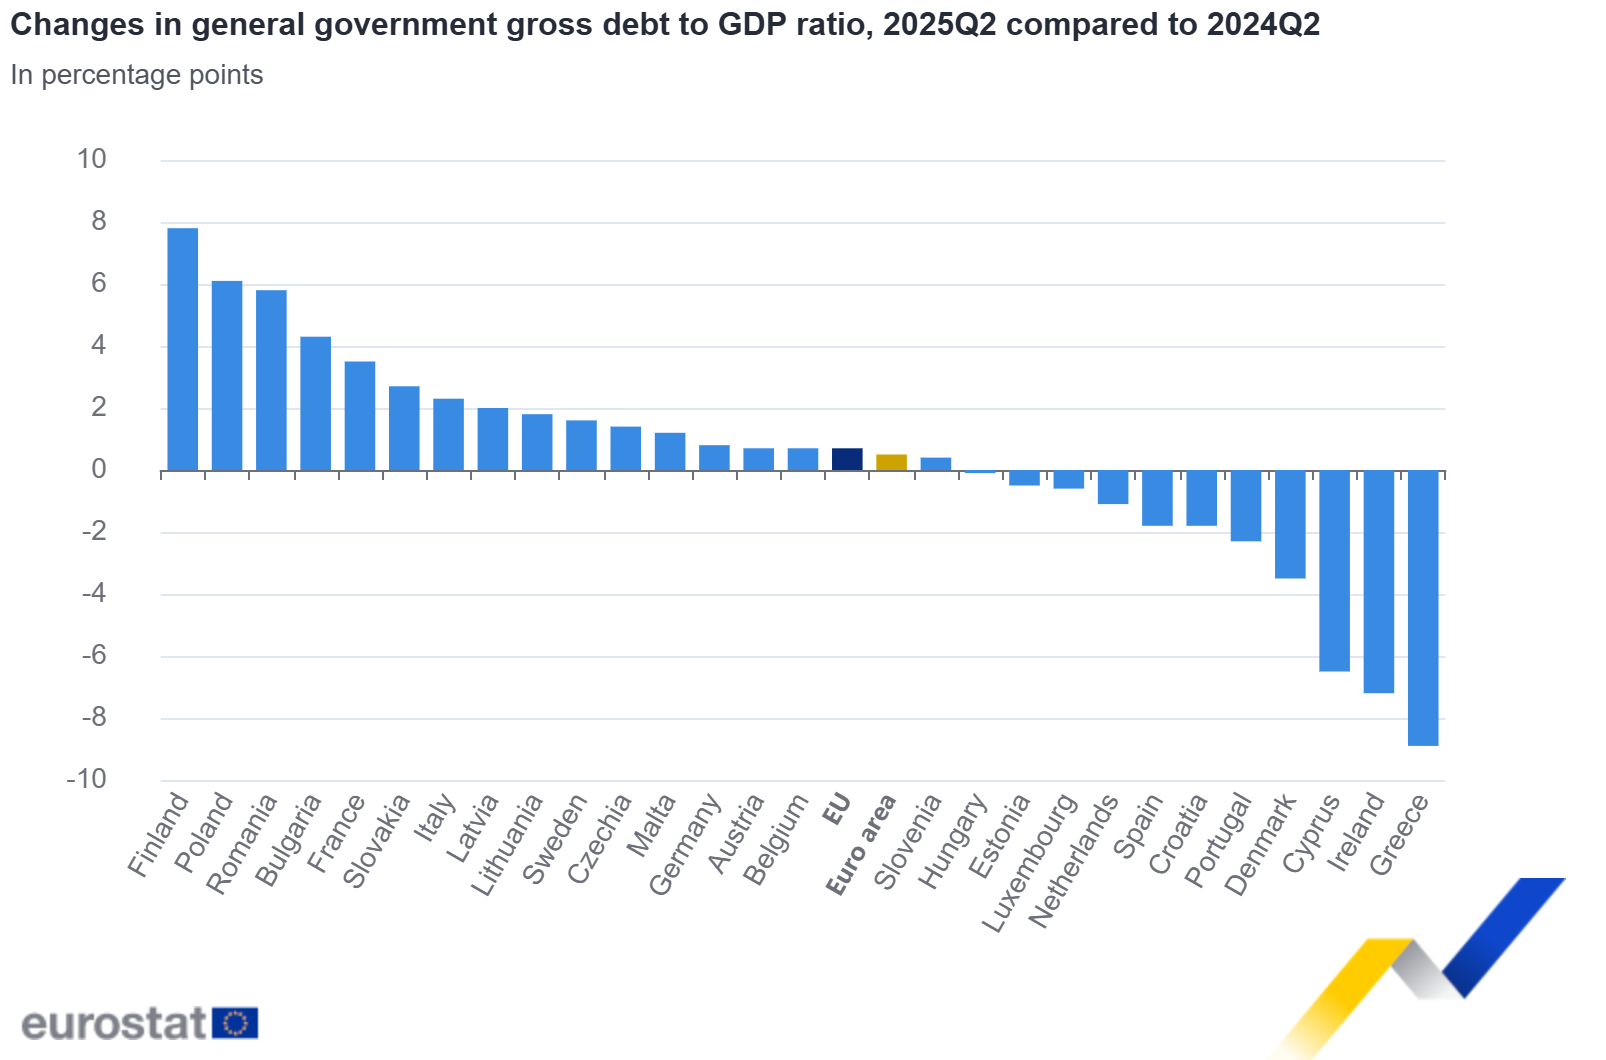
Compared with the second quarter of 2024, sixteen Member States registered an increase in their debt to GDP ratio at the end of the second quarter of 2025 and eleven Member States registered a decrease. The largest increases in the ratio were recorded in Finland (+7.8 pp), Poland (+6.1 pp), Romania (+5.8 pp), Bulgaria (+4.3 pp), France (+3.5 pp), Slovakia (+2.7 pp), Italy (+2.3 pp), and Latvia (+2.0 pp). The largest decreases were observed in Greece (-8.9 pp), Ireland (-7.2 pp), Cyprus (-6.5 pp), Denmark (-3.5 pp) and Portugal (-2.3 pp).

Tables
General government gross debt by Member State
General government gross debt
Millions of national currency
% of GDP
Difference in pp of GDP 2025Q2p compared with:
2024Q2
2025Q1p
2025Q2p
2024Q2
2025Q1p
2025Q2p
2024Q2
2025Q1p
EUR
13 098 702
13 479 829
13 676 633
87.7
87.7
88.2
0.5
0.5
EUR
14 302 996
14 827 895
15 047 308
81.2
81.5
81.9
0.7
0.4
EUR
644 365
663 098
670 665
105.5
106.0
106.2
0.7
0.3
BGN
42 812
48 986
55 518
22.0
23.7
26.3
4.3
2.6
CZK
3 320 798
3 535 088
3 627 011
42.4
43.3
43.8
1.4
0.5
DKK
928 561
888 435
887 742
33.1
29.9
29.7
-3.5
-0.2
EUR
2 635 162
2 701 530
2 733 395
61.6
62.0
62.4
0.8
0.3
EUR
9 199
9 626
9 453
23.6
23.9
23.2
-0.5
-0.7
EUR
215 161
206 218
207 243
40.5
34.5
33.3
-7.2
-1.2
EUR
369 406
366 324
368 609
160.1
152.4
151.2
-8.9
-1.1
EUR
1 625 668
1 667 376
1 690 922
105.2
103.4
103.4
-1.8
0.1
EUR
3 229 743
3 345 421
3 416 302
112.3
114.1
115.8
3.5
1.7
EUR
49 112
50 632
50 932
59.3
58.3
57.5
-1.8
-0.8
EUR
2 954 423
3 033 486
3 071 288
136.0
137.4
138.3
2.3
0.9
EUR
22 858
21 838
21 774
67.7
62.1
61.2
-6.5
-0.9
EUR
18 190
18 493
19 776
46.0
45.3
48.0
2.0
2.7
EUR
28 363
32 405
31 815
37.2
40.4
39.1
1.8
-1.4
EUR
21 710
22 697
21 870
25.7
26.1
25.1
-0.6
-1.1
HUF
59 553 660
62 380 606
63 987 465
76.3
75.4
76.2
-0.1
0.8
EUR
10 107
10 935
11 118
45.7
46.7
46.9
1.2
0.2
EUR
475 352
490 770
491 700
43.8
43.2
42.7
-1.1
-0.5
EUR
394 810
413 150
412 287
81.5
83.1
82.3
0.7
-0.8
PLN
1 824 820
2 123 932
2 186 159
52.0
57.3
58.1
6.1
0.8
EUR
276 828
278 304
287 133
99.1
95.0
96.8
-2.3
1.8
RON
860 398
998 186
1 039 857
51.5
55.9
57.3
5.8
1.4
EUR
45 468
47 090
47 494
69.0
69.5
69.4
0.4
-0.1
EUR
76 918
82 901
83 484
60.2
63.2
62.9
2.7
-0.4
EUR
220 083
233 310
245 883
80.6
84.2
88.4
7.8
4.3
SEK
2 023 332
2 160 151
2 191 556
32.3
33.7
34.0
1.6
0.3
NOK
2 224 421
2 398 197
2 302 363
43.5
45.1
43.2
-0.2
-1.9
General government gross debt by Member State
Components of general government gross debt, in % of GDP
IGL (assets)
Currency and deposits
Debt Securities
Loans
% of GDP
2025Q2p
2025Q2p
2025Q2p
2025Q2p
2.2
74.3
11.7
1.4
2.0
68.5
11.3
1.2
0.3
91.1
14.8
1.3
–
23.1
3.2
0.0
0.7
39.5
3.6
0.0
0.6
26.9
2.1
0.0
0.4
49.5
12.5
1.4
0.1
13.3
9.7
1.2
4.1
22.3
7.0
0.0
3.1
40.3
107.8
0.0
0.3
92.6
10.5
1.7
1.4
103.9
10.5
1.6
0.1
42.6
14.8
0.0
8.7
116.1
13.5
1.9
0.5
35.9
24.8
0.9
1.4
42.8
3.8
0.0
0.1
32.2
6.8
0.0
0.4
21.0
3.7
0.7
0.9
66.7
8.6
0.0
1.8
40.5
4.6
0.9
0.1
36.4
6.2
1.1
0.4
73.1
8.8
1.3
0.3
43.3
14.5
0.0
16.7
56.7
23.4
0.2
1.1
47.1
9.0
0.0
0.3
59.0
10.0
1.6
0.1
56.2
6.6
1.5
0.3
66.8
21.4
1.5
2.3
19.9
11.8
0.0
–
16.3
27.0
–
Notes for users
Methods and definitions
Quarterly data on government debt are collected from the Member States according to European System of Accounts (ESA 2010), see Annex B, ESA 2010 transmission programme, and refer to the Maastricht debt definition, used in the context of the Excessive Deficit Procedure (EDP). Annual EDP data, last notified in October 2025, are the subject of a thorough verification by Eurostat.
The general government gross debt is defined as the consolidated gross debt of the whole general government sector outstanding at the end of the quarter (at face value). General government debt consists of liabilities of general government in the following financial instruments: currency and deposits (AF.2), debt securities (AF.3) and loans (AF.4), as defined in ESA 2010.
The debt to GDP ratio is calculated for each quarter using the sum of quarterly GDP for the four last quarters. Quarterly data on GDP are the most recent ones transmitted by the EU Member States. While quarterly debt figures are consistent with annual debt figures at coinciding publications, differences between annual and quarterly GDP figures occur for Greece.
For the purpose of proper consolidation of general government debt and to provide users with information, Eurostat publishes data on government loans (IGL) to other EU governments. The concepts and definitions are based on ESA 2010 and on the rules relating to the statistics for the EDP. The data covered is the stock of loans related to claims on other EU Member States, including loans made through the European Financial Stability Facility (EFSF). The valuation basis is the stock of loans at face value outstanding at end of each quarter. From the first quarter of 2011 onwards, the intergovernmental lending figures relate mainly to lending to Greece, Ireland and Portugal and include loans made by the EFSF.
For stock data such as general government debt, end of period exchange rates are used in the compilation of the EU aggregates. For flow data, such as GDP, average exchange rates are used. The EU aggregates, denominated in euro, can fluctuate as a result of exchange rate movements between the euro and other EU currencies.
All quarterly government finance statistics data for the first two quarters of 2025 have been labelled provisional. Country-specific metadata are published.
Geographical Information
Euro area (EA20): Belgium, Germany, Estonia, Ireland, Greece, Spain, France, Croatia, Italy, Cyprus, Latvia, Lithuania, Luxembourg, Malta, the Netherlands, Austria, Portugal, Slovenia, Slovakia and Finland.
European Union (EU27): Belgium, Bulgaria, Czechia, Denmark, Germany, Estonia, Ireland, Greece, Spain, France, Croatia, Italy, Cyprus, Latvia, Lithuania, Luxembourg, Hungary, Malta, the Netherlands, Austria, Poland, Portugal, Romania, Slovenia, Slovakia, Finland and Sweden.
For more information
