Plant lines and growth conditions
The plant lines used in this study were derived from A. thaliana wild-type accessions—Col-0 (Columbia-0), Ler (Landsberg erecta), Ws-2 (Wassilewskija-2), Cvi-0 (Cape Verde Islands), and C24—to generate MCviPI transgenic lines. Transgenic and WT seeds were grown at 20 °C in long photoperiod conditions (16-h/8-h light/dark cycles). Seeds were sterilized with 10% sodium hypochlorite (V/V) for 5 min and washed in sterile water thoroughly five times. Plant growth media were prepared with half-strength MS medium (Murashige and Skoog, Duchefa Biochemie), 1% sucrose (Sigma-Aldrich) and 0.8% phytoagar (Duchefa Biochemie). Seedlings of MCviPI transgenic and control plants were subjected to β-estradiol induction and mock treatment for 6, 12, and 24 h; the stock of estradiol was 10 mM in DMSO, with mock being DMSO in water. Eight-day-old seedlings were transferred to Whatman paper soaked with either induction or mock solution in plates, so that the plants were in contact with the solution and to avoid drought stress. The plates were wrapped with cling film before being moved to a growth cabinet.
Generation and selection of indMCviPI transgenic lines
We modified the plant transformation vector pMDC7, which enables the controlled ectopic expression upon exposure to β−17-estradiol [38]. We removed the OLE1-RFP visual seed selection reporter after digestion of the pUbiCAS9-Red [39] with SpeI and PacI, and overhangs were blunted. The OLE1-RFP insert was cloned in pMDC7 previously digested PmeI restriction site, to generate the pMDC7-OLE1. The MCviPI sequence was codon optimized for Arabidopsis and chemically synthesized (Genosys) including a nuclear localization signal and a HA-tag at the N and C terminus, respectively. The M.CviPI transgene was cloned into pDNOR207 and then cloned into pMDC7-OLE1 by Gateway recombination.
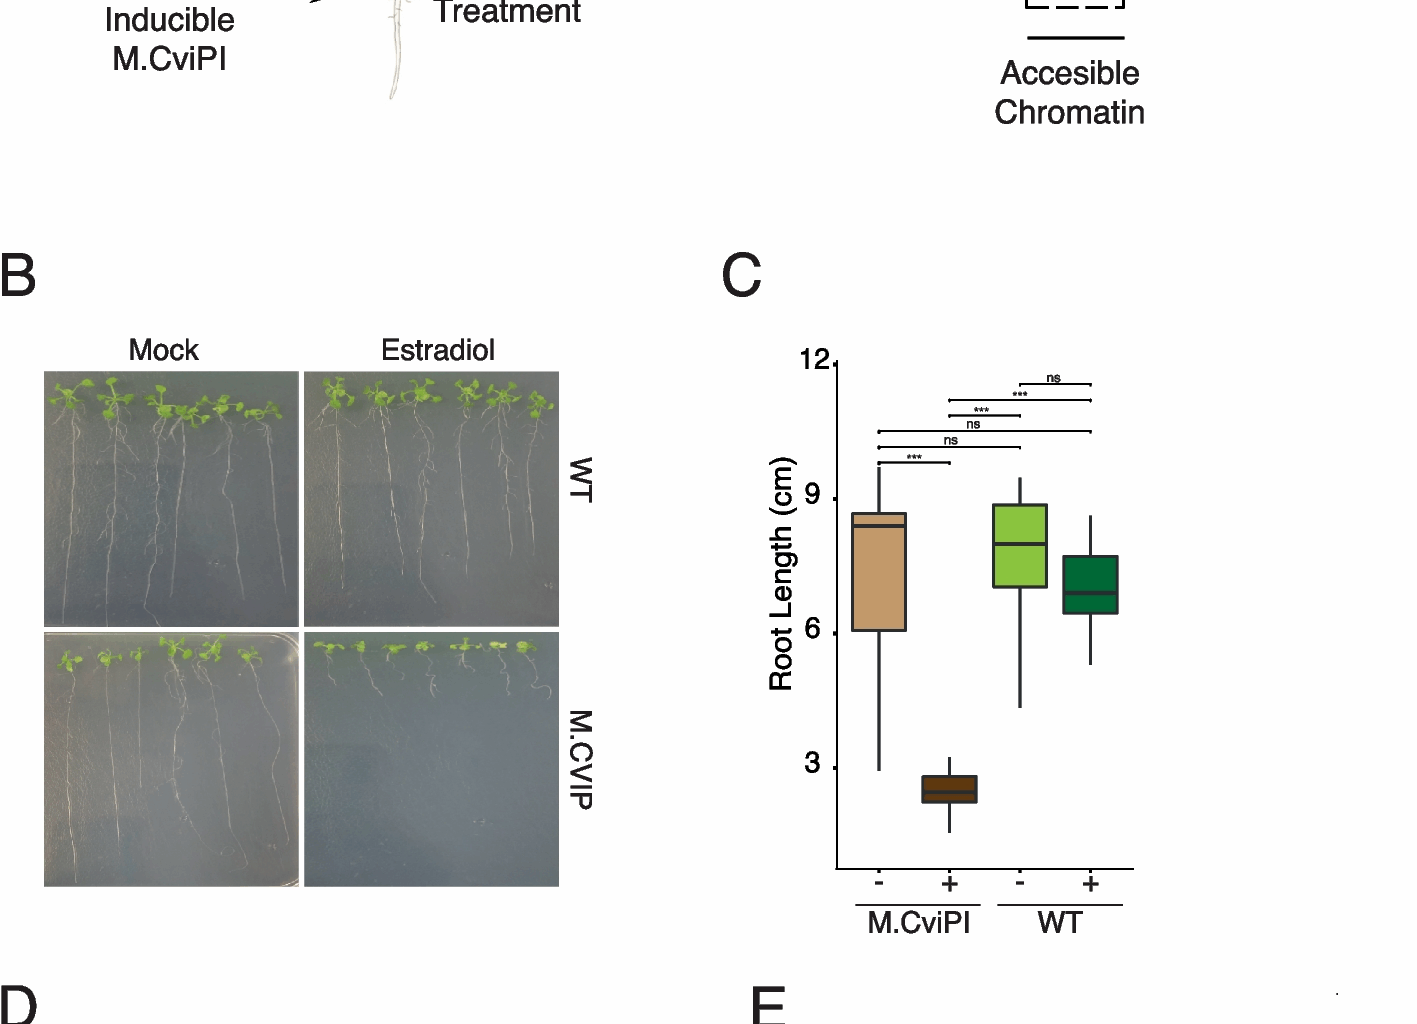
Arabidopsis plants were transformed using the floral dip method [40]. T0 seeds (RFP +) were selected and grown to the T1 generation. From the subsequent lines that showed a 3:1 RFP + to non-RFP ratio, seeds were selected and grown to the T2 generation. In the T2 progeny, homozygous lines (lines with 100% RFP + seeds) were selected and propagated as stably expressing lines. To select a responsive and tightly controlled indMCviPI line, seedlings (4 days old) from homozygous lines were transferred to 40 µM β−17-estradiol for 10 days and monitored for root length differences compared to control plants. Root growth was calculated by measuring the distance between the root tip position immediately after transferring and after 10 days of treatment using ImageJ, and statistical analysis was performed (t-test, p-value ≥ 0.05) to compare the differences in root growth. To identify the most responsive indMCviPI line in the Col-0 background, we selected 4 independent homozygous lines and carried Out BS-seq analysis after 48-h 10 mM β-estradiol induction. Finally, indMCviPI −1a was selected for further study.
For the induction of MCviPI expression to map accessible chromatin, seedlings of transgenic and control plants were subjected to β−17-estradiol induction and mock treatment for 6, 12, and 24 h (10 mM β−17-estradiol in DMSO and DMSO in water for mock). Eight-day-old seedlings were transferred to a Whatman paper soaked wet with a film so that the plants were in contact with the solution and to avoid drought stress. Approximately 30 seedlings were placed on one plate in two rows. Plates were wrapped with cling film before induction in a growth cabinet.
Enzymatic NOMe-seq preparation from isolated nuclei
Nuclei were isolated from 200 to 400 mg of 14-day-after-germination seedlings using gentleMACS. Pre-cooled gentleMACS C Tubes were loaded with 2 mL nuclei isolation buffer (Miltenyi Biotec) followed by immediate transfer of tissue pieces. Samples were dissociated using the gentleMACS Dissociator (Miltenyi Biotec) running program 4C_nuclei_1, with tubes kept on pre-chilled Octo Coolers throughout. Tubes were placed on ice and incubated for an additional 5–10 min after dissociation to optimize cell lysis. The resulting suspension was passed through a 50-µm cell strainer, washing the nuclei with washing buffer. The suspension was centrifuged at 300 g for 5 min at 4 °C, removing supernatant afterwards. The nuclei pellet was resuspended in final buffer, and concentration was determined using flow cytometry (Sony MA900). One million nuclei were resuspended in 75 µl of 1 × GpC methylase buffer (NEB), and we added 7.5 µl 10 × GpC methylase buffer (NEB), 1.5 µl 32 mM SAM, 50 µl GpC methyltransferase (4U/µl) (NEB) and 16 µl H2O, incubating the reaction for 8 min at 37 °C and adding 25 µl GpC Methyltransferase (100 U) and 0.75 µl of 32 mM SAM, mixing and incubating at 37 °C for 8 min. The reaction was stopped by adding 500 µl of 1X PBS, mixing, and centrifuging for 5 min at 800 g at 4 °C, followed by phenol/chloroform treatment for DNA isolation.
BS-seq library preparation and sequencing
For whole genome bisulfite sequencing, after estradiol or mock treatment, seedling root and leaf samples were collected from 20–30 seedlings at each treatment time. Root and leaf tissues were separated by cutting the seedlings in two at the lower part of the hypocotyl with a scalpel blade. The tissue samples were collected in 1.5-ml Eppendorf tubes and flash frozen in liquid nitrogen. DNA extraction was carried out using the Qiagen Plant DNeasy kit (Qiagen), and DNA was quantified using Qubit dsDNA HS assay kit (Invitrogen). Approximately 100 ng of genomic DNA in total 100 µl volume was sonicated using a Bioruptor (Diagenode Inc.) with 30 s ON and 30 s OFF at a “low” setting to generate 350 bp DNA fragments. The libraries were generated using the Illumina TruSeq Nano kit (Illumina, CA, U.S.A) according to the manufacturer’s manual. Size-selected and adapter-ligated DNA was subjected to bisulfite treatment using an Epitect Plus DNA Bisulfite Conversion Kit (Qiagen, Hilden, Germany) according to the manufacturer’s manual. PCR amplification was performed using Kapa Hifi Uracil + DNA polymerase (Kapa Biosystem, MA, U.S.A) according to the manufacturer’s instructions. To check size distribution of DNA fragments, samples were run on bioanalyzer (Agilent 2100). Indexed bisulfite treated libraries were sequenced with 2 × 150-bp paired-end reads on an Illumina HiSeq2000 instrument. Maximum of 16 different indexed libraries were pooled in a single lane run. The Illumina Real Time Analysis 1.13.48. software was used for image analysis and to extract sequence data.
ATAC-seq library preparation and sequencing
Plant leaves were finely chopped with a razor blade in a petri dish with 1 mL of nuclei extraction buffer (0.25 M sucrose, 10 mM Tris–HCl pH 8.0, 10 mM MgCl2, 1% Triton X-100, protease inhibitor cocktail EDTA-free (Roche)). Chopped tissues were filtered with a 50-µm filter and centrifuged at 600 g for 10 min at 4 °C. The supernatant was removed, and the pellet was washed 3 times with nuclei extraction buffer. After washing, the pellet was resuspended in sucrose buffer (0.25 mM sucrose, 10 mM Tris–HCl pH 8.0, 10 mM MgCl2, protease inhibitor cocktail EDTA-free (Roche)) and DMSO was added to 10% final. Samples were then placed at − 80 °C in CoolCell freezing containers (Corning) for cryopreservation and storage. For each ATAC-seq experiment, 75,000 nuclei were thawed and centrifuged at 600 g for 5 min to remove storage buffer. Transposition reaction, DNA purification, and PCR amplification were performed using the ATAC-seq kit from Active Motif. Libraries were purified using 0.9 × SPRISelect (Beckman Coulter) and size-selected for 150–500 bp fragments using PippinHT (Sage Science). Finally, the quality of the libraries was assessed using 2100 Bioanalyzer (Agilent Technologies) and then subjected to 2 × 150 bp paired-end high-throughput sequencing by NovaSeq 6000.
De novo genome assembly and annotation
For the extraction of HMW-DNA, leaf tissues were ground with liquid nitrogen, and the powder was incubated for 45 min at 55 °C in freshly prepared, pre-heated lysis buffer (1% sodium metabisulfite, 1% PVP40, 0.5 M NaCl, 100 mM Tris–HCl pH 8, 50 mM EDTA pH 8, 1.5% SDS, 2% β-mercaptoethanol). We added to the lysate 60 µl of 20 mg/ml PureLink ™ RNAseA (Thermo Fisher Scientific) and incubated the mixture for 10 min. To precipitate proteins, we added 600 µl of 5 M potassium acetate followed by 2.4 ml of 25:24:1 (v/v/v) phenol:chloroform:isoamyl alcohol and incubated for 10 min. After centrifuging at 4400 g for 10 min, the upper phase was transferred to a new tube and mixed with 24:1 (v/v) chloroform:isoamyl alcohol for 10 min with slow rotation. Following a second centrifugation at 4400 g for 10 min, the upper phase was transferred to a new tube and cleaned twice with SeraMag SpeedBeads® Magnetic Beads (GE Healthcare) using a magnet. HMW-DNA was eluted with 50 µl EB (Qiagen) after incubation at 37 °C for 30 min.
For the construction of CLR libraries, 10 µg of HMW-DNA that had been sheared twice with a needle (FINE-JECT 0.45 × 25 mm, Henke Sass Wolf) was prepared with the SMRTbell Express Template Preparation Kit 2.0 (PacBio). The libraries were size-selected with the BluePippin system (SageScience) with a 30 kb cutoff in a 0.75% DF Marker U1 high-pass 30–40 kb vs3 gel cassette (Biozym). The library was sequenced with sequencing primer v4 and no pre-extension time on a single SMRT Cell (30-h movie time) with the Sequel II system (PacBio) using the Binding Kit 2.0 (PacBio).
For genome assembly, we used CLR subreads larger than 10 kb for assembly using Canu v2.0 [41]. For the evaluation of accuracy and completeness, we scaffolded contigs > 100 kb with RagTag v1.1.1 [42] using a hard-masked version of TAIR10 as the reference genome. We mapped gene annotations to new genome assemblies using Liftoff [43] using TAIR10 as the reference genome. We annotated transposable elements (TEs) and other repeat regions using Extensive de-novo TE Annotator (EDTA) v1.9.7 [44].
Data processing for iNOMe-seq, NOMe-seq, and ATAC-seq analysis
Methylation correlation for each of the GCG, GCHG, and GCHH was computed for both leaf and root estradiol-treated and control samples. Our data showed a strong methylation correlation in GCG and GCHG contexts; however, although the methylation in the GCHH context was also correlated, it was weaker as compared to that of symmetrical contexts. Based on this observation, a bins method was used to compute differentially methylated regions (DMRs). Initially, DMRs from iNOMe-seq data were computed with varying methylation differences (10–100%) and bin sizes (50–5000 bp). After selecting the optimal bin size and methylation difference, we computed DMRs as accessible chromatin values. To compare these DMRs with ATAC-seq-identified accessible regions, precision, recall, and F-score were calculated (Additional file 1: Figure S6). Each set of identified DMRs was compared to the ATAC-seq accessible regions, and for each of them, the proportion of true positives (TP—regions detected by both iNOMe-seq and ATAC-seq), false positives (FP—regions detected only by iNOMe-seq), and false negatives (FN—regions detected 35only by ATAC-seq) was calculated. We assumed that the regions detected by ATAC-seq were true positives. Using these calculated proportions, we computed the recall (TP/(TP + FN)), precision (TP/(TP + FP)) and F-score (2T P/(2T P + F P + F N)). Finally, we selected the methylation difference threshold and bin size that lead to the highest F-score. Based on calculation, the precision, recall, and F-score, a value of 30% for methylation difference and 700 bp bin size were found to be the optimum for the comparison of accessible chromatin regions by both methods.
For enzymatic NOMe-seq, we performed the same analysis and found that a value of 60% for methylation difference and 700 bp bin size resulted in the optimum set of parameters for the comparison of accessible chromatin regions by ATAC-seq and NOMe-seq methods (Additional file 1: Figure S14). It is worthwhile noting that, unsurprisingly, enzymatic NOMe-seq led to a higher level of methylation than an in vivo inducible system (iNOMe-seq) and, thus, the methylation difference is higher for the former.
Differentially methylated regions/accessible regions identified by iNOMe-seq were compared to accessible open chromatin identified by ATAC-seq. So, any difference in accessibility observed in control and induced samples around the targeted features was compared to the accessibility of these features by ATAC-seq data. In order to carry Out iNOMe signal detection around targeted features, the proportion of methylation percentage at each individual cytosine was used to compute a moving average with a window size of 500 bp for all samples. The moving averages were then used to determine the methylation difference between control and treatment samples. The difference was calculated by subtracting the moving average of control samples from the moving average of treatment samples. This process allowed for the easier visualization of induced GC methylation across the genome by removing naturally occurring background methylation. As iNOMe-seq detects a larger amount of accessible DNA than ATAC-seq, the distribution of iNOMe peaks throughout the genome was checked. To do this, the R package ChIPpeakAnno [45] was used to annotate DMRs and to identify the closest gene associated. This package also calculated the distance between genes and DMRs; these distances were used to determine the distribution of iNOMe peaks around genes. By comparing these data to various features, the iNOMe peaks were separated into different categories; these categories included genes, transposable elements, upstream, downstream, and intergenic regions.
Transcription factor binding site identification
These cytosines are categorized based on their context and compared with the corresponding differentially methylated regions (DMRs). Any cytosines falling Outside of these DMRs are excluded from further analysis. Next, the average methylation score is calculated using the remaining cytosines, and any cytosines below this value are removed. Gaps between the remaining cytosines are identified, merged if overlapping, and then filtered to retain only gaps within the range of 10–60 base pairs in width. These remaining gaps are compared with all cytosines in the genome, and only gaps that overlap with at least one cytosine are retained. Finally, the gaps are overlapped with CpG islands, and only gaps that do not overlap with CpG islands are kept. The resulting gaps that meet these criteria are considered potential transcription factor (TF) binding sites. Using XSTREME [46], motifs that are enriched inside potential TF binding sites compared to DMRs that do not overlap potential TF binding sites are identified. The enriched transcription factors (TFs) are cross-referenced with RNA-seq data to determine their expression levels.