Sequence results
The raw FastQ sequences upon quality check revealed the dataset comprised 5.5 million to 11.6 million paired-end reads per sample with an average read length of 151 bp. In terms of total average reads, the subclinical group had the highest count (9.76 million), followed by the clinical group (8.27 million) and the healthy group (7.67 million). The average GC content for the groups was 45.17% for subclinical, 44.86% for healthy, and 43.33% for clinical (Table 2).
Table 2 Read statistics in different groupsDominant microbial community and taxonomy assessmentPhylum level distribution
Several microbial phyla showed varied abundance, some specific to a single group, while others were shared across multiple groups. The buffalo’s milk comprises various microbes belonging to different phyla, including Proteobacteria, Firmicutes, Actinobacteria, Deinococcus-Thermus, Bacteroidetes, Cyanobacteria, Candidatus sp., and others. The milk microbiota composition revealed significant differences in the relative abundance among clinical (Group I), sub-clinical (Group II), and healthy (Group III) buffalo groups. Proteobacteria were the most prevalent across all categories, peaking in clinical mastitis samples at 79.61%, 62.45% in sub-clinical, and 44.25% in healthy animals (Fig. 2a). Conversely, the abundance of Firmicutes and Actinobacteria was lower in clinical mastitis samples (18.39% and 1.52%, respectively) than in sub-clinical (33.68% and 2.84%) and healthy samples (47.02% and 2.89%), suggesting an inverse relationship with disease severity. The abundance patterns were also depicted by heat maps. The phylum-level heatmaps (Fig. 3a and S2a) utilized abundance data and statistical significance from three distinct groups, respectively. Group 2, which indicates cases of subclinical mastitis, demonstrated a higher relative abundance across several phyla, including Chlorobi, Chlamydiae, Chloroflexi, Proteobacteria, Candidatus_Gracilibacteria, Actinobacteria, Acidobacteria, Cyanobacteria, and Bacteroidetes, among others. A highly significant difference in Deinococcus abundance was observed in healthy cases (5.05%) compared to both subclinical abundance, 0.017% (FDR = 2.66 × 10⁻14) and clinical groups, 0.008% (FDR = 7.27 × 10⁻1⁰), emphasizing its potential as a marker for healthy mammary microbiota. This pattern is also well explained in Table S2, which gives a detailed account of the relative abundance of each phylum along with the results of statistical tests comparing different groups, provided in the supplementary material.
Fig. 2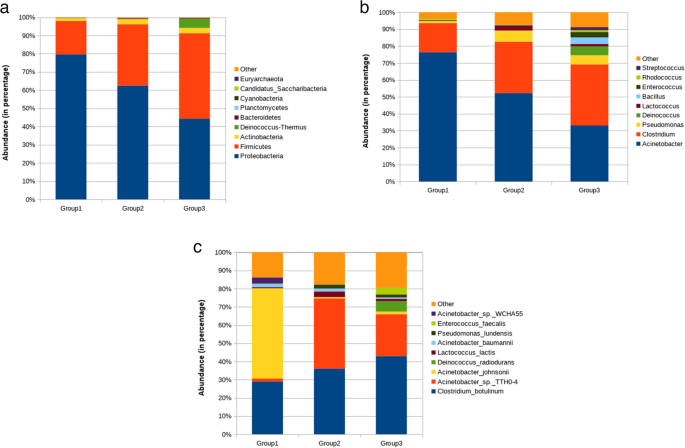
Microbial abundance plot at the (a) phylum level, (b) genus level, (c) species level (where Group1: Clinical mastitis, Group2: Subclinical mastitis, and Group3: Healthy)
Fig. 3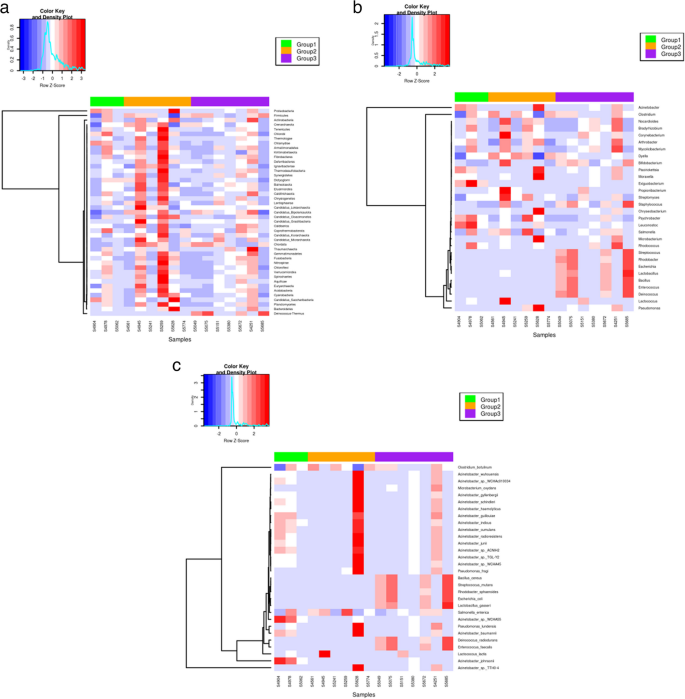
Representation of taxonomical composition in individual samples through heat map (a) at the phylum level, (b) at the genus level, (c) at the species level (where Group1: Clinical mastitis, Group2: Subclinical mastitis, and Group3: Healthy)
Genus level abundance
Considering the genus distribution, among the three samples, a range of microbes was present in the healthy group of buffaloes. Clostridium (36%) predominantly forms a large proportion of healthy microbiota, whereas Acinetobacter (33%) was less abundant as compared to the CM (76%) and SCM (52%) groups. Acinetobacter was found in the clinical mastitis cases. Some genera were specific to only healthy groups, for instance, Deinococcus, Bacillus, Enterococcus, Streptococcus, Escherichia, Rhodobacter, and others; however, they were less abundant (Fig. 2b). Abundance-based and significance heatmap at genus level (Fig. 3b and S2b) highlighted that Exiguobacterium exhibited greater abundance in the clinical group than in the subclinical and healthy groups. It was shown to be statistically significant when compared to the subclinical group (FDR = 7.19 × 10⁻⁹) and the healthy group (FDR = 2.5613 × 10⁻4). For healthy animals, the bacterial genera that were relatively abundant and statistically significant include Deinococcus, Streptococcus, Bacillus, Enterococcus, Rhodobacter, and Lactobacillus, among others, when assessed individually against both clinical and subclinical cases.
Species level distribution
A comparative analysis of bacterial species revealed that Clostridium botulinum was the most abundant species across all groups, accounting for 42.9% in healthy animals and 36.1% in subclinical cases. It was also present prominently in clinical mastitis cases, where it constituted 29% of the microbial profile. However, in clinical mastitis samples, Acinetobacter johnsonii emerged as the dominant species, representing 49.6%, in stark contrast to its lower prevalence in healthy (1.4%) and subclinical animals (0.7%). Subclinical mastitis cases were primarily characterized by Acinetobacter sp. TTH0-4, which accounted for 38.5% of the microbial community, along with C. botulinum. There was also an increase in the representation of Lactococcus lactis (3.1%) and Pseudomonas lundensis (2.16%). In healthy animals, the microbial diversity was the highest, with no single species dominating. While C. botulinum and Acinetobacter sp. TTH0-4 contributed notably; there were also unique taxa such as Deinococcus radiodurans (5.7%), Enterococcus faecalis (3.7%), Rhodobacter sphaeroides (1.5%), and Streptococcus mutans (1.3%), contributing to a more balanced microbial composition (Fig. 2c). In clinical mastitis cases, the microbial community was skewed towards dominant taxa, with A. johnsonii and C. botulinum exceeding 78% of the total community. Subclinical mastitis showed moderate diversity, primarily featuring two major species: Acinetobacter. sp. TTH0-4 and C. botulinum. This trend was further validated by a sample-wise heatmap at the species level (Fig. 3c). These findings underscore a decline in microbial diversity from healthy animals to those with clinical mastitis, highlighting the increasing dominance of opportunistic or pathogenic taxa.
Acinetobacter as a dominant genus
Acinetobacter was the most prominent and diverse bacterial genus across clinical, subclinical, and healthy groups. In clinical mastitis, A. johnsonii was the dominant species, accounting for nearly half of the microbial community (49.6%). This marked difference in relative abundance was significantly associated with clinical mastitis compared to healthy and subclinical groups (FDR = 0.0389). A similar trend was observed in the case of Acinetobacter. sp. WCHA55 with FDR value of 0.0449 (Table 3). Other species, including A. baumannii (1.9%), Acinetobacter sp. TTH0-4 (1.6%), and A. guillouiae (1.0%), contributed at lower levels, indicating a broad representation of Acinetobacter species in diseased samples. In subclinical mastitis, Acinetobacter sp. TTH0-4 (38.5%) replaced A. johnsonii as the major species, while A. baumannii (1.6%), A. haemolyticus (0.7%), A. schindleri (0.7%), and A. indicus (0.6%) were detected, suggesting greater species richness under subclinical conditions. In healthy animals, Acinetobacter sp. TTH0-4 (23.1%) persisted at a relatively high level, alongside low proportions of A. johnsonii (1.4%) and other species (Figure S1). This distribution was also represented in the form of a chord diagram for all three categories (Figure S3). These findings suggest that Acinetobacter is a diverse and adaptable genus, with Acinetobacter johnsonii standing out as the most clinically significant species in mastitis cases.
Table 3 The abundance of different strains of acinetobacter speciesPhylum- and genus-level biomarkers
Linear Discriminant Analysis (LDA) scores identified specific bacterial taxa that serve as biomarkers, distinguishing and associating bacterial communities with the three health status groups. At the phylum level, Proteobacteria exhibited the highest LDA score, indicating a strong association with clinical mastitis cases. Similarly, the high LDA score of Deinococcus-Thermus underscores its strong association with healthy animals (Fig. 4a).
Fig. 4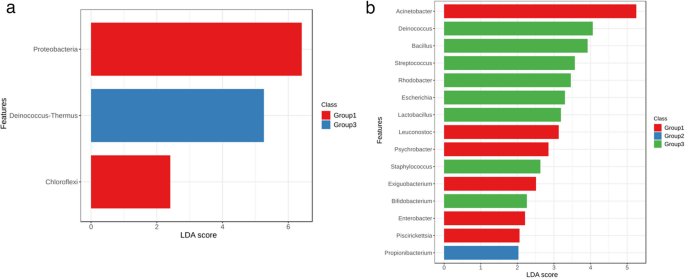
Linear Discriminant Analysis (a) Phylum-level analysis (b) Genus-level analysis (where Group1: Clinical mastitis, Group2: Subclinical mastitis, and Group3: Healthy)
The relative abundance of the phylum Deinococcus-Thermus was significantly higher in healthy individuals compared to clinical mastitis cases (FDR = 7.27 × 10⁻¹⁰), suggesting a commensal role of this taxon in maintaining udder health. Although the relative abundance of Acinetobacter was visibly higher in clinical mastitis cases compared to subclinical and healthy groups, the differences were not statistically significant (subclinical vs. clinical: p > 0.05; healthy vs. clinical: p > 0.05) (Fig. 4b). The relative abundance of Propionibacterium was higher in subclinical individuals compared to those with clinical and subclinical mastitis buffalo.(Supplementary Table S3).
The Krona plot provides a detailed hierarchical characterization of the microbial community composition, highlighting the taxonomic distribution and relative abundances of various taxa in clinical mastitis cases in Murrah buffalo. At the root level, the microbial community is dominated by the domain Bacteria, which is further divided into prominent phyla such as Proteobacteria and Firmicutes. Figure 5 illustrates the phylogenetic tree, which represents the taxonomic breakdown and proportion of the phylum Proteobacteria in both clinical and subclinical animal samples. The microbial profile of clinical mastitis samples was dominated by Proteobacteria (approximately 80%), with Gammaproteobacteria as the largest group. Acinetobacter comprised about 36% of the community, along with Pseudomonas and related genera (Fig. 5a). This prevalence of opportunistic pathogens indicates a disrupted microbiome that likely contributes to inflammation and tissue damage in the udder. In contrast, subclinical mastitis samples showed a more diverse microbial composition, with Proteobacteria making up 62% of the community. Acinetobacter represented 50%, while Pseudomonas and Moraxellaceae were present in smaller amounts (~ 2% each) (Fig. 5b). This diversity suggests an earlier or less severe infection, where the host’s immune defenses may still control microbial growth.
Fig. 5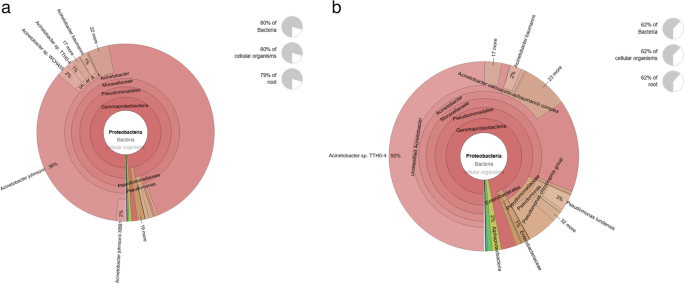
Krona Chart illustrating taxonomic composition of Proteobacteria (a) clinical group and (b) in a subclinical mastitis group
Group-wise comparison of specific taxa
The box and whisker plot (Fig. 6a) shows that the abundance of Proteobacteria is the highest in group 1, clinical mastitis cases, suggesting a link between Proteobacteria and more severe mastitis conditions. Whereas, log-transformed count explains the higher abundance of Deinococcus-Thermus in group 3, i.e., healthy, compared to CM and SCM (Fig. 6b). Groups 1 and 2 show near-zero counts, suggesting a depletion in mastitis cases (both clinical and subclinical). Firmicutes and Chlorobi revealed the opposite trend. Chlorobi’s highest abundance was observed in the CM group, as shown in the log-transformed counts (Figs. 6c and 5d), suggesting its possible correlation with the severity of clinical mastitis. The lower abundance of SCM and the markedly reduced levels in the healthy group linked its presence to disease progression. The highest abundance of Firmicutes suggests a potential protective or stabilizing role in healthy animals.
Fig. 6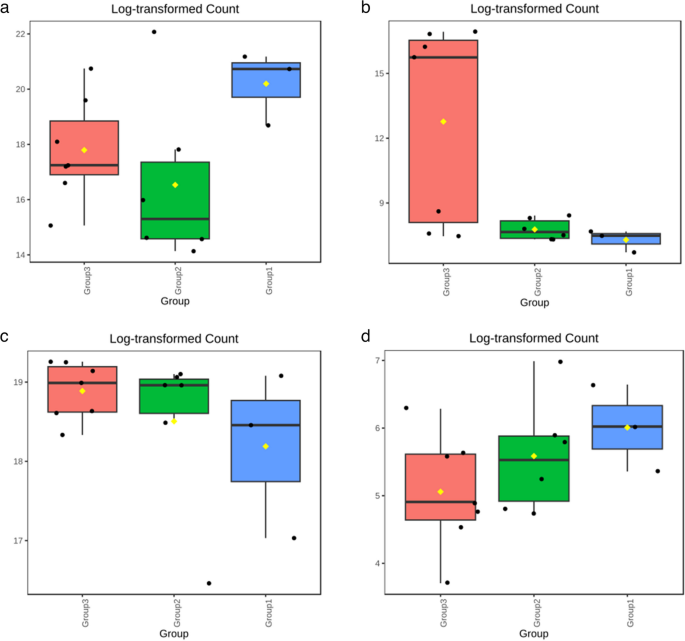
Log-Transformed Abundance for different phyla: (a) Proteobacteria, (b) Deinococcus-Thermus, (c) Firmicutes, (d) Chlorobi (where Group1: Clinical mastitis, Group2: Subclinical mastitis, Group3: Healthy)
Log-transformed counts of various genera showed a similar trend in the case of Enterobacter, Exiguobacterium, Ferrimonas, Thalassotalea, and Virgibacillus, as these genera were most abundant in Group 1, i.e., clinical mastitis. They represent microbiota that are directly associated with the severe mastitis condition and highlight their potential role as biomarkers for the disease. On the other hand, their abundance in subclinical cases varies. For instance, the levels of Enterobacter and Ferrimonas were lower in SCM than in healthy animals, whereas Exiguobacterium was nearly equal in both SCM and healthy animals. Thalassotalea and Virgibacillus were more prevalent in Group 2 (SCM) than in healthy ones (Fig. 7b, c, d, e and f). Whereas, a different pattern was observed for Bifidobacterium, where the healthy group (Group 3) showed higher log-transformed counts, pointing to its potential role in maintaining good health (Fig. 7a).
Fig. 7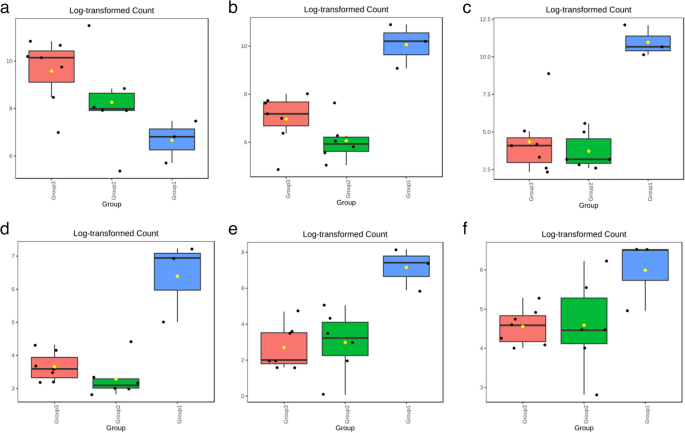
Log-Transformed Abundance of different genera: (a) Bifidobacterium, (b) Enterobacter, (c) Exiguobacterium, (d) Ferrimonas, (e) Thalassotalea, (f) Virgibacillus (where Group1: Clinical mastitis, Group2: Subclinical mastitis, and Group3: Healthy)
Shared microbial taxa among the groups
Among the total 45 detected phyla, 41 were shared by all three groups. Three phyla were shared by group 2 (Subclinical) and group 3 (Healthy), namely, Candidatus_Gracilibacteria, Candidatus_Korarchaeota, and Candidatus_Micrarchaeota. Deinococcus-Thermus was the unique phylum that was associated with the healthy group (Fig. 8a). This interpretation indicates its significant role in maintaining udder health and microbiome stability. Moreover, a large number of genera were reported in all three groups of animals. Of these, 1301 genera were shared by healthy, subclinical, and clinical groups. The clinical group consists of one distinctive genus, Aliiarcobacter (Fig. 8b).
Fig. 8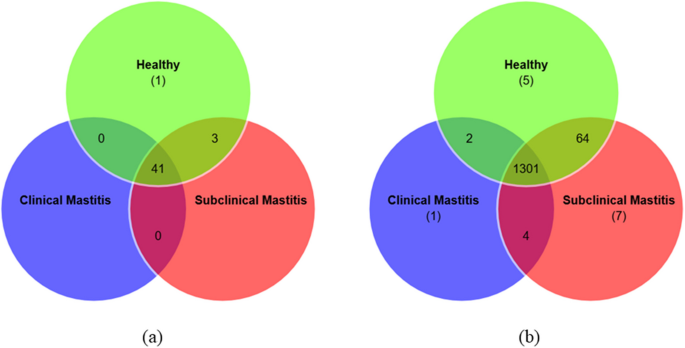
Venn Diagram representing Shared and Unique microbial taxa at different levels (a) phylum, (b) genus, in the milk microbiome composition and udder status
Microbial diversity in mastitis and healthy samples
The dendrogram (Fig. 9) illustrates the hierarchical clustering of microbial profiles from animals categorized into three groups: clinical mastitis, subclinical mastitis, and healthy animals. The clustering at the genus level demonstrates distinct groupings based on microbial composition.
Fig. 9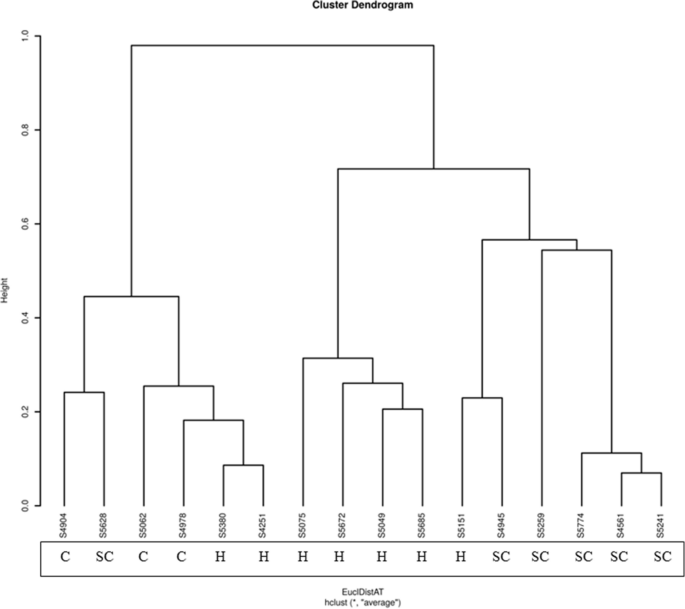
Genus-level microbial clustering (where C represents Clinical mastitis samples, SC represents Subclinical mastitis samples, and H represents Healthy samples.)
Clinical mastitis samples cluster tightly, merging at lower heights, which indicates high similarity within this group and suggests a shared microbial signature, representing pathogenic dominance and infection severity. Subclinical mastitis samples form separate clusters, with slightly greater variability, reflecting intermediate microbial states between health and disease. For instance, the distance matrix value between a subclinical case and a clinical case was relatively low at 0.241412, indicating a high level of microbial similarity. This similarity is reflected in their clustering together in the dendrogram, suggesting that the microbial communities of these two cases share certain similarities despite differing health statuses.
Healthy samples cluster separately and show greater diversity, reflecting a balanced microbial community. The clear separation between clinical, subclinical, and healthy groups highlights distinct microbial community structures associated with disease severity and health status.
OTU (Operational Taxonomic Unit) diversityAlpha diversity metrics for healthy and diseased groups
Shannon and Simpson diversity indices were used to measure community diversity, which explains the richness (number) and evenness (distribution) of specific groups or taxa in a population. They provide complementary insights into microbial diversity.
Shannon diversity indices
At the phylum level, the healthy group exhibited the highest Shannon diversity, with a median index of approximately 1.0, indicating a stable and diverse microbial community. In contrast, clinical and subclinical mastitis groups showed reduced diversity, with a median index of 0.8 and 0.9, respectively, suggesting microbial dysbiosis in these conditions. A consistent trend was observed at the genus level, with the healthy group showing the highest diversity, clinical mastitis cases showing the lowest, and subclinical cases displaying intermediate diversity with notable variability.
Similarly, at the species level, the healthy group maintained the highest diversity (median index ~ 2.5), reflecting a balanced and resilient microbial ecosystem. The clinical group displayed a markedly lower diversity (median index ~ 2.0), likely dominated by a few pathogenic species. The subclinical group demonstrated high variability in species-level diversity, ranging from extremely low to relatively high values, indicating transitional states or heterogeneity in microbial composition (Fig. 10).
Fig. 10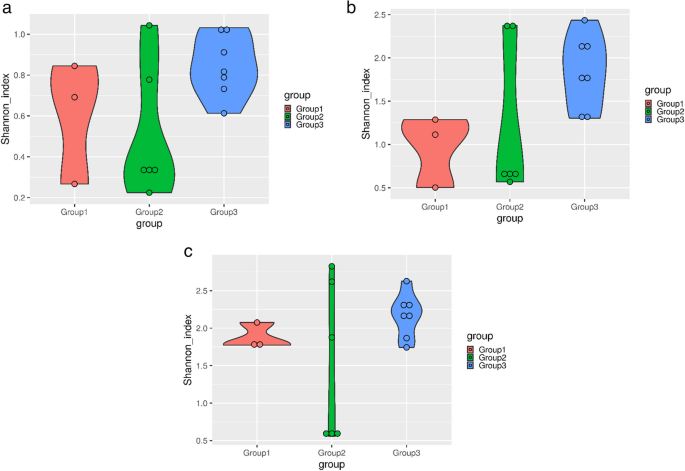
Shannon plots representing alpha diversity indices at (a) phylum level, (b) genus level, (c) species level (where Group1: Clinical mastitis, Group2: Subclinical mastitis, and Group3: Healthy)
Simpson diversity indices
The Simpson diversity index plots at the genus, phylum, and species levels demonstrate the overall diversity trends across the three groups (Group 1, Group 2, and Group 3). At all taxonomic levels, Group 3 (healthy individuals) consistently exhibits the highest Simpson index values, indicating the greatest microbial evenness and diversity. Clinical mastitis cases show moderately high diversity with some variability, while subclinical mastitis cases consistently have the lowest diversity and most compact distributions across all taxonomic levels. These results highlight a clear decline in microbial diversity and evenness in the mastitis-affected groups, particularly in subclinical cases, suggesting that mastitis influences microbial composition and richness (Fig. 11).
Fig. 11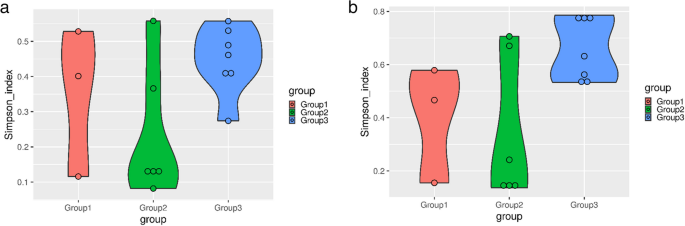
Simpson plots representing alpha diversity indices at (a) phylum level, (b) genus level, (c) species level (where Group1: Clinical mastitis, Group2: Subclinical mastitis, and Group3: Healthy)
Beta diversity metrics for healthy and diseased groups
Beta diversity examines variations in microbial composition across different samples or groups. Principal coordinate analysis (PCoA) utilizing the Bray–Curtis dissimilarity index assesses similarity among various populations through both quantitative and qualitative analysis of OTU occurrences. The two-dimensional PCoA plot portrays nearly 89.31% of the total variance at the genus level. The clinically affected samples were clustered separately with its centroid visibly distant from the centroids of the sub-clinical and healthy groups (Fig. 12). Statistical analysis using PERMANOVA (adonis2) supported these findings, indicating a significant effect of group on microbial community structure (R2 = 0.303, p = 0.049), accounting for about 30.3% of the overall beta diversity variation. The PCoA plot organizes samples based on total microbial abundance. At the genus level, analysis showed that the two healthy samples displayed high levels of Acinetobacter and Clostridium, which are often linked to clinical mastitis cases. Similarly, these healthy samples showed the significant abundance of Acinetobacter and Clostridium. The similarities in microbial profiles may explain the proximity of these two healthy samples to the clinical cluster in the PCoA, suggesting that these animals could be harboring subclinical infections or early-stage dysbiosis despite being classified as healthy.
Fig. 12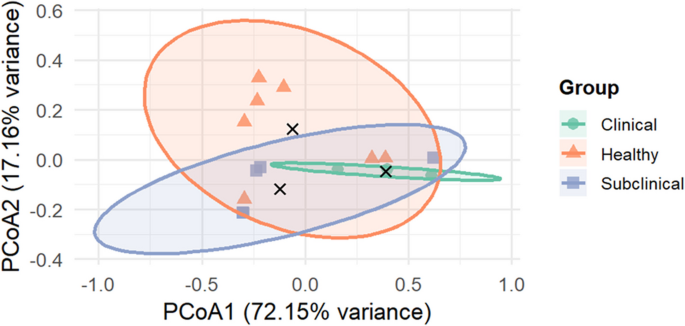
PCoA plot using Bray–Curtis matrices representing beta diversity indices of microbial communities at the genus level
Functional analysis
Among the total of 58,837 identified genes in the overall milk metagenome, there were 14,887 GO annotated genes that were assigned into the biological processes (8,751), cellular components (9,365), and molecular functions (12,523). Most prominent molecular functions were catalytic activity (15.2%), binding (12.1%), and transporter activity (2.9%). Metabolic (11.3%) and cellular processes (11.4%) were the prominent terms of the biological processes (Fig. 13a). Biosynthesis of amino acids (515 genes), carbohydrate metabolism (110 genes), lipid metabolism (158 genes), and energy-related processes such as the TCA cycle (76 genes), glycolysis (47 genes), and oxidative phosphorylation (16 genes) were evident for the pathway analysis. Notably, the cell wall biogenesis process associated with the peptidoglycan biosynthetic pathways (94 genes) and membrane lipid metabolism was prominent and indicative of their roles toward the structural integrity of the cell wall (Fig. 13b and c). In addition, cofactor biosynthetic, nucleotide metabolism, and carbohydrate degradation were prominent and indicative of an active microbial input toward the utilization of energy, cell restoration, and interaction with the host. Reads associated with Deinococcus demonstrated an enrichment of pathways related to the metabolism of galactose, xylulose, and glucose. Additionally, there was notable enrichment in the biosynthesis of coenzyme A and cofactors, as well as in sodium-proton and potassium-proton antiporters. Other enriched pathways included phosphoryl response regulators, DNA repair enzymes like helicases, and NADPH-dependent antioxidant systems (Figure S4).
Fig. 13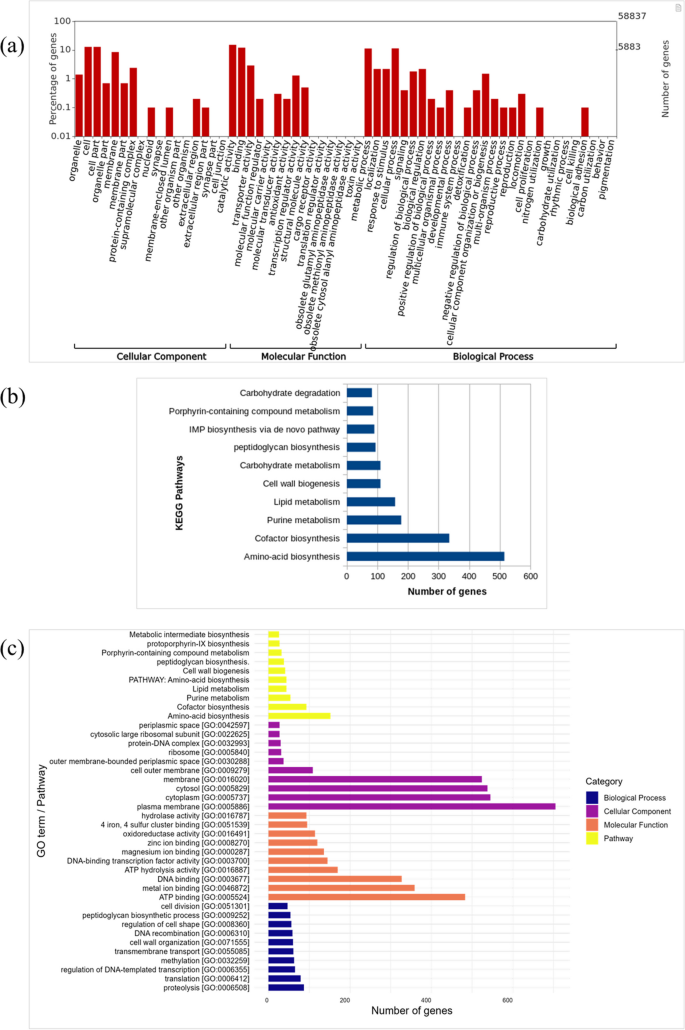
Functional pathway analysis representing (a) Top gene ontology terms for biological process, molecular function, and cellular components enriched for the complete microbiome (b) KEGG pathways enriched for the complete microbiome (c) Top 10 GO terms for biological process, molecular function, cellular components, and pathways associated with Acinetobacter spp