Top 3 stock recommendations by Ankush Bajaj for 17 SeptemberBuy: APL Apollo Tubes Ltd — Current Price: ₹1,697.60
Why it’s recommended: APL Apollo Tubes has shown strong breakout momentum in recent sessions. The daily RSI is around 61, suggesting steady bullish strength. The MACD is positive at +4.5, confirming continuation of the uptrend, while the ADX at 25 indicates that the trend is strengthening but still has scope to mature. Price action remains firmly supported by bullish moving averages, keeping the setup constructive.
Key metrics: RSI (14-day): 61 — bullish momentum
MACD (12,26): +4.5 — positive crossover, trend intact
ADX (14): 25 — trend strength building
Technical view: Sustaining above ₹1,670 strengthens the case for a move toward ₹1,750.
Risk factors: Trend strength moderate; profit-taking possible.
Sector linked to steel/metals — input cost pressures may weigh.
Buy at: ₹1,697.60
Target price: ₹1,750
Stop loss: ₹1,670
Buy: Bajaj Finserv Ltd — Current Price: ₹2,080.30
Why it’s recommended: Bajaj Finserv is displaying improving strength after range-bound movement. The daily RSI is around 60, signaling bullish momentum. The MACD is positive at +11, confirming upward momentum, while ADX at 29 indicates the trend is strengthening. The stock trades comfortably above its key short-term averages, and once resistance is cleared, further upside appears likely.
Key metrics: RSI (14-day): 60 — bullish bias
MACD (12,26): +11 — positive, supporting trend
ADX (14): 29 — healthy trend strength
Technical view: Sustaining above ₹2,025 sets up a move toward ₹2,190.
Risk factors: Trend is still developing; pullbacks possible.
Sector exposed to financial/credit cycle and regulatory risks.
Buy at: ₹2,080.30
Target price: ₹2,190
Stop loss: ₹2,025
Buy: Eicher Motors Ltd — Current Price: ₹6,927.50
Why it’s recommended: Eicher Motors is showing very strong bullish momentum. The daily RSI is over 81, firmly in the overbought zone, reflecting heavy buying pressure. The MACD is sharply positive (+298), confirming strong trend continuation, while ADX at 80 signals a very powerful underlying trend. Despite being overextended, the breakout structure supports further near-term upside.
Key metrics: RSI (14-day): 81 — overbought but strong
MACD: +298 — very strong momentum
ADX (14): 80 — extremely strong trend
Technical view: As long as the stock sustains above ₹6,896, it can push higher toward ₹6,990.
Risk factors: RSI signals overbought zone; prone to sharp profit-taking.
Premium auto sector is sensitive to demand cycles and input costs.
Buy at: ₹6,927.50
Target price: ₹6,990
Stop loss: ₹6,896
How the market performed on Tuesday
The Nifty 50 rallied 169.90 points or 0.68% to close at 25,239.10, while the Sensex advanced 594.95 points or 0.73% to settle at 82,380.69. Nifty Bank ended 259.75 points or 0.47% higher at 55,147.60, signaling renewed optimism in financial majors.
Sector-wise, cyclical pockets fueled the rally — the auto index climbed 1.44%, the realty index rose 1.07%, and the infrastructure index gained 1.02%. On the other hand, the only laggard was the FMCG index, slipping 0.27%.
In stock-specific action, Kotak Mahindra Bank gained 2.58% on strong institutional buying, while Larsen & Toubro added 2.28% and Mahindra & Mahindra rose 2.20%. However, minor profit-booking in select heavyweights capped further upside as Tata Consumer Products slipped 0.95%, Shriram Finance dropped 0.89%, and Asian Paints declined 0.87%.
Nifty technical analysis: daily & hourly
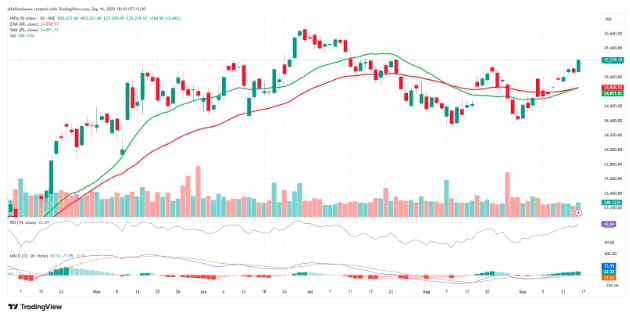
The Nifty 50 closed on September 16, 2025, with a strong gain of 169.90 points or 0.68 percent at 25,239.10. In yesterday’s update, I had mentioned that the market structure remained bullish and that dips near 25,000 were likely to attract buying interest. That view has played out well as the index not only held the key support but also broke out on the upside with conviction. On the daily chart, Nifty has registered a triangle breakout, a significant technical development that opens the door for an eventual move toward 26,750, provided the index sustains above 24,500.

View Full Image
Source: TradingView
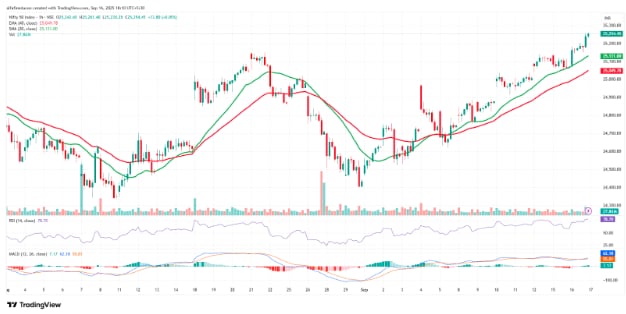
The moving average setup continues to support the broader uptrend with the 20-DMA at 24,851 and the 40-DEMA at 24,858 acting as a cushion. Daily RSI is placed at 63, comfortably in bullish territory, while the MACD is at +73 and continues to signal buy. On the hourly chart, the 20-HMA at 25,131 and the 40-HEMA at 24,949 highlight strong near-term support, while momentum remains robust with RSI at 78 and MACD at +62, confirming intraday strength despite overbought conditions.

View Full Image
Source: TradingView
The derivatives picture adds further confidence to the bullish stance. Total Put OI at 19.58 crore stands higher than Call OI at 14.56 crore, leaving a positive differential of 5.02 crore contracts. Fresh Put writing at the 25,200 strike, which now holds the highest OI as well as the highest additions, confirms that traders are building a strong base at higher levels. On the Call side, 25,250 remains the key resistance, but the unwinding of Call positions and shift in OI trends suggest that shorts are being squeezed, creating room for further upside.
In summary, the bullish structure I highlighted yesterday has been validated, and today’s breakout has strengthened the momentum further. Immediate support is now placed at 25,000–25,100, while resistance is seen at 25,250–25,300. A decisive move above 25,300 will open the path toward 25,500–25,750 in the near term, with a positional breakout target at 26,750 as long as Nifty holds above 24,500. The bias remains firmly bullish, and dips continue to present buying opportunities.
Ankush Bajaj is a Sebi-registered research analyst. His registration number is INH000010441.
Investments in securities are subject to market risks. Read all the related documents carefully before investing.
Registration granted by Sebi and certification from NISM in no way guarantee performance of the intermediary or provide any assurance of returns to investors.
Disclaimer: The views and recommendations given in this article are those of individual analysts. These do not represent the views of Mint. We advise investors to check with certified experts before making any investment decisions.
