EEnergy Read More Explore How States Are Advancing Distributed Energy2026-03-24 Demand for energy is increasing across the U.S. To meet these growing needs and support the power grid,…
DData Read More A human-centered approach to data visualization | MIT News2026-03-21 The world is awash in data visualizations, from charts accompanying news stories on the economy to graphs tracking…
DData Read More How State Data Can Help Prevent Suicide2026-03-17 As the 10th leading cause of death in the U.S., suicide poses a serious public health issue. High-quality…
DData Read More 7 Best Data Science Books to Boost Analytics Skills2026-03-17 1. Which book is best for beginners in data science? Data Science from Scratch is ideal for beginners.…
DData Read More Hadoop and R for Big Data Analytics2026-03-09 1. What makes Hadoop suitable for large-scale data processing? Hadoop distributes storage and computation across clusters, ensuring scalability,…
DData Read More Data Visualization Types Everyone Should Know2026-02-01 1. Why is data visualization important for decision-making?Data visualization simplifies complex information and helps patterns, trends, and risks…
DData Read More $10.63 Billion Big Data Analytics in Construction Market2026-01-29 Dublin, Jan. 29, 2026 (GLOBE NEWSWIRE) — The “Big Data Analytics in Construction Market Report 2026” has been…
DData Read More TCS’ Tech4HOPE Program Helps NAF Improve Educational Outcomes2026-01-28 NAF, a leading national education nonprofit organization, turned to Tata Consultancy Services’ Tech4HOPE pro bono consulting and services…
DData Read More Harvard University offers Data Science courses for free, check 7 free courses here2026-01-22 {{^userSubscribed}} {{/userSubscribed}} Harvard University is offering Data Science courses for free to all candidates interested in learning. The…
DData Read More Speeddiva Prosperity Group Led by Stephen Hawthorne Launches Financial Data Visualization Center2026-01-20 SEATTLE, WA / ACCESS Newswire / October 23, 2025 / Speeddiva Prosperity Group, co-founded by Stephen Hawthorne, has…
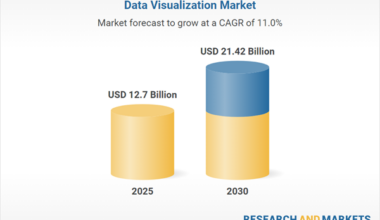
DData Read More Data Visualization Market – Forecasts from 2025 to 2030: Growth Propelled by the Exponential Increase in Data Generation, Necessitating Advanced Visualization Techniques2026-01-13 Company Logo The data visualization market is booming due to increased data generation, with a focus on advanced…
DData Read More Excel: The software that’s hard to quit2026-01-09 In the 1990s some computer games had a “boss key” that allowed staff to call up an Excel…