Design principles and simulation results
In the spatial frequency domain (k-space), the input electric field Ein(x,y) is represented by its Fourier transform, \({\widetilde{E}}_{{{\rm{in}}}}\left({k}_{{{\rm{x}}}},{k}_{{{\rm{y}}}}\right)=\iint {E}_{{{\rm{in}}}}(x,y)\exp (-i({k}_{{{\rm{x}}}}x{+k}_{{{\rm{y}}}}y)){dxdy}\), where x and y denote spatial coordinates, kx and ky represent the wavevector. Consequently, the light field is modulated by a wavevector-dependent OTF, with spatial frequency in k-space denoted as kr/k0 (\({k}_{{{\rm{r}}}}=\sqrt{{k}_{{{\rm{x}}}}^{2}+{k}_{{{\rm{y}}}}^{2}}\)). Following Fourier optics14, the target in k-space encompasses spatial frequencies ranging from low to high, and their relationship with the input electric field follows a sinc function. In particular, the radius ∆r of the low-frequency region depends on the location of the first zero point of the sinc function: \(\Delta r={{\rm{A}}}/\sqrt{{\Delta x}^{2}+{\Delta y}^{2}}\), where ∆x and ∆y represent the size of the input in the x- and y-coordinate, and A is a system-specific constant. This analysis establishes a constant spatial frequency range for a given system. As the size of the input target (∆x or ∆y) decreases in real space, the low-frequency radius in k-space expands, leading to a reduction in the high-frequency ratio, and vice versa. Further details, including the effects of noise and object positioning on the k-space distribution, are provided in SI Note 1. This property leads to distinct frequency distributions corresponding to different input sizes. Therefore, selecting an appropriate band-pass OTF that modulates and filters the information around the high- and low-frequency peaks facilitates size-selective image processing. Illustrated in Fig. 1, we analyze an ideal rectangular band-pass OTF denoted as H(kr), which can be expressed as:
$$H\left({k}_{r}\right)={{\rm{rect}}}\left(\frac{{k}_{r}}{{k}_{0}}\right)=\left\{\left\{\begin{array}{cc}0.1,\hfill & 0 \, \le \, \frac{{k}_{r}}{{k}_{0}} \,
(1)
where NA1,2 denotes the numerical apertures for which the rectangular function induces a step change. Specifically, the range NA1 to NA2 corresponds to the transmitted frequency information, while the rest needs to be partially filtered for size-selective image processing.
Fig. 1: Schematic of a size-selective imaging processor acting as a rectangular band-pass filter operator.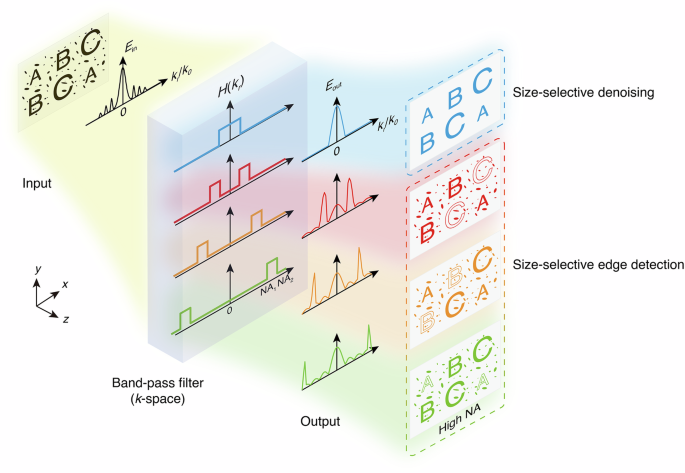
A conceptual illustration of a nonlocal flat optics-based filter, designed to execute the rectangular band-pass OTF (H(kr)), capable of modulating and filtering specific spatial frequencies associated with targets of different sizes. This modulation is achieved by configuring the band-pass numerical aperture (NA) range (NA1–NA2). Such customization facilitates differentiated image processing, including size-selective edge detection (red, yellow, and green parts), specifically, high NA edge detection (green part), and denoising (blue part) tailored to different targets. For example, the red part can detect the edge of the larger image ‘C’ but allows images with other sizes to pass through unchanged; similarly, the yellow part applies to image ‘B’, and the green part applies to the smaller image ‘A’. Meanwhile, the blue part effectively reduces noise without altering the images ‘A’, ‘B’, and ‘C’.
To realize the required transfer function, we use a Fabry–Pérot cavity-based MDM film comprised of Ag and MgF2 (Fig. 2a), effectively approximating a homogeneous medium (SI Note 2). According to Fresnel’s equation, the transmission (Ttot) can be expressed as \({T}_{{tot}}={T}^{2}/(1+{R}^{2}-2\sqrt{{R}^{2}}\cos \delta )\) for the light incident on the film from air (refractive index n0) at an angle θi. Here, R and T denote the reflection and transmission at the upper and lower interfaces of the film (details in SI Note 2), δ = (2π/λ)nhcosθi represents the phase accumulation within the film, where n and h denote the real part of the refractive index and thickness of the film, and λ is the incident wavelength. The transmission (Ttot) reaches its maximum when the phase is matched (δ = 2mπ, where m is an integer), revealing a periodic trend of decreasing wavelength with increasing incident angle. Accordingly, we identify three operating wavelengths—red (λ = 650 nm), green (λ = 532 nm), and blue (λ = 466 nm)—to realize size-selective imaging capability of the film. Through adjustments to the thicknesses of the metal and dielectric layers, we achieve the desired transfer functions at these wavelengths, resulting in corresponding thicknesses of 30 nm and 450 nm, respectively. As depicted in Fig. 2a, simulations are conducted to visualize color-coded electric fields corresponding to different incident wavevectors (NA = 0, 0.5, 0.9) at a wavelength of 650 nm. This result highlights that the film demonstrates a nonlocal effect and achieves maximum transmission only at the designated incident wavevector (NA = 0.5) for a specific operating wavelength (λ = 650 nm). Following this analysis, we numerically simulate the amplitude (|tpp(λ, kr)|) and phase (tpp(λ, kr)) of the transmission coefficients of p-polarized light across a wavelength range of 400–800 nm. As shown in Fig. 2b, our findings reveal a second-order resonance of this MDM film within the visible light range. Results for s-polarized light are available in SI Note 3. At three operating wavelengths, the transfer function adheres to a band-pass Gaussian type with properties akin to a rectangular band-pass function (SI Note 4). The NA range of the band-pass filter (NA1–NA2) corresponds to 0.43–0.6 NA (red), 0.93–0.99 NA (green), and 0–0.8 NA (blue), respectively. Notably, the transmission coefficient phase at 650 nm wavelength covers a range of 2π but has few effects on edge detection due to the jump corresponding to the filtered-out information, showing greater design freedom compared with the differentiation operators. The simulation results in Fig. 2c demonstrate the ability of the film to perform selective image processing for targets of different sizes at these three operating wavelengths. The resolution (d) of the optical system follows the Rayleigh criterion (d = 0.61λ/NA), where a higher numerical aperture leads to improved resolution. Based on the NA range of the band-pass filter (NA1–NA2), selective denoising is achievable for targets smaller than 0.35 μm under blue light. Additionally, selective edge detection can be performed for targets ranging from 327–348 nm under green light and 660–922 nm under red light, with corresponding theoretical edge detection resolutions of 327 nm for green light and 660 nm for red light.
Fig. 2: Size-selective image processor using a nonlocal MDM film.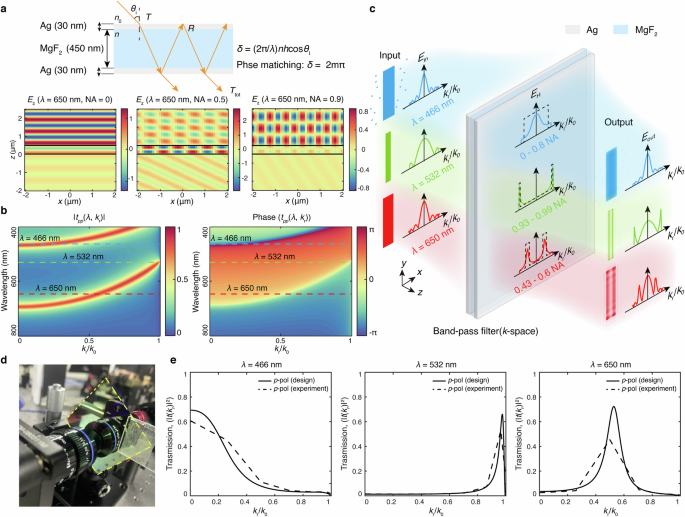
a The transmission principle involves light incidence at an angle θi into the MDM film, consisting of Ag and MgF2 layers with phase accumulation δ. Simulation of electric fields at various incidence wavevectors at a 650 nm wavelength showcases that the nonlocal effect is observable only when the phase is matched (NA = 0.5), leading to maximum transmission, while conversely, transmission is nearly zero for NA of 0 and 0.9. b Simulated color-coded transmission coefficient tpp(λ, kr), showcases a second-order resonance within the visible light for p polarization. The selected representative wavelengths include blue (λ = 466 nm), green (λ = 532 nm), and red (λ = 650 nm) light, indicated by the corresponding-colored dashed lines. c The designed OTFs demonstrate Gaussian-type band-pass filtering at three operating wavelengths with NA ranges of 0–0.8 NA, 0.43–0.6 NA, and 0.93–0.99 NA. The solid-colored lines depict the simulated OTFs, and the dashed lines represent the corresponding ideal rectangular band-pass OTFs. The simulation results demonstrate its size-selective denoising and edge detection capabilities. d Photo of the fabricated two-inch size-selective image processor (yellow dashed box). e Wavevector-dependent transmission spectra (|t(kr)|2) by ellipsometry at 466 nm, 532 nm, and 650 nm wavelength under p-polarized light (dashed lines), which align well with the simulation results (solid lines).
Fabrication and characterization of the processor
We fabricated a two-inch MDM film processor by using ion-assisted deposition (Fig. 2d) (Methods) to experimentally validate the design. To acquire the transmission spectrum of the sample as a function of the wavevector (|t(kr)|2), we conduct measurements using an ellipsometer at three operating wavelengths. The experimental transmission spectra under p-polarized light are shown in Fig. 2e, the trend of the measured spectra aligns well with the simulation. The measured transmission spectra for s-polarized light are shown in SI Note 5. It is worth noting that the measured transmission spectra under s polarization exhibit a similar trend to those under p polarization. Therefore, our processor demonstrates consistent image processing performance experimentally under p-polarized, s-polarized, and unpolarized light.
To validate the concept and quantify the resolution, we conducted imaging experiments on rectangular targets of various sizes, including their noise-perturbed counterparts, which allow us to characterize the processor’s capabilities in selective edge detection and denoising. These experiments are carried out using a standard microscope imaging setup (Methods, SI Note 6). The target employed here is a chromium (Cr) mask containing various types of structures (Methods). The imaging results within the red and green dashed boxes in Fig. 3a demonstrate the processor’s selective edge detection for targets of different sizes. The processor corresponds to edge detection sizes ranging from 1.6 to 2.3 μm and 0.9 to 1.6 μm under red (λ = 650 nm) and green (λ = 532 nm) light, respectively. The experimental edge detection resolution is measured as 0.9 µm under green light and 1.6 µm under red light. In addition, for the blue light (λ = 466 nm), the blue dashed boxes in Fig. 3a illustrate the selective denoising capability of the processor when the rectangular structures are encircled by randomly distributed square-shaped noise of varying sizes. In this demonstration, noise is efficiently removed when the size is smaller than 0.3 μm, whereas noise of 0.4 μm size is preserved.
Fig. 3: Characterizing size-selective imaging processor with artificial targets.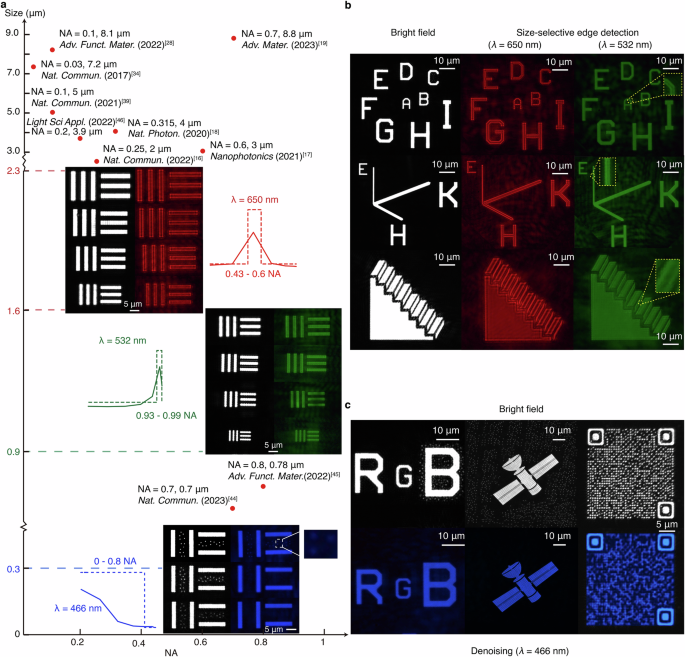
a The experimental resolution of the size-selective imaging processor under red (λ = 650 nm), green (λ = 532 nm), and blue (λ = 466 nm) lights. Under red and green lights, the processor demonstrates selective edge detection with sizes ranging from 1.6 to 2.3 μm and 0.9 to 1.6 μm, respectively. The insets depict the ideal optical transfer function of the image processor (dashed line) and the measured optical transfer function (solid line) at different operating wavelengths. Furthermore, under blue light, the processor efficiently engages in selective denoising of noise with a size less than 0.3 μm. Conversely, it preserves information when the noise size is 0.4 μm, as depicted in the inset that provides a magnified view of the retained noise. b The processor’s size-selective edge detection capability with artificial targets of diverse letters and shapes under red and green lights, encompassing the letters ‘A’ to ‘I’, the optical field vector diagram denoted as ‘E–H–K’, and the ‘Schrödinger staircase’. Specifically, under red light, the processor discernibly enhances the edges of letters ‘D’ to ‘I’ (size: 1.6–2.3 μm) and the letter ‘H’ with its axis (size of 2.2 μm). Conversely, under green light, the edge enhancement is observed on letters ‘A’ to ‘D’ (size: 1–1.6 μm) and the letter ‘E’ with its axis (size = 1.4 μm). Moreover, the ‘Schrödinger staircase’ achieves its artistic effect by designing the sizes of the upper (size of 2.3 μm) and side (size of 1.2 μm) surfaces. Consequently, the staircase imparts downward and upward visual effects under red and green light, respectively. The insets display locally magnified details of the structural features of the edges. c The size-selective denoising capability of the processor through the examination of the letters ‘RGB’, the ‘satellite’, and a QR code, with the size of the noise being 0.3 μm. In comparison to the results obtained through bright field imaging, the noise surrounding the letter ‘B’, the ‘satellite’, and the QR code is efficiently eliminated following the denoising.
Furthermore, we validate the size-selective imaging functionality by capturing images of various artificial shapes at different operating wavelengths. The pattern depicted in Fig. 3b, formed by the arrangement of letters ‘A’ to ‘I’, illustrates the output of selective edge detection for targets of various sizes. Specifically, precise edge detection is observed for the letters ‘D’ to ‘I’ or ‘A’ to ‘D’ under red and green light, respectively. Similarly, for a pattern of an optical field vector diagram labeled ‘E–H–K’, only the edges of the letter ‘H’ and its axis are enhanced under red light, while the letter ‘E’ and its axis are enhanced under green light. Additionally, we showcase the artistic effect of a ‘Schrödinger staircase’ by designing the widths of the upper and side surfaces of the staircase. The results exhibit a visually perceived downward or upward effect under red and green light, respectively.
In the presence of blue light, the processor also exhibits significant denoising effects for targets surrounded by noise of 0.3 μm in size, randomly distributed around them (Fig. 3c). In particular, for the letters ‘RGB’ and ‘Satellite’, the noise surrounding the letters ‘B’ and ‘Satellite’ is notably reduced with the incorporation of the processor compared to the imaging results in bright field. We further challenge the processor with a QR code embedded in noise. In bright-field imaging, the information within the code is unreadable. However, with the processor, the denoising operation significantly facilitates scanning, enabling smart devices to clearly identify the corresponding official ‘Chinese Academy of Sciences’ website. These results underscore the potential applications of the processor in diverse fields such as space remote sensing and consumer electronics. More size-selective imaging results with various shapes are available in SI Note 7. Compared to previous optical denoising methods46,49, our approach demonstrates a significantly broader operational size range. Furthermore, it offers advantages in alignment and fabrication, leveraging the inherent properties of optical thin films. Moreover, the spatial distribution of noise has minimal impact on the denoising results, as demonstrated in the analysis presented in SI Note 8.
Size-selective imaging in biological cells and target recognition
Bio-microscopic imaging stands as one of the applications for edge detection and denoising, primarily because biological cells pose challenges in direct imaging due to their properties, such as high transparency. Expanding upon the aforementioned capacity for size-selective imaging of artificial targets, we further illustrate its potential in bio-imaging. Yeast cells (size ~3 μm) and sperm cells of Simmental cattle (size ~1 μm) are selected as recognition targets based on their respective sizes. Experimental results manifest that the edges of yeast cells are enhanced under red light, with no such effect observed under green light and in bright field (Fig. 4a). Conversely, sperm cells show no noticeable edge enhancement under red light or in bright field, but enhancement is observed under green light (Fig. 4b). Leveraging these properties, we proceed to validate the processor’s ability to recognize different cells in a mixed state (Fig. 4c). Specifically, under red or green light in the mixed state, the processor retains its proficiency in precisely enhancing the edges of yeast or sperm cells while preserving the full images of another cell type. Given the size spread of biological cells, the edge enhancement effect is expected to be more pronounced in practical applications. As illustrated in bright field imaging results presented in Fig. 4c, a mixture of cells generates a considerable amount of noise, like living nanobacteria (size 4d, the processor successfully removes all the silver particle noise, making the yeast cells clearer. Furthermore, we experimentally showcase real-time denoising of dynamic nanobacteria distributed both inside and outside the cells by selecting three distinct instants. The observations reveal that, in the absence of the processor, the bacteria inside and outside the cells severely impact imaging quality, with the position of the bacteria outside the cells undergoing drastic changes over time. Upon the addition of the processor, the images of the nanobacteria both inside and outside the cells are substantially smoothed, thereby improving microscopy imaging quality and cell recognition ability (Fig. 4e). The movies provided in the Supplementary Information showcase the real-time ability and effectiveness of the processor in size-selective edge detection (Supplementary Movies 1–4) and denoising (Supplementary Movies 5 and 6), thus underscoring its potential for practical applications in microscopy imaging and recognition.
Fig. 4: Characterization of real-time size-selective imaging in dynamic living biological cells.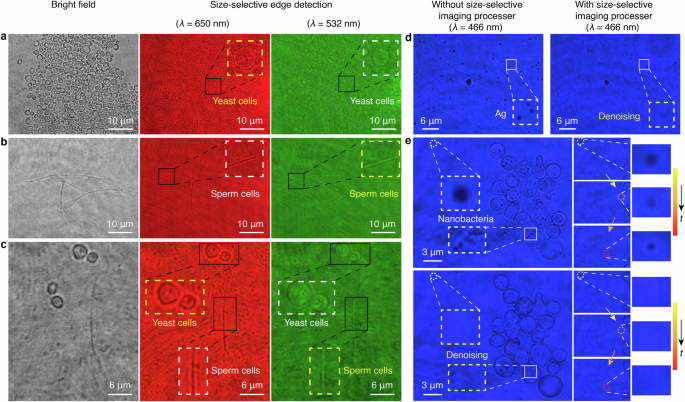
Size-selective edge detection experiments on yeast cells (size ~3 μm, (a)) and Simmental cattle sperm cells (size ~1 μm, (b)), both individually and in their mixed state (c). The edges of yeast cells are significantly enhanced under red light but remain nearly unchanged under green light. Conversely, the edges of sperm cells are significantly enhanced under green light but remain nearly unchanged under red light. The insets provide localized magnification results of selected cellular structures, highlighting effectively enhanced edges with yellow dashed boxes and the nearly unchanged parts with white dashed boxes. d Size-selective denoising experiments involving yeast cells surrounded by silver particles revealed a substantial impact on the imaging results in the absence of a processor. However, upon the insertion of the processor under identical imaging conditions, the noise is markedly reduced. The white and yellow dashed boxes highlight zoomed-in views of the same areas in the image, one with the processor and one without, respectively. e Size-selective denoising experiments on dynamic living nanobacteria distributed both inside and outside yeast cells, with a significant and time-dependent change in the location of the living nanobacteria outside the cells. In the insets, localized enlargements of the same nanobacteria are presented, showcasing images without and with the addition of the processor, demarcated by a white dashed box and a yellow dashed box. These insets on the right offer zoomed-in views of the nanobacteria, displaying positional shifts and tracked images at three different moments, both without and with the processor in place, respectively. This highlights the processor’s capability to remove noise and enhance the clarity of dynamic living nanobacteria imaging in real-time.
Edge detection and denoising are also crucial in target recognition, serving as preprocessing steps to enhance the efficiency of subsequent recognition processes. To validate the impact of size-selective imaging on enhancing target recognition capability and efficiency, we construct a recognition model utilizing the Visual Geometric Group-16 (VGG-16)50 (Methods). The artificial letters targeted illustrated in Fig. 3b, c are used as a case study. Leveraging its depth and small-size filters, the VGG-16 model exhibits outstanding efficacy in the letter recognition task. Our analysis compares the model’s performance in recognizing targets with uniform and size-selective edge-detection processing, and without and with denoising processing.
For edge detection processing, we choose the letter ‘D’ as an example recognition target for both the uniform and size-selective edge-detected tasks, with representative datasets shown in Fig. 5a. We analyze the accuracy of the model in identifying letters from both tasks (Fig. 5a). After the size-selective edge detection, the recognition accuracy for the letter ‘D’ reaches 90% after 59 epochs, while requiring 112 epochs with uniform edge detection. These results demonstrate that size-selective edge detection accelerates model convergence and reduces computational resources. For denoising processing, we recognize the letter ‘B’ with randomly distributed noise around it as well as the denoised one, respectively (Fig. 5b). The results show that the accuracy for the noisy image has low values around 40%, while after denoising the accuracy improves rapidly and converges to 96%. Furthermore, we conduct the ablation study and calculate the letter recognition accuracy in three cases: uniform edge detection with noise, size-selective edge detection with noise, and size-selective edge detection after denoising (Fig. 5c). After denoising and size-selective edge detection, the recognition accuracy reaches 90%. In contrast, for the other two cases, it is 33% and 22.5%, respectively, which further illustrates the improvement of size-selective imaging on target recognition performance. Upon analysis, size-selective edge detection and denoising exhibit several distinct advantages, including improved recognition accuracy and efficiency, as well as enhanced robustness. These findings highlight the potential role of size-selective image processing in enhancing the performance of target recognition.
Fig. 5: Improvement of target recognition performance by size-selective image processing and denoising.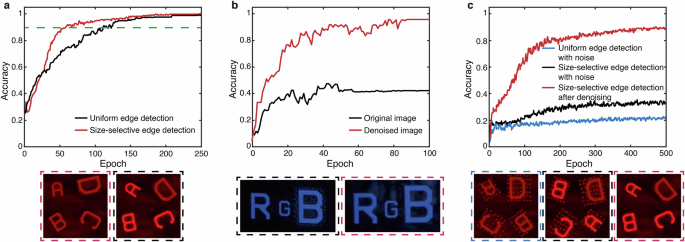
a The accuracy comparison between uniform edge-detected images (black line) and size-selective edge-detected images (red line) shows that size-selective edge detection achieves 90% recognition accuracy after 59 epochs, while uniform edge detection requires 112 epochs to reach the same level (green line). b Comparison of the recognition accuracy of the noisy images (black line) and the denoised images (red line). The accuracy of the noisy image is about 40%, while the accuracy of the denoised image rapidly increases to 96%. This shows that denoising significantly improves recognition accuracy. c The recognition accuracy of the uniform edge-detected images with noise (blue line), size-selective edge-detected images with noise (black line), and size-selective edge-detected images after denoising (red line) is 90%, 33%, and 22.5%, respectively. Representative datasets for the tasks are shown at the bottom.