
THz characterization of a photo-excited thin Si wafer
When a semiconductor is excited above band-gap, its optical properties are altered as it switches to the metallic state56. For an undoped Si wafer with few hundreds \({\rm{\mu }}{\rm{m}}\) thickness, PE by an intense fs, \(800\,{\rm{nm}}\) pulse results in an abrupt enhancement of THz reflectivity, from \(\sim 50 \%\) to \(> 90 \%\)57, which persists for a few \({\rm{ns}}\) until recombination is completed58. However, for a sufficiently thin (sub-wavelength) Si substrate, used in this work as switchable cavity mirrors, the THz reflectivity of the unexcited Si is \(\sim 10 \%\) (and \(\sim 90 \%\) THz transmission) owing to the zero-order Fabry-Pérot mode of the thin wafer59.
We start by characterizing the THz properties of a single Si mirror with thickness \({\rm{d}}=12\,{\rm{\mu }}{\rm{m}}\) subjected to PE by short \(110{\rm{fs}}\), Near-IR (\(800\,{\rm{nm}}\)) pulse60. The THz transmission of the unexcited, free-standing Si mirror, placed at the sample position (marked ‘S’ in Fig. 1) was measured (with beam ‘PE1’ while ‘PE2’ is blocked) and its complex refractive index \((\widetilde{n}=n+{ik})\) extracted by minimizing the difference between the experimental and theoretical transmission function61:
$$\widetilde{T}\left(\omega \right)=\frac{{\widetilde{E}}_{{sample}}\left(\omega \right)}{{\widetilde{E}}_{{air}}\left(\omega \right)}=\frac{4\widetilde{n}}{{\left(\widetilde{n}+1\right)}^{2}}\cdot \exp \left[i\frac{\left(\widetilde{n}-1\right)\omega d}{c}\right]\cdot \frac{1}{1-{\left(\frac{\tilde{n}-1}{\tilde{n}+1}\right)}^{2}\cdot \,{e}^{\frac{i2\tilde{n}\omega d}{c}}}$$
(1)
The numerical procedure for extracting \(\widetilde{n}\) is detailed in SI section S1.
Next, we characterized \(\widetilde{n}\) of the Si wafer following PE by beam ‘PE1’ (while ‘PE2’ is blocked, Fig. 2a) at varying pulse energies using the same procedure. [Note: throughout the paper \(100\,{\rm{\mu }}{\rm{J}}\) PE energy corresponds to \(120\,{\rm{\mu }}{\rm{J}}\,{{\rm{cm}}}^{-2}\) PE fluence]. Since the thickness of our Si wafer \((12\,{\rm{\mu }}{\rm{m}})\) is smaller than the penetration depth of undoped Si at \(800\,{\rm{nm}}\) (\(\sim 13.5\,{\rm{\mu }}{\rm{m}}\), ref.62), we assume homogeneous PE and uniform effective index.
Fig. 2: THz characterization of PE 12 μm Si wafer.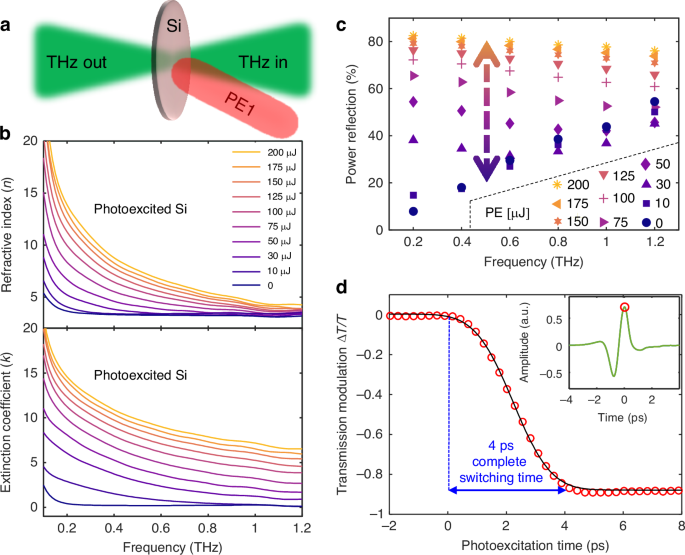
a A scheme of THz transmission through a single Si mirror, excited by the near-IR pulse (PE1). b Experimentally extracted refractive index \(\left(n\right)\) and extinction coefficient \((k)\) for varying PE1 energies. c Calculated power reflection as a function of PE1 energy (see legend) for selective THz frequencies. The double-sided arrow marks the \(0.53\,{\rm{THz}}\) region of interest, where PE1-induced reflectivity ranges from ~20–80% (d) Modulation of THz peak transmission (shown in the inset) vs. PE1 delay. Red circles mark the modulation of the peak THz field (shown in the inset) obtained in the experiment. The black curve is a fitted by an error function \(\frac{\varDelta T}{T}=A[1-{erf}\left(\frac{t-{t}_{0}}{\sqrt{2}\sigma }\right)]\) yielding a 10% – 90% of modulation range switching time of \(2.6\,{\rm{ps}}\). The complete switching time of \(4\,{\rm{ps}}\) is marked by the blue double-sided arrow
Figure 2b depicts the real (\(n\)) and imaginary (\(k\)) parts of the refractive index of the PE Si (Si*) in the frequency range of our THz field (\(0.2-1.2\,{\rm{THz}}\)), showing gradual increase in both \(n\) and \(k\) with PE1 pulse energy (for the complex permittivity of Si* see SI section S7). Figure 2c depicts the calculated power reflectance of Si*at several PE1 energies, with a \(\sim 10 \% \to 85 \%\) modulation range for the low THz frequencies and \(\sim 40 \% \to 80 \%\) for higher frequencies, showing the tunability range of the ultrathin Si mirrors provided by \(800\,{\rm{nm}}\) PE (see SI section S2). The temporal response (‘switching time’) of the Si was measured by parking the EO readout pulse at the peak of the transmitted THz transient (marked in the inset of Fig. 2d) as a function of PE1 delay. The peak THz transmission drops by a factor of \(10\) within \(4\,{\rm{ps}}\) after photoexcitation, establishing an upper bound for complete switching (blue arrow in Fig. 2d), and is attributed to thermalization of hot carriers via scattering and phonon interactions in Si.63
Switchable Fabry-Pérot Si cavity
Next we characterize the PE-induced response of an empty Fabry-Pérot cavity constructed of two free-standing Si wafers situated parallel to each other (Fig. 3a). One of the Si wafers was placed on a translation stage for precise control of the cavity length \(({L}_{{air}})\).
Fig. 3: Characterization of the switchable Fabry-Pérot Si cavity.
a Measurement scheme: empty FP cavity made of two Si wafers excited simultaneously by two near-IR pulses (PE1, PE2). In all of the measurements the THz probe succeeded the PE pulses by \(7\,{\rm{ps}}\) and \({L}_{{air}}\) was kept fixed at \(925\,{\rm{\mu }}{\rm{m}}\) (b) Time-resolved THz transmission of unexcited and PE cavity at different pulse energies (color-coded). The inset shows the phase shift between adjacent transients of the unexcited cavity (black curve) and PE cavity (red curve). c Transmission spectra obtained by Fourier transformation of the TD-THz signals of Fig. 3b, showing multiple FP modes. The PE-induced redshifts of the modes are marked by dashed black arrows. TMM calculations are shown by solid green lines. d A sketch of the FP cavity for unexcited (grey) cavity and PE (red) cavity. Possible mode configurations are marked by double-sided red arrows, and the reflection phase at each interface is noted. Degenerate modes are grouped by the dashed blue rectangles. e The detuning of the m=3 cavity mode (set \(\sim 0.53\,{\rm{THz}}\)) as a function of PE energy. f The linewidth \({(\gamma }_{c})\) and cavity Q-factor of the m=3 mode at varying PE energies
Figure 3b shows the time resolved THz transmission of the cavity with \({L}_{{air}}=925\,{\rm{\mu }}{\rm{m}}\) for the unexcited (black curve) and excited (by both PE1 and PE2) with \(50\,{\rm{\mu }}{\rm{J}},100\,{\rm{\mu }}{\rm{J}}\) and \(200\,{\rm{\mu }}{\rm{J}}\) (Red, Blue and Pink respectively, each normalized by the first transient). A series of pulses (cavity reflections), separated by the cavity roundtrip is observed. In the unexcited cavity this series of reflections is strongly damped due to the low reflectivity of the Si wafers (low-Q cavity, short lifetime). Upon PE by PE1 and PE2, the Si wafers turn into effective cavity mirrors, manifested by increased cavity lifetime (reduced damping, higher-Q) as PE energy increases. We note that the PE pulses preceded the THz probe by \(7\,{\rm{ps}}\) to accommodate for the \(4\,{\rm{ps}}\) switching time and the complete duration of the THz field (\(\sim 3\,{\rm{ps}}\), see inset in Fig. 2d). For longer delays between the PE and THz up to \(\sim 300\,{\rm{ps}}\) (the maximal delay afforded by our setup), the transmission spectra remains identical to that presented (with \(7\,{\rm{ps}}\)). Figure 3c shows the power spectrum obtained by Fourier transformation of the time-domain signals of Fig. 3b. The solid green curves, calculated using the transfer matrix method (TMM; see Methods section) are in good agreement with color-coded experimental results. In the frequency domain, the increased lifetime of the PE cavity manifests as a narrowing of the FP mode linewidths with increasing PE energy.
A key finding of Fig. 3c is the redshift of the FP modes upon PE of the Si wafers (marked by the dashed black arrows), where the m = 1 cavity mode shifted from \(0.23\,{\rm{THz}}\to 0.16\,{\rm{THz}}\) upon PE, \(m=2:\,0.38\,{\rm{THz}}\to 0.32\,{\rm{THz}}\), \(m=3:\,0.53\,{\rm{THz}}\to 0.48\,{\rm{THz}}\) with the same trend at higher modes. To explain the red-detuning of the cavity upon PE, we must first identify the effective cavity boundaries (interfaces) of the unexcited cavity modes.
Identification of the dominant unexcited cavity mode
The unexcited Si–air–Si stack supports several possible mode configurations (Fig. 3d, i-iv). Comparison between analytical transfer-function calculations (for the selective mode configurations shown in Fig. 3d) and TMM calculation of the entire Si-air-Si stack, identify configuration (iv), degenerate modes bounded by the inner air–Si interface of one mirror and the outer Si–air interface of the other, as the dominant contribution to the unexcited cavity spectrum. This is confirmed by the time-domain signal (Fig. 3b, inset), where consecutive THz transients alternate in phase by \({\rm{\pi }}\). Such a shift is a direct manifestation of Fresnel reflection, requiring one reflection at a low-to-high index interface (air-Si) and one at a high-to-low interface (Si-air) per roundtrip. For a detailed derivation and selective analytical calculations see SI Section S9.
Mechanism of the PE-induced redshift
Upon photoexcitation (PE), the Si wafers transform into effective metallic mirrors (Si*), confining the THz field between the two inner air–Si* interfaces (see excited cavity colored red in Fig. 3d). This transition induces two competing effects on the resonance frequency, governed by the Fabry-Pérot (FP) round-trip phase condition,
$${\phi }_{{rt}}={\phi }_{{prop}}+{\phi }_{r1}+{\phi }_{r2}=2{\rm{\pi }}q$$
(2)
(where \({\phi }_{{prop}},\,{\phi }_{r1},\,{\phi }_{r2}\) are the propagation and reflection phases at the two cavity interfaces respectively and \(q\) is an integer).
Effect 1 – Reflection Phase Shift:
-
Unexcited Cavity: Based on the identified dominant mode (configuration iv), the field accumulates a total reflection phase of \({\rm{\pi }}\) per round trip (\({\phi }_{r1}\, \sim \,0\) at Si-air and \({\phi }_{r2}\, \sim \,{\rm{\pi }}\) at air-Si).
-
Excited Cavity: After PE, the field is confined by two metallic Si* mirrors, each contributing a \({\rm{\pi }}\) phase shift. The total round-trip reflection phase thus doubles to \(2{\rm{\pi }}\).
Effect 2 – Physical Shortening: The reflecting planes shift from the outer Si-air interfaces to the inner air-Si* interfaces. This reduces the propagation length by \({n}_{{Si}}\cdot {L}_{{Si}}\) per mirror, which by itself would cause a blueshift.
Resonance frequencies of the two states of the cavity
Substituting the respective reflection phases at the cavity interfaces and optical paths into the resonance condition of Eq.2 and defining \(m\equiv q-1\) as mode number (See SI section 8), we derive the resonance frequencies \((\nu =c/\lambda )\) for the two states of the cavity:
For the unexcited cavity:
$$\frac{4\pi ({n}_{{Si}}{\cdot L}_{{Si}}+{n}_{{air}}\cdot {L}_{{air}})}{{\lambda }_{{un}}}+\mathop{\underbrace{{\phi }_{{Si},{air}}}}\limits_{\approx 0}+\mathop{\underbrace{{\phi }_{{air},{Si}}}}\limits_{\approx \pi }=2\pi (m+1)\Longrightarrow {{\boldsymbol{\nu }}}_{{\boldsymbol{un}}}=\frac{({\bf{2}}{\boldsymbol{m}}{\boldsymbol{+}}{\bf{1}})\cdot {\boldsymbol{c}}}{{\bf{4}}\cdot ({{\boldsymbol{n}}}_{{\boldsymbol{Si}}}{\cdot {\boldsymbol{L}}}_{{\boldsymbol{Si}}}{\boldsymbol{+}}{{\boldsymbol{n}}}_{{\boldsymbol{air}}}{\cdot {\boldsymbol{L}}}_{{\boldsymbol{air}}})}$$
For the excited cavity:
$$\frac{4\pi ({n}_{{air}}\cdot {L}_{{air}})}{{\lambda }_{{ex}}}+\mathop{\underbrace{{\phi }_{{air},{{Si}}^{* }}}}\limits_{=\pi }+\mathop{\underbrace{{\phi }_{{air},{{Si}}^{* }}}}\limits_{=\pi }=2\pi (m+1)\Longrightarrow {{\boldsymbol{\nu }}}_{{\boldsymbol{ex}}}=\frac{{\bf{2}}{\boldsymbol{m}}\cdot {\boldsymbol{c}}}{{\bf{4}}{\cdot {\boldsymbol{n}}}_{{\boldsymbol{air}}}{\cdot {\boldsymbol{L}}}_{{\boldsymbol{air}}}}$$
where \({\phi }_{i,j}\) are the reflection phases at the cavity interfaces64 where \({\phi }_{i,j}={{\arg }}\left({\widetilde{r}}_{i,j}\right)\) and \({\widetilde{r}}_{i,j}=\frac{{\tilde{n}}_{i}-{\tilde{n}}_{j}}{{\tilde{n}}_{i}+{\tilde{n}}_{j}}\) is the reflection coefficient (SI section S3).
For our experimental parameters (\({L}_{{Si}}=12\,{\rm{\mu }}{\rm{m}},\,{n}_{{Si}}\cong 3.42,\,{L}_{{air}}=925\,{\rm{\mu }}{\rm{m}},\,{n}_{{air}}=1,\,m=3\)), the calculated values, \({\nu }_{{un}}=0.54\,{\rm{THz}}\) and \({\nu }_{{ex}}=0.48\,{\rm{THz}}\) are in excellent agreement with the experimental results and TMM simulations. This confirms that the additional \({\rm{\pi }}\) reflection phase increases the effective optical length by \(\sim \lambda /2\), overriding the \({n}_{{Si}}{\cdot L}_{{Si}} \sim 41\,{\rm{\mu }}{\rm{m}}\) physical shortening and resulting in the observed redshift.
While the above analytical expressions for \({\nu }_{{un}}\) and \({\nu }_{{ex}}\) neglect THz dispersion in Si and approximate reflection phases as either \(0\) or \(\pi\) for brevity, they accurately reproduce the resonance frequencies shown in Fig. 3c. Beyond this validation, the model provides a framework to design switchable cavities tailored to specific material transition frequencies by predicting the resulting PE-induced shifts (see SI sections S4 and S11 for further examples and design tables).
PE energy – dependent cavity response
To further characterize the switchable response, we examine an empty cavity \(({L}_{{air}}=836\,{\rm{\mu }}{\rm{m}})\), where the unexcited \(m=3\) mode is \({\nu }_{{un}}\approx 0.58\,{\rm{THz}}\). Figure 3e shows the experimentally measured detuning \((\triangle \nu ={\nu }_{{ex}}-{\nu }_{{un}})\) as a function of PE energy. The mode gradually red-detunes with increasing energy, reaching a stable shift of \(\triangle \nu \,\simeq -50\,{\rm{GHz}}\) at \(35\,{\rm{\mu }}{\rm{J}}\) – a limit bound by the \(\pi\) reflection phase at the air-Si* interface. Simultaneously, the cavity Q-factor increases from \(\sim 6.5\) (unexcited) to \(\sim 25\) at \(200\,{\rm{\mu }}{\rm{J}}\) as the Si* mirrors become increasingly reflective (Fig. 3f). At low PE energies \((0\,{\rm{\mu }}{\rm{J}}\to 20\,{\rm{\mu }}{\rm{J}})\) the Si has not yet reached a fully metallic state; in this intermediate regime, increased absorption (see Fig. 2b for extinction coefficient) causes a transient broadening of the linewidth (\({\gamma }_{c}\) increases from \(80\,{\rm{GHz}}\) to \(123\,{\rm{GHz}}\)) and a slight reduction (from \(6.5\) to \(\sim 5\)) in Q-factor (see SI section S7).
Ultrafast triggered strong-coupling of
α
-lactose monohydrate in PE Si cavity
In what follows we utilize the switchable FP Si cavity to trigger strong-coupling between α-lactose monohydrate (α-LM) and PE Si cavity. Limited by the fragility of α-LM pellets with thickness below \(\sim 100\,{\rm{\mu }}{\rm{m}}\) and in order to secure sufficient air-gap for cavity detuning measurements, we chose to couple the collective vibration of α-LM at \(0.53\,{\rm{THz}}\)52 with the third mode of the cavity (m = 3). α-LM crystallites in powder form (Sigma-Aldrich CAS No: 5989-81-1) were pressed in a pressing die to form a \(270\,{\rm{\mu }}{\rm{m}}\) thick pellet sample (see methods section). The complex refractive index of the free-standing α-LM pellet was extracted from THz transmission measurements and is shown in Fig. 4b. Next, the α-LM pellet was mounted on one of the Si wafers and the open FP cavity was constructed by placing another Si wafer parallel to the first (Fig. 4a). The latter was mounted on a computer-controlled linear translation stage to enable precise cavity detuning measurements.
Fig. 4: Triggering strong coupling of α-lactose in cavity.
a Measurement scheme: switchable FP cavity with a 270\(\,{\rm{\mu }}{\rm{m}}\) α-LM pellet embedded inside. b Complex refractive index of α-LM extracted from time-domain THz spectroscopy of a free-standing α-LM pellet. c PE-induced decoupling of cavity and α-LM showing a transition from the coupled state (upper panel, unexcited) to the uncoupled state (lower panel, \(150\,{\rm{\mu }}{\rm{J}}\)). d PE-induced strong-coupling of cavity and α-LM showing a transition from the uncoupled state (upper panel, unexcited) to the strongly coupled state (lower panel,\(\,150\,{\rm{\mu }}{\rm{J}}\)). THz transmission spectra with varying PE pulse energies are shown. Blue curves in (c) and (d) depict the experimental data overlaid with their corresponding TMM simulations depicted by the dashed green curves. In both scenarios the PE pulse preceded the THz probe by \(7\,{\rm{ps}}\) to accommodate the \(4\,{\rm{ps}}\) switching time and the temporal width (\(\sim 3\,{\rm{ps}}\)) of the THz
Figure 4c, d feature the main experimental scenarios provided by the switchable cavity: PE-induced light-matter decoupling (4c) and PE-induced strong light-matter coupling (4d). In both scenarios (Fig. 4c, d) the PE pulse preceded the THz probe by \(7\,{\rm{ps}}\) beyond which (up to \(\sim 300\,{\rm{ps}}\), limited by our delay stage), the transmission spectra remain identical to that obtained with \(7{\rm{ps}}\).
In Fig. 4c we set \({L}_{{air}}=410\,{\rm{\mu }}{\rm{m}}\) such that the m = 3 frequency of the unexcited cavity is resonant with the \(0.53\,{\rm{THz}}\) transition of α-LM. The transmission spectrum in the range \(0.4\,{\rm{THz}}-0.65\,{\rm{THz}}\) is depicted for several PE energies. The unexcited cavity (upper panel of Fig. 4c) shows a frequency splitting of \(67\,{\rm{GHz}}\) around \(0.53\,{\rm{THz}}\). Upon PE of the Si wafers with \(5\,{\rm{\mu }}{\rm{J}}\) (PE1 and PE2), the mode undergoes a slight redshift, resulting in a small detuning of the coupled system from resonance. With \(30\,{\rm{\mu }}{\rm{J}}\) the \(m=3\) mode is redshifted by \(\sim 50\,{\rm{GHz}}\), and is far-detuned from the α-LM transition. Further increase in PE energy from \(30-150\,{\rm{\mu }}{\rm{J}}\) results in gradual narrowing (Q-factor increase) albeit without further detuning, in agreement with the data of Fig. 3e, f. We note that the coupling strength of the unexcited Si cavity is significantly limited by the low reflectivity of unexcited Si. Nevertheless, the potential for all optical PE-based control of the cavity-material coupling is clearly demonstrated.
In the remaining of the paper we analyze the scenario of Fig. 4d where the switchable cavity is utilized as a dynamic mechanism to abruptly transition the system from completely uncoupled state to the strong light-matter coupling regime.
The upper panel of Fig. 4d shows the transmission spectrum of the unexcited cavity with \({L}_{{air}}=320\,{\rm{\mu }}{\rm{m}}\), such that both the \(m=2\) (\(0.45\,{\rm{THz}}\)) and \(m=3\) \((0.58\,{\rm{THz}})\) modes (marked by red arrows) are far detuned from the α-LM transition frequency which manifest as an absorption dip at \(0.53\,{\rm{THz}}\). Upon weak PE with \(5\,{\rm{\mu }}{\rm{J}}\), the FP modes are slightly redshifted and remain far-detuned from the α-LM transition. With \(30\,{\rm{\mu }}{\rm{J}}\) PE energy, the \(m=3\) mode is redshifted to \(0.53\,{\rm{THz}}\) and strong-coupling is evidenced by polariton splitting (the \(m=2\) mode frequency is shifted to \(0.39\,{\rm{THz}}\), beyond the lower limit of the figure). Increasing the PE energy to \(150\,{\rm{\mu }}{\rm{J}}\) results in gradual narrowing of the polariton spectra accompanied by a slight reduction in the splitting frequency. In order to account for possible thermal-induced reflectivity bias of the Si wafers that may develop through long-time irradiation by PE1 and PE2 (1 \({\rm{KHz}}\) repetition rate), we reversed the time-ordering of the pulses such that the THz probe precedes the PE by \(\sim 60\,{\rm{ps}}\). A negligibly small thermally induced cavity response was observed, with a transmission spectrum practically identical to that of the unexcited cavity (see SI section S6), confirming that the observed cavity response originates solely from above band-gap PE.