Study design and settings
This cross-sectional observational study was conducted between January and March 2024 using an anonymous online questionnaire after obtaining institutional review board approval from Princess Nourah bint Abdulrahman university (23-1049) and following the Declaration of Helsinki, the International Medical Association’s code of ethics.
Study population
Saudi residents aged 18 and above were recruited through various social media platforms. Participants were informed about the study’s objectives and provided electronic informed consent prior to participation. Responses that were incomplete or submitted by individuals under the age of 18 were automatically excluded from the analysis.
Sample technique
The sample size was calculated using G-power based on an expected difference of 0.10, a margin of error of 2.5%, a 95% confidence interval (alpha = 0.05), and a study power of 99%. This yielded a sample size of 912, which was increased to 1377 to ensure adequate data quality and to account for potential issues like incomplete responses. A convenience sample from various regions across Saudi Arabia were recruited. While this method enabled efficient data collection, it may introduce selection bias and limit the generalizability of the results due to potential over- or under-representation of certain groups. However, the relatively large sample size might have improved representativeness and allowed for more detailed subgroup analyses, thereby increasing statistical power and the relevance of the findings. Moreover, data quality was maintained by applying defined inclusion criteria, and by utilizing standardized, validated Arabic versions of the Cyberchondria Severity Scale12, and the Somatic Symptom Scale13.
Data collecting instrument
The questionnaire was designed to collect information on participants prevalence of internet self-diagnosis, cyberchondria severity score, somatic symptom score, and sociodemographic details. Sociodemographic section gathered information on age, gender, marital status, nationality, area of residence, educational level and background, monthly income, chronic diseases, weight, and height.
The prevalence of participants’ use of internet self-diagnosis and its impact on their medical-seeking behavior were evaluated through a series of questions. Participants reported the frequency of their self-diagnosis behaviors on a five-point Likert scale, ranging from “Never” to “Very often; more than six times.” This section also examined motivating factors driving the use of internet self-diagnosis, such as the types of health conditions and symptom severity they searched for, assessed through six yes/no questions. Additionally, participants indicated their preference for self-diagnosis over seeking professional advice using yes/no question and rated their reasons for this preference, using a five-point Likert scale from “Strongly disagree” to “Strongly agree.” The outcome of internet self-diagnosis on participants’ self-management behaviors was also evaluated through multiple-selections question.
Cyberchondria Severity Scale (CSS) was used to measure excessive internet health-related use and associated anxiety. The validated Arabic version of the questionnaire12 was used to ensure linguistic and cultural appropriateness for the Saudi population. It contained 12-items scored on a Likert-type system ranging from 1 (never) to 5 (always). Total scores ranged from 12 to 60 where higher scores indicated greater severity and likelihood of cyberchondria. The scale assessed four factors: excessiveness, distress, compulsion, and reassurance showing high internal consistency, with a Cronbach’s alpha of 0.92. In the current study, Cronbach’s alpha of the CSS was 0.88.
Somatic Symptom Scale (SSS) had strong psychometric properties and consisted of 8-item scale that assessed the somatic symptom burden on individuals with overall Cronbach’s alpha of 0.8014. The Arabic version of the 8-item scale had been utilized by Alalawi et al.13 to assess somatic symptom disorder among Arabic-speaking populations at the primary healthcare level, indicating its applicability in this context13. Each item was scored on a Likert-type system ranging from 0 (not at all) to 4 (very much); total scores ranged from 0 to 32. Scores of 0–3 indicated no to minimal burden, 4–7 indicated low burden, 8–11 indicated medium burden, 12–15 indicated high burden, and 16–23 indicated very high burden13. In the current study, the Cronbach alpha of SSS was 0.82.
Participant recruitment and data quality assurance
Data were collected through an online questionnaire distributed via widely used social media platforms in Saudi Arabia, including Twitter (X), WhatsApp, and Instagram, to ensure broad reach across various regions and different segments of the Saudi population. The internet usage in Saudi Arabia is reported to be 100% in year 2023 according to World Telecommunication indicators database15. As the target population of the study are those who are using the internet to estimate the cyberchondria level, the online distribution of the questionnaire was the best choice for reaching the largest number of the target population. No paid advertisements or targeted demographic strategies were employed. The online questionnaire was designed using obligatory response settings, which required participants to complete all items before submission preventing duplicate submissions by restricting responses to one per device. Additionally, incomplete questionnaires were automatically excluded from the final dataset to maintain the integrity and reliability of the collected data. The questionnaire achieved an 84% completion rate, with a total of 1,377 completed responses.
Statistical analysis
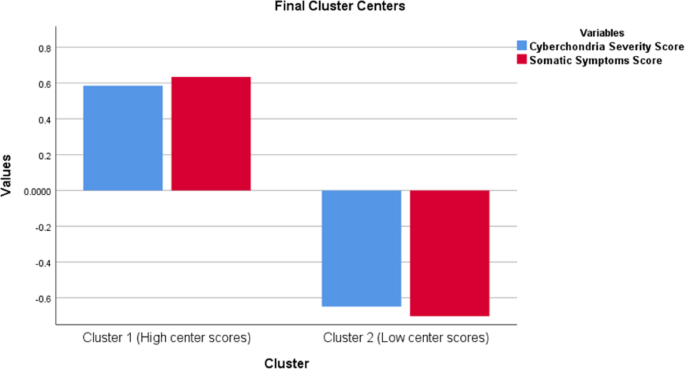
Data was entered and analyzed using SPSS. K-means cluster analysis was applied to classify participants into two distinct groups—low and high—based on scores from the Cyberchondria Severity Scale and Somatic Symptom Scale. This method identified natural groupings with similar characteristics by minimizing the distance between data points and their cluster centroids, resulting in compact, well-separated clusters. This grouping enabled meaningful segmentation for analyzing associations with sociodemographic characteristics and internet self-diagnosis behavior. Descriptive statistics were presented using frequencies and percentage for qualitative variables, in addition to means and standard deviations for quantitative variables. Chi-square tests were employed to examine the relationships between categorical variables. T-tests were utilized to compare mean differences in continuous variables. The level of significance was set at p