We made use of RR Lyrae-based distances for the Andromeda galaxy and 37 of its dwarf satellites compiled in ref. 18. From this published sample of stellar systems, we excluded the heavily disrupted Giant Stellar Stream. We included IC 1613 and Peg DIG in our working sample despite their outlying distance from M31, but confirmed that their exclusion does not significantly affect our results. The recently discovered Peg V45 lacks the deep Hubble Space Telescope imaging necessary for the RR Lyrae approach. Its associated TRGB distance of \(69{2}_{-31}^{+33}\,{\rm{kpc}}\) places it firmly on the near side of M31, intensifying the existing asymmetrical trend. Dwarf coordinates were taken from the Local Volume catalogue46,47, a compilation of galactic objects within 10 Mpc from the Local Group.
We accounted for the associated distance uncertainties by generating 10,000 Monte Carlo realizations as follows. For each realization, distance errors were drawn from a Gaussian distribution for each satellite galaxy (with a standard deviation equivalent to the quoted uncertainty) and applied to their expected positions along the respective line-of-sight vectors. A distance error for M31 was then drawn in the same way, and was further applied to all satellite positions along M31’s line of sight—thus yielding realizations still centred on the system’s host galaxy. Note that errors modelled by this Monte Carlo approach were only used to quantify the properties of the observed M31 system (and hence in Fig. 2).
Primary metrics of asymmetry
The most straightforward manner in which one may quantify the degree of asymmetry in a given satellite system is by counting the number of satellites on each side of an arbitrarily oriented plane, which effectively divides the system into two hemispheres. By repeating this check for 100,000 planes with isotropically distributed normal vectors, we found the plane that shows the greatest disparity between the two hemispheric satellite populations—we refer to this plane as the ‘plane of maximum asymmetry’. The two satellite populations on either side of the plane of maximum asymmetry is usually expressed as a ratio, but as all sampled systems have exactly 37 satellite galaxies, we simply quote the number of satellites in the more populated hemisphere as the system’s maximum hemisphere population Nlop. The orientation of the system’s asymmetry is expressed as the normal vector of the plane of maximum asymmetry, pointing towards the direction of satellite excess. It is important to note that more than one hemisphere containing the same, maximized set of satellites can exist if the maximum angular range spanned by the satellites is marginally less than 180°. Hence, the orientation of a system’s lopsidedness according to the hemisphere metric entails a small degree of intrinsic error.
For systems of paired hosts, an often-used variation of this metric18,20,24 effectively ‘locks’ the dividing plane’s normal vector to the vector pointing from the satellites’ host galaxy to its companion: the ‘pair vector’, \({\hat{x}}_{{\rm{pair}}}\). The population of the hemisphere oriented in the same sense as the pair vector is denoted Nlop,pair, although it and Nlop are frequently used interchangeably in the literature due to the M31 system’s hemispheric asymmetry being roughly oriented towards the Milky Way.
Although the maximum hemisphere population of a given satellite distribution is the most intuitive metric by far, it fails in identifying satellite clusters constrained to a small solid angle or angular regions unnaturally devoid of satellites. For a more comprehensive characterization of satellite excesses and underdensities, we defined a series of cones with corresponding opening angles θ (up to a full sphere at θ = 180°). For each cone, we generated 100,000 isotropically distributed so-called grid vectors, centred the cone on each grid vector and identified the number of satellites enclosed within the conical volume. For each θ, we recorded the most populated cone—with an associated population Nθ—and its orientation. As such, each of these cones of maximum asymmetry may be oriented in different directions with varying θ. We generated 359 cones per system, spanning a range of θ = [0.5, 180]° in 0.5° increments. Much like the hemisphere metric, the orientation of the cones may be ‘locked’ to a host galaxy’s pair vector \({\hat{x}}_{{\rm{pair}}}\) (ref. 24). In this case, the number of satellites in each companion-locked cone with opening angle θ is denoted Nθ,pair.
A weakness of both of the above approaches is the unintuitive nature of deriving Nlop and Nθ expected in an isotropic satellite distribution. In the limit of an infinitely populated system, we can approximate the satellite distribution as a constant-density field, and may hence expect the hemisphere or cone of maximum asymmetry to enclose 1/2 or Ω/4π of the satellite population (where \(\varOmega =4\uppi {\sin }^{2}(\theta /2)\) is the solid angle associated with the cone’s opening angle θ). However, with a realistic and limited number of satellites, there will generally exist a hemisphere or cone that manages to capture more than the above expectation. A system of two satellites will always yield Nlop = 2, for instance, unless the satellites happen to be perfectly diametrically opposed. Conversely, the companion-locked variants follow the naive expectation from isotropy if pair vectors are randomly drawn.
Supplementary metrics of asymmetry
Lopsidedness in satellite galaxy distributions is a nuanced topic, and the metric adopted to quantify it will determine what aspects of the asymmetry are most represented. While we adopt the cone-based approach as our primary metric of asymmetry in this work, we also consider several supplementary metrics previously used in other work.
The hemisphere and cone approaches discussed above solely focus on the angular distribution of satellites while disregarding their distance from their host. Hence, the metrics are less sensitive to lopsidedness caused by a translation of the satellite distribution away from their host. To account for this, we calculated the unweighted centroid of satellites for a given system and measured its distance from the host galaxy’s position. As this centroid shift is determined by both the system’s degree of lopsidedness and the characteristic distance of its subhaloes, we normalized the shift by drms, the root-mean-square distance of the satellites from their host. This yielded dnorm, the normalized centroid shift from the system’s host galaxy. It should be noted that dnorm is highly sensitive to outlying satellites, and conversely insensitive towards those that are centrally distributed within their system. One group19 previously reported a three-dimensional centroid shift of 84 kpc derived for 16 of M31’s satellites, which drops to 50 kpc when removing the outlying Peg DIG and IC 1613 from their sample. Using the larger satellite sample from ref. 18, we recovered a similar centroid shift of 75 ± 15 kpc (or 62 ± 17 when excluding the 2 outlying satellites).
One of the most common metrics of lopsidedness found in the literature is the distribution of pairwise satellite angles20,27. In a given satellite system, each unique combination of two satellites has a corresponding angular separation, θij. The mean of θij across all possible satellite pairs—the mean pairwise angle θlop—should tend towards 90° in an isotropic distribution. A heavily lopsided distribution implies that a majority of satellites occupy a small region of angular space, and hence a reduced θlop. This approach can also be adapted for host galaxies with associated companions. Instead of measuring pairwise angles between all satellites, many studies23,24,25,32 instead measure the distribution of angles, θi,pair, between each satellite and the system’s \({\hat{x}}_{{\rm{pair}}}\). The corresponding mean angle is denoted θlop,pair. The same expectation of 90° holds for isotropic systems, while θlop,pair θlop,pair > 90° indicate that the satellites are lopsided towards and away from the companion galaxy, respectively. The M31 system shows a mean pairwise angle of θlop = 83° ± 6° and a mean alignment with the Milky Way of θlop,pair = 70° ± 10° (when sampling distance errors from the Andromeda satellites).
Finally, the mean resultant length (MRL) is a circular statistic that effectively describes the directionality of a satellite distribution, and was recently adopted in ref. 26 as an alternative to their previous, pairwise angle approach25. For a system consisting of N satellites, each with position xi relative to their host, the MRL is defined by summing satellite unit vectors and dividing the resulting vector’s magnitude by N:
$$\bar{R}=\left\vert \frac{1}{N}\mathop{\sum }\limits_{i=1}^{N}\frac{{{\bf{x}}}_{i}}{\left\vert {{\bf{x}}}_{i}\right\vert }\right\vert .$$
(1)
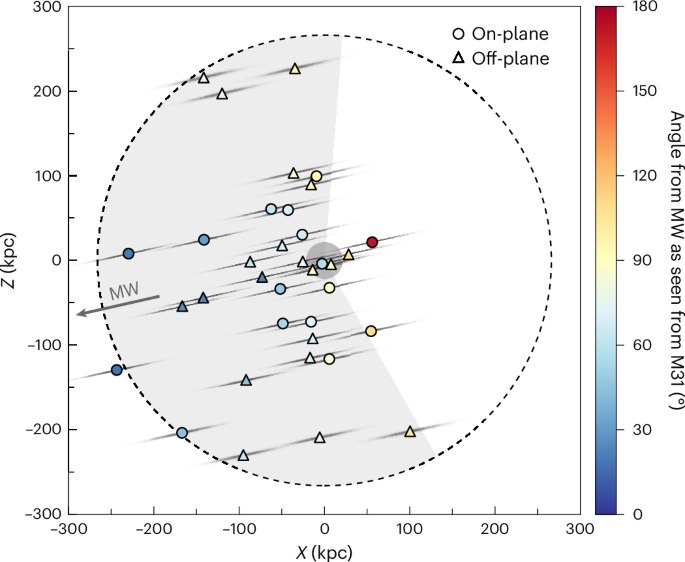
A perfectly isotropic distribution should yield \(\bar{R}=0\), whereas an unrealistic system with satellites located along a single angular position would produce \(\bar{R}=1\). The Andromeda system yields an MRL vector of magnitude \(R=0.3{6}_{-0.14}^{+0.10}\) oriented at 28° from the line of sight to the Milky Way (Fig. 2).
Sampling M31 analogues from simulations
We used data from the IllustrisTNG suite of large-volume cosmological simulations33, publicly available at www.tng-project.org. All runs contained therein adopt cosmological parameters taken from Planck48: ΩΛ = 0.6911, Ωm = 0.3089 and h = 0.6774. This suite includes three hydrodynamic runs with varying volume and resolution, as well as their dark matter-only counterparts. We elected to use the intermediate-volume TNG100-1 run due to the relatively large sample of M31 satellites that needs to be matched by any simulated analogues. TNG100-1 spans a simulation box of length 110.7 Mpc with dark matter and gas particle resolutions of MDM = 7.5 × 10⁶ M⊙ and Mgas = 1.4 × 10⁶ M⊙, respectively. We also used data from the EAGLE suite34 to augment our sample of simulated systems. Specifically, we selected the fiducial Ref-L0100N1504 run, which—with an associated simulation box length of 100 Mpc, cosmological parameters from Planck49, as well as comparable dark matter and gas particle resolutions of MDM = 9.70 × 10⁶ M⊙ and Mgas = 1.81 × 10⁶ M⊙, respectively—ensures a general degree of consistency with TNG100-1.
M31-like systems in TNG and EAGLE were obtained as follows. We first identified M31’s mass analogues by searching for dark haloes with virial masses within M200 = [0.5, 3.0] × 1012 M⊙, a range that accommodates literature estimates of M31’s halo mass within 0.7 × 10¹²–2.6 × 10¹² M⊙ (refs. 28,50,51) while also including the more numerous, lower-mass haloes for improved statistics. This range encompasses but is broader than the mass criteria previously used in studies of M31’s satellite plane13,14, and was chosen to increase our final sample of M31 analogues. Within our adopted mass range, MIFs within the combined TNG and EAGLE sample do not show a significant correlation with halo mass. Kendall’s tau test, a statistical measure of rank correlation, yields coefficients (and corresponding P values) of 1.1 × 10⁻² (P = 0.43) and 2.4 × 10⁻² (P = 0.52) for cones of maximum asymmetry and companion-locked cones, respectively.
Next, we searched for companions by identifying haloes with a mass above 0.25 M200 within a distance of 5 R200 (approximately 1 Mpc), which can be more massive than the M31 analogues themselves. Fractional thresholds were used instead of absolute values due to the relatively large range covered by our halo mass criterion. If no such companions existed, we considered the system to be ‘isolated’. If exactly one companion was found, we required it to fulfil a so-called reciprocity criterion. We searched for its companions in turn using the same absolute mass and distance conditions as initially calculated for the original M31-like halo. If the companion’s only companion was the original halo, the reciprocity criterion was satisfied and we designated the system as ‘paired’. Otherwise, the original halo was rejected. We also did not consider triplets in this work, and thus rejected M31-like haloes in the case where it had two or more companions to avoid crowded fields. The distribution of host and companion masses in paired simulated systems along their three-dimensional separations is shown in Supplementary Fig. 1.
We assigned satellites to a given halo by identifying all subhaloes within a distance between 20 kpc and 2 R200, a range that fully encompasses the radial distribution of the adopted M31 satellites18. Using the K-band luminosity of the Andromeda dwarfs as an estimator of their stellar mass assuming M*/LK ≈ 1M⊙/L⊙ (ref. 52), 11 of the 37 M31 satellites have stellar masses below TNG100 and EAGLE’s specified Mgas. We did not expect this to significantly affect our results, however, as the phase-space distribution of satellites is generally unaffected by internal stellar feedback. Simulated subhaloes are ranked in descending order by stellar mass; then dark mass once no star particles are available. All M31 analogues were required to host at least 37 satellites. If more were found, the ranked sample was truncated to the most massive 37 satellites to match the observational sample. In addition, we filtered out systems currently experiencing major mergers by requiring that no satellite has a total mass greater than a quarter of the host galaxy’s mass. In this way, we obtained a total of 1,268 and 1,107 systems sampled from the hydrodynamic TNG100-1 and EAGLE Ref-L0100N1504 runs. The TNG sample consisted of 184 paired and 1,084 isolated systems—from EAGLE, we obtained 141 and 966 systems, respectively.
We mock-observed each simulated system with Andromeda-like distance uncertainties to yield 100 Monte Carlo realizations per system. Errors were drawn from a Gaussian distribution from each of the M31 satellites and applied randomly without replacement to each system of simulated satellites, and the same was performed for the host galaxy itself. For isolated systems, mock-observation was performed along line-of-sight vectors drawn from isotropy. For paired systems, two sets of realizations were produced: one adopted isotropic mock-observation vectors, while the other used the line of sight between the given M31 analogue and its sole companion. When using metrics of asymmetry (see the section below) that do not require a companion galaxy, the former set was used. If a companion’s direction is required by a given metric, the latter realizations were adopted instead. As we applied distance uncertainties to the M31 system’s simulated analogues, we consider only the expected positions for the Andromeda satellites for the remainder of this work.
M31’s well-populated asymmetry using cones of maximum asymmetry
MIFs (see main text) enable us to compare the observed Andromeda system and its simulated analogues using the significance of their asymmetrical satellite distributions. When disregarding the asymmetry’s alignment with any companion galaxies, we obtained an incidence of M31-like lopsided systems of 4.5% and 6.2% in TNG and EAGLE, respectively. As is the case when using companion-locked cones, however, a majority of these simulated analogues were most significant with respect to smaller clusters of satellites (Supplementary Fig. 2). Only 0.1% of simulated realizations showed an equal or smaller MIF than the M31 system while also matching the observed asymmetry’s population-wide nature with a satellite count of Nsat ≥ 36. The satellite system of Andromeda remains rare in a full cosmological context regardless of its asymmetry’s orientation.
Incidence of M31-like systems using alternative metrics
Supplementary Table 1 lists the incidence of M31-like lopsided systems in cosmological simulations when adopting alternative metrics of asymmetry. Unlike the cone-based approach, which places systems in a two-dimensional Nθ–θ space, these metrics are one-dimensional and thus do not require any consideration of the look-elsewhere effect. The Andromeda system’s incidence is consistently lower when adopting metrics that take its companion galaxy’s direction into account. The remaining metrics yield a 2–6% incidence depending on the simulation used, a result roughly consistent with the 5% obtained using cones of maximum asymmetry at each simulated analogue’s MIF. The fact that Andromeda’s incidence according to its normalized centroid shift—the only metric that takes satellite distances into account—is similar or higher than the other scale-free metrics may suggest that the observed lopsidedness is not driven by an offset of M31’s position from its satellite distribution.
Robustness with simulation resolution
Andromeda’s analogues in cosmological simulations must have 37 satellite galaxies within 2 R200 to match the observed M31 system. At TNG100 and EAGLE’s baryonic resolution, many of the lower-mass satellites among the 37 per system are dark subhaloes devoid of any stellar particles. Baryonic processes within individual dwarfs are not expected to pose a notable impact on their phase-space distribution at scales of hundreds of kiloparsecs37. Nevertheless, we tested for robustness in the higher-resolution TNG50 run53, which adopts the same cosmology and feedback prescription as TNG100 with a 15-fold increase in particle resolution. Owing to TNG50’s smaller simulation volume, we only obtained a total of 256 isolated and 54 paired M31 analogues. According to their MIFs using cones of maximum asymmetry, 5.7% of simulated realizations are as significantly lopsided as the observed Andromeda system. None of the paired analogues can reproduce the M31 satellites’ asymmetry towards the Milky Way, thus setting an upper limit of 2% (
Exclusion of outlying satellites
Of the published sample of stellar systems in ref. 18, only 2 satellite galaxies—Peg DIG and IC 1613—lie beyond 1.5 R200 of Andromeda. It has been reported that the lopsidedness of satellite galaxy systems is driven by more distant satellites in both observations25 and simulations27,32. Hence, we excluded these two outlying galaxies and performed the same analysis as described in the main text using an alternative sample of 35 satellites and a reduced search volume of 1.5 R200 around simulated hosts. As Peg DIG and IC 1613 are both located within the excess of satellites towards the Milky Way, their removal does not change the cone opening angles at which the Andromeda system is most significant, which remains at 101° and 106. 5° for cones of maximum asymmetry and companion-locked cones, respectively. The incidence of M31-like lopsided systems in simulations with respect to the Milky Way’s direction decreases slightly to 0.2%, while the rarity of the observed system without a preferred direction remains unchanged at 5%. The outlying Peg DIG and IC 1613 satellites are not key drivers of the observed asymmetry, and their exclusion does not significantly affect the lopsided Andromeda system’s tension with cosmological expectations.
Robustness with paired host selection criteria
Our selection criteria for M31 analogues in simulations was chosen to ensure a sufficiently large sample to obtain robust statistics, but the adopted range of parameters may deviate from strictly Local Group-like systems due to the enhanced abundance of lower-mass haloes in the CDM mass function. We tested whether the main outcomes of this work are sensitive to our choice of selection criteria by subdividing our fiducial sample of paired TNG100 and EAGLE hosts into 2 bins about the median host mass (M200 = 1.33 × 10¹² M⊙), relative companion mass (Mcomp = 0.46 M200) or separation (Dcomp = 4.08 R200).
The results of this comparison are shown in Supplementary Table 2. We focused on the incidence of paired simulated systems that match the M31 system’s companion-locked MIF, fMIF, as the main result of this work. The two bins of varying host mass show fMIF consistent within ΔfMIF = 0.09%. A smaller pair separation and higher companion mass do slightly enhance the incidence of M31-like asymmetric systems, but neither can achieve fMIF > 0.5%. This increase in incidence is not recovered to the same extent for cones of maximum asymmetry, suggesting that this effect impacts only the direction of asymmetry (but not its magnitude). We also tested whether adopting stricter analogues of the M31 system (M200 = [1, 2] × 1012 M⊙ and Mcomp = [0.5, 1.5] M200) alleviates its tension with cosmological expectations. This selection in fact reduces fMIF for both companion-locked cones and cones of maximum asymmetry from our fiducial results, but the low sample size of 54 simulated systems across TNG100 and EAGLE renders the results of this comparison unreliable. Finally, we checked whether simulated M31 analogues with more companions more massive than the respective analogue (Nsys = 63) show an enhanced degree of asymmetry. We recover respective incidences of 0.30% and 5.29% for companion-locked cones and cones of maximum asymmetry, a result consistent with sample (i) in Supplementary Table 2. In summary, we found no evidence that adjustments in our selection criteria for simulated M31 analogues would significantly alleviate the reported discrepancy with the observed M31 system.
Impact of survey completeness
The current census of Andromeda satellites is not complete, and the prominent excess of galaxies on the near side of M31 naturally points to incompleteness as a possible factor. Reference 21 calculated detection limits within the PAndAS footprint, reporting that dwarfs brighter than MV = −7.5 should be observable throughout the M31 halo. Of the 37 M31 satellites in ref. 18, 30 lie above this luminosity threshold. Five of the 7 fainter satellites are located on the near side of M31 (and XXVI lies only a few degrees further), and their removal from our working sample is expected to increase the incidence of similarly lopsided systems.
To fully compensate for any possible incompleteness, the ideal approach would be to prepare a sample of simulated Andromeda analogues also with 30 satellites brighter than MV = −7.5. However, TNG100 produces only luminous dwarfs until MV = −9 due to its limited baryonic resolution, and only 15 such paired systems are available in the higher-resolution TNG50 run. While none of these 15 systems match the Andromeda system’s MIF using companion-locked cones, the resulting maximum incidence of fMIF fMIF. To obtain meaningful results, we instead assumed that the phase-space distribution of satellites around their host is independent of their exact luminosity function—a simplifying assumption also adopted in most studies quantifying the significance of observed satellite planes in simulations6,13,16,54—and truncated each simulated analogue to its 30 most massive satellites in a manner similar to our fiducial method. In support of this, we point out that fMIF does not differ significantly when binning over the fiducial sample’s range of host (and thus satellite) mass regimes (Supplementary Table 2), and the luminosity function of our selected analogues does not to be an exact match to the M31 system to set a baseline for satellite angular phase-space distributions expected in a ΛCDM context.
Of 411 paired Andromeda analogues and their realizations, 0.5% match the M31 system’s MIF for companion-locked cones—less than a 2-fold increase in incidence from the full satellite sample. This result may be interpreted as the upper bound for the Andromeda system’s incidence, such that 0.3–0.5% of simulated analogues show an equal or more significant asymmetry. When considering cones of maximum asymmetry instead, we recovered a higher fMIF of 8.6%, which represents an increase from the full sample at a similar proportion. However, 74% of these asymmetric analogue realizations reach their MIF at θ
Compensating for the impact of survey completeness does increase the incidence of sufficiently asymmetric analogues, but incompleteness is not the primary driver of the observed asymmetrical distribution nor the tension it holds with cosmological expectations. Indeed, we point out that the 7 satellites that lie below the completeness threshold show a mean angular separation from the Milky Way–M31 line of sight of 70 ± 8°, a result fully consistent with that of the ‘complete’ 30-satellite sample at 69 ± 9°. The fainter 7 satellites thus show a degree of asymmetry near-identical to the brighter 30, and we found no evidence that incompleteness artificially enhances the observed lopsidedness. Furthermore, a detailed analysis of the satellite system using forward modelling55 rules out the asymmetry (within the PAndAS footprint) as a straightforward consequence of incompleteness alone at >99.9% confidence. We also point out that the analysis in ref. 21 requires only ~80% of the M31 satellites to be located on the hemisphere facing the Milky Way. Explaining the more significant statistic of 36 out of 37 satellites within 106.5° of the Milky Way’s direction using incompleteness alone would be even less feasible.