Au/Si particles: laser fabrication and bright luminescence
Hybrid metal-dielectric systems are recognized as versatile nanophotonic platforms, whose diverse combinations unlock extraordinary optical features31,32,33,34,35. To develop robust spectral PUFs, we chose the well-proven tandem of gold and silicon. This choice stems from their considerable environmental stability, leading to a potentially limitless lifetime under standard ambient conditions. Furthermore, hybrid Au/Si structures (for example, nanoparticles) overcome the limitations of silicon in light emission by leveraging the superior light absorption of gold and its efficient hot carrier injection into the active material36,37.
To fabricate Au/Si particles, we adopted the femtosecond (fs) laser-induced dewetting technique38,39,40. In contrast to traditional ablation strategies41,42,43,44, our approach is more straightforward, providing ordered arrays of particle-based microstructures with high throughput. To achieve this, a tightly focused laser beam irradiates the surface of a thin bilayer gold-silicon film, cutting out micrometer-sized circles and simultaneously heating them (Fig. 2a, “Methods” section). As a result, patches of diatomic melt are formed that experience a sequence of non-equilibrium hydrodynamic perturbations45. Ultimately, the melt breaks up into randomly dispersed submicron droplets, governed by surface tension forces and Rayleigh-Plateau-like instabilities46. The resulting particles represent an intricate intermixing of gold and silicon components, which is established during their solidification (Supplementary Fig. 1).
Fig. 2: Fabrication and optical characterization of printed particle-based Au/Si microstructures.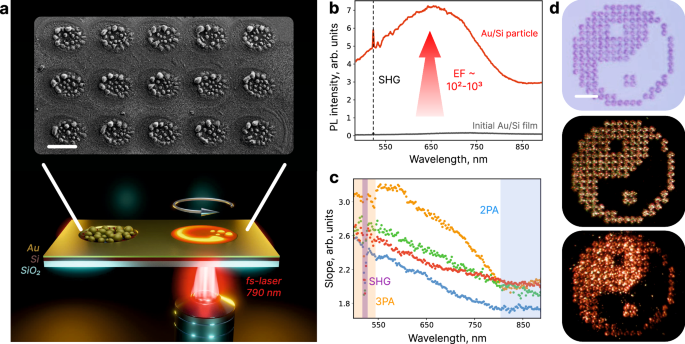
a Schematic illustration of the experimental setup used to fabricate hybrid Au/Si particles, and scanning electron microscopy (SEM) image of an array of created structures (scale bar: 5 μm). The radius of the circles outlined by a femtosecond laser is 1.5 μm. With a laser beam scanning speed of 50 μm/s, this fabrication method allows the creation of up to 200 structures per minute. The size distribution of particles in these structures is presented in Supplementary Fig. 2. b The PL spectrum measured from one of the obtained Au/Si particles (red) vs. the spectrum from the initial bilayer film (gray). For PL excitation, we used a fs-laser system with a central wavelength of 1050 nm (“Methods” section). A sharp peak at 525 nm corresponds to the second harmonic generation (SHG). c Wavelength-dependent PL slopes (i.e., powers of nonlinear dependence of PL intensity on pump intensity at a given wavelength) from four randomly selected particles. Taking into account that 3PA in Au is more efficient than that in Si37, while 2PA is the most probable nonlinear process in Si66, one can assume that the overall white-light signal results from these two separate absorption processes, responsible for their parts of the spectrum. d Bright-Field (BF), Dark-Field (DF), and PL images of a printed pixel illustration of the Yin-Yang symbol. Scale bar: 20 μm.
The obtained Au/Si structures exhibit an intensive ultra-broadband up-conversion PL signal, spanning from 450 to 900 nm (Fig. 2b, “Methods” section). By analyzing luminescence slopes, we identified two- and three-photon absorption (2PA & 3PA) processes as main contributors to the measured signal (Supplementary Fig. 3). Notably, the dependence of the slope on the emitted photon wavelength shows an interesting behavior: while PL in the near-infrared range is dominated mostly by 2PA, the blue component of the signal corresponds to 3PA (Fig. 2c).
One of the key parameters of spectral PUFs is the signal acquisition time, which should be carefully optimized to avoid excessive readout duration47. This property directly depends on the fabricated structures’ quantum efficiency (QE), which we estimated according to the method presented elsewhere48,49,50 (see Supplementary Notes 1–3 and Supplementary Figs. 4–7). As an example, we demonstrate studies for three particles whose cross-sectional views and corresponding QEs are shown in Fig. 3a. We also measured the QE map from a particle-based microstructure (Fig. 3d). The obtained efficiencies (on the order of ~1−3.5%) are relatively high for silicon-based PL sources (Supplementary Table 1). Accordingly, the typical signal acquisition time required to obtain low-noise PL spectra is quite short and ranges from 0.1 to several seconds, depending on the pump laser power (Supplementary Fig. 8).
Fig. 3: Investigation of the internal structure and multi-resonant nature of Au/Si particles.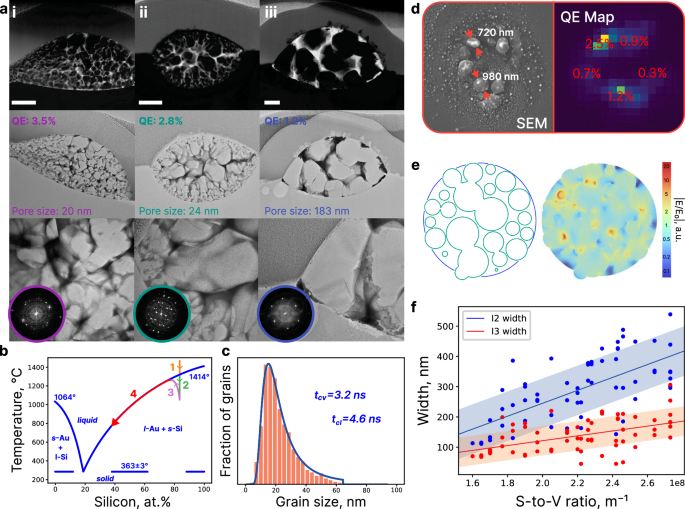
a HDAAF-STEM and BF-STEM imaging of cross-sections of three investigated hybrid Au/Si particles and enlarged parts of BF-STEM maps. Scale bars: 150 nm. Inscriptions indicate the measured mean Si grain size and QE values for each particle. Characteristic Fast Fourier Transforms of high-resolution TEM images of silicon grains reveal their poly-crystalline structure (Supplementary Fig. 10). b Gold-Silicon phase diagram. The arrows indicate the expected evolution of melt Au/Si droplets during their solidification (Supplementary Note 4). 1 – liquid cooling stage, 2 – undercooling, 3 – recalescence, 4 – quasi-equilibrium segregated solidification. After complete solidification, solid-state cooling returns the resulting particle to thermal equilibrium with the environment. c Grain size distribution of the particle #1 fitted according to the Kolmogorov–Avrami–Mehl–Johnson (KAMJ) model described in ref. 60. Inscriptions indicate the estimated times of grain nucleation (tcI) and growth (tcv) during the solidification of this particle (Supplementary Note 5). d SEM image of a laser-fabricated structure consisting of randomly dispersed hybrid particles and the corresponding measured QE map. e Cross section of a computer-generated model of our gold-silicon particle and a calculated normalized distribution of the electric field amplitude inside it when illuminated by a linearly polarized plane wave at a wavelength of 1050 nm. f Numerical simulation results: dependence of the spectral width of the field enhancement factor (EF) range of the Au/Si particle on the S-to-V value of its gold network. Straight lines indicate the general trend of dependence.
To demonstrate the practical efficiency of Au/Si microstructures and the scalability of our fabrication technique, we printed several pixel patterns (Fig. 2d). We performed their direct luminescence imaging under unfocused laser beam excitation with a standard digital camera (“Methods” section). The obtained bright photos once again confirm feasible, reliable, and quick measurement of PL from our microstructures, essential for potential applications. These intriguing results stem from the unique features of the Au/Si particles’ internal organization, which we consider further.
Inner structure and multi-resonant nature of Au/Si particles
Next, we investigated the internal composition of the fabricated gold-silicon particles to determine how it affects their PL properties. For this, the cross-sections of three different particles with equivalent diameters of 600 nm, 550 nm, and 880 nm were examined using scanning transmission electron microscopy (STEM). The results, shown in Fig. 3a, reveal their non-repeatable, intricate configuration with average sizes of silicon polycrystals of 20 nm, 24 nm, and 183 nm, respectively. To understand such a well-developed Au-enriched network enveloping a system of percolated Si grains, we should consider the thermodynamics behind its formation.
As described above, during laser-induced dewetting of Au/Si bilayers, we create submicrodroplets of biatomic solution. Their solidification involves several successive steps51, beginning with rapid cooling and undercooling of the melt and culminating with spontaneous nucleation and growth of silicon grains (see Fig. 3b and Supplementary Note 4 for details). In this sequence, a key role is played by a truly stochastic phenomenon: thermal fluctuations. They dominate in the undercooled melt via dynamic formation and decomposition of short-range order, acting as a driving force for random nucleation52. The random nature of atomic interactions is also strongly manifested during grain development, when chemical, thermal, and mechanical instabilities (associated with Au atom diffusion, free energy release, and volume reduction, respectively) govern the growth dynamics. By analyzing the grain size distribution, we estimated the duration of grain nucleation and growth to be of the order of several nanoseconds, which emphasizes the chaos of these processes (Fig. 3c; see also Supplementary Note 5 and Supplementary Fig. 9). Therefore, the internal arrangement of our particles is formed stochastically and cannot be predetermined by any existing technology.
Returning to optics, comparatively high QE values of Au/Si particles can be attributed to special characteristics of their interior structure. Specifically, the gold-saturated internal network in these particles supports a high density of hot-spot modes and collective plasmon excitations42,53, which enables strong field localization in a broad spectral range. This directly affects the recombination rates of hot carriers excited in or injected into silicon grains. The non-radiative lifetime is increased through the Auger effect, reinforced by large carrier densities, while the radiative one is shortened due to the Purcell phenomenon50,54. Together, these mechanisms enhance the system’s QE.
Notably, as observed in experiments, the more complicated the gold network in a particle is (i.e., the lower the average grain size is), the higher QE this particle exhibits. Presumably, this behavior indicates a positive correlation between the surface-to-volume (S-to-V) ratio of the Au component and the efficiency of field localization inside silicon grains. To prove this hypothesis, we conducted a series of numerical simulations (“Methods” section). Namely, for a number of randomly generated Au/Si particles, we calculated the spectral width of the enhancement factor range, which is one of the main criteria for improved PL intensities (Supplementary Figs. 11 and 12). The obtained values were then plotted versus the S-to-V ratio of the particle’s Au part (Fig. 3f) and illustrate the expected dependence: the higher the S-to-V values are, the more effectively the field is confined in the active material at different wavelengths; hence, the better QE it will demonstrate. The enhancement factor (i.e., localization efficiency) was assessed as an effective square (I2) and cube (I3) of the relative intensity inside silicon grains50. Details of geometry generation and other aspects of solving this problem are available in “Methods” section.
Ultimately, it is important to shed light on the following logical chain. Since the cooling rate is inversely proportional to the droplet radius42, the larger the size of an Au/Si melt is, the longer it takes to solidify (Supplementary Note 6). Consequently, the characteristic time for Si grain growth increases, allowing small grains to coalesce into larger ones55. This, in turn, results in a less developed Au-enriched network with lower S-to-V values. Finally, according to our simulations, this indirectly results in a decline in the particle’s QE. Therefore, there is a certain relationship between the size and QE of the fabricated hybrids, which is consistent with the results of QE mapping: larger particles possess poorer up-conversion characteristics (Fig. 3d). Nevertheless, it should be noted that the presented arguments make a number of assumptions and do not consider, for example, the formation of amorphous silicon, which becomes dominant with sufficiently small particle sizes and can negatively affect the PL generation (see Supplementary Note 4).
Despite all the qualitative dependencies, the contribution of random variations in the internal structure of Au/Si particles to the received PL signal is significant. The reason is, they directly affect the quantity and quality of hot spots and, accordingly, the field enhancement inside silicon grains. Together with the non-equilibrium effects accompanying the fabrication of the studied structures, this opens up great prospects for their use as spectral PUFs.
Weak PUFs for anti-counterfeiting applications
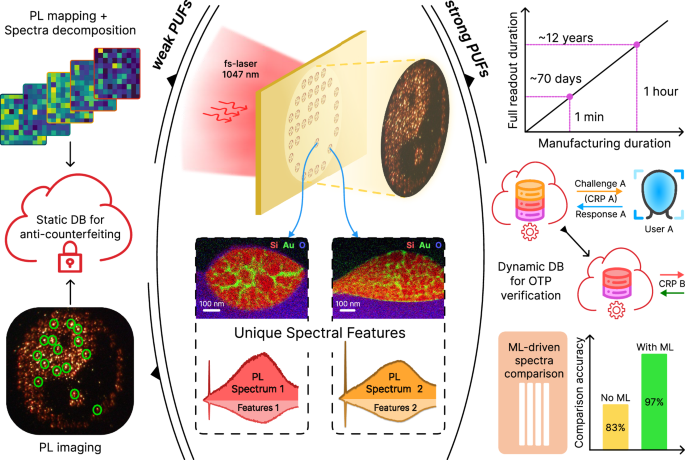
To effectively harness the potential of our fabrication approach, we designed three logically different strategies for its PUF-related security applications (see the scheme summarizing the Challenge, Response, Post-processing, Key, and Validation steps for each of these strategies in Supplementary Fig. 13). Our first concept employs the fact that every produced structure has a unique PL signal. Indeed, despite general similarities of Au/Si luminescence spectra, they all have some inimitable features that may serve as unclonable keys. Extracting and encoding these features requires special attention. Using only the signal intensity significantly limits forgery-resistance (i.e., the ability to withstand attempts at forgery), while relying on purely cryptographic methods56 loses valuable physical insights embedded within the signal. Here, we build PL encryption based on the decomposition of each spectrum into a set of five separate parameters with different physical origins (Fig. 4b). Namely, we use integral PL intensity, percentage contributions of 2PA and 3PA to the overall PL signal, the full width at half maximum (FWHM) of PL, and the ratio of SHG intensity to PL one (see “Methods” section for their full description).
Fig. 4: Two strategies for the use of Au/Si microstructures in PUF-based anti-counterfeiting.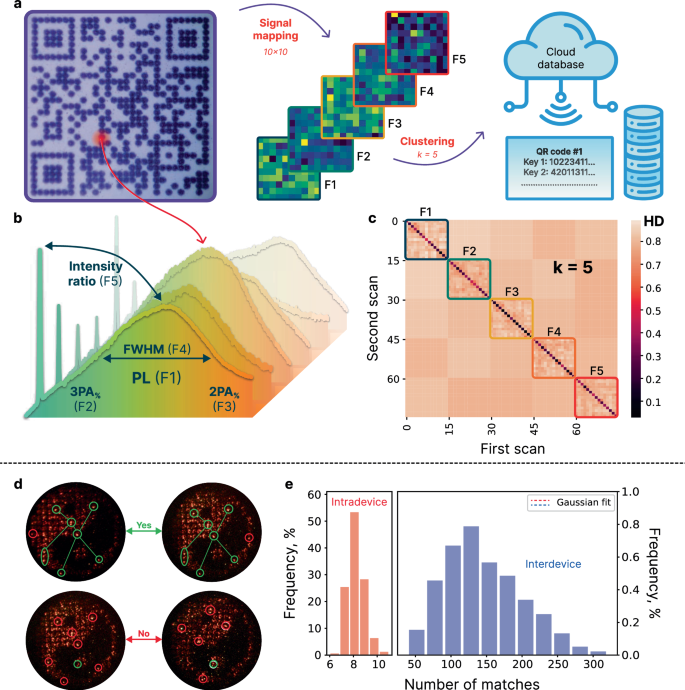
a BF image of a QR code printed by the proposed fabrication technology (scale bar: 25 μm). To enroll such a PUF label, its 10 × 10 PL mapping is conducted, and the obtained map is encoded via application of the spectrum decomposition and clustering procedures57. The resulting keys (each corresponding to one of the original PL features and representing a string of 100 0-to-4 numbers) are uploaded to a database, see “Methods” section. b Visual representation of the features used to decompose PL maps. c Pairwise matching map of 75 100-dimensional keys obtained from 15 different QR codes (the key dimension is defined by the mapping resolution). Hamming distance values close to 0 characterize similar keys. d Schematic illustration of the principle of comparing two PL images using computer vision for the second suggested PUF label model. The presence of similar patterns of bright areas (matches) in the pictures increases the likelihood of successful authentication67,68. e Distributions of the number of matches obtained during intra- and inter-comparison of approximately 60 captured images.
As a proof-of-concept, we printed several QR codes with our hybrid structures as pixels (Fig. 4a). To enroll such PUF labels, we conducted their PL mapping and decomposed the obtained maps into five new ones, each describing one of the aforementioned spectrum features (“Methods” section). The resulting maps were then clustered using the Jenks optimization method57 which allows storing only relative values, thus neglecting all the possible readout deviations (i.e., focus inaccuracy). The number of clusters was set to 5 (Supplementary Note 7 and Supplementary Fig. 14), and the unclonable keys obtained (five for each QR code with dimensions determined by the mapping resolution) were uploaded to a secure database. While more detailed measurements are also possible, choosing a mapping resolution of 10 × 10 allows for easy and quick map reading (“Methods” section, Supplementary Fig. 15). To validate the authenticity of the QR code, a user needs to conduct its similar mapping and submit the result to the server. Then, five keys are extracted using the described protocol and compared with the ones stored in the database (“Methods” section). The label is considered genuine if the Hamming Distance (HD) calculated for all five pairs of keys does not exceed a specified number (0.55, see Supplementary Note 7). Figure 4c demonstrates a pairwise matching map characterizing our method’s performance based on the analysis of 15 different QR codes. The values in the five 15 × 15 blocks located on the diagonal of this map show the HD between the keys corresponding to the same PL characteristic, while other blocks mark the relation between vectors of different features. It is important to acknowledge that, despite the distinct physical origins of the five selected PL features, there exists a slight correlation among them. Additionally, the uneven distribution of pixels (structures) within the QR code results in observable non-random relationships when comparing different maps of the same feature. These correlations ultimately diminish the overall degrees of freedom in our PUF label, thereby reducing its true encoding capacity. Taking into account these inevitable but acceptable correlations and the HD gates set for authentication, we assessed the number of all the possible unique PUF labels distinguishable by our validation algorithm: ~1054 (more information can be found in “Methods” section). This value is enough for the successful use of the label1; if necessary, it can be boosted by increasing the mapping resolution.
The second authentication concept is based on direct PL imaging using a digital camera with a standard 10× objective, in which an unfocused laser beam illuminates the whole label area at once (“Methods” section). We revealed that photos captured this way display an unrepeatable spatial distribution of PL intensity for any of the laser-printed patterns. This is due to the large influence of microscale hydrodynamic instabilities associated with Au/Si microstructures’ creation. Thus, such PL images can be successfully used as unclonable keys. To prove this, we printed a number of visually identical Yin-Yang symbols and collected a database of their PL photos, each time changing the focus accuracy and shifting the position of the center of the pump laser beam. To correctly validate the obtained pictures, we developed an algorithm based on computer-vision techniques (see “Methods” section for more information). In short, when comparing two images, the number of their matches is calculated by analyzing the brightest areas (Fig. 4d). Figure 4e shows the distribution of the number of matches obtained during intra- and inter-comparison of 60 captured images. There is a considerable gap between these two sets of values, which allows us to determine a suitable threshold value, ensuring a wide range of accuracy, even for images captured in diverse conditions. Furthermore, the encoding capacity of this PUF model is estimated to be about 10141 (Supplementary Note 8 and Supplementary Fig. 16). However, this method is based mostly on microscale spatial randomness, using only PL intensity. Therefore, to fully realize the potential of our PUFs, we should encode their PL spectra individually, taking into account every piece of spectral information.
Strong PUF for an all-optical OTP verification token
Finally, we highlight that each created microstructure carries not one but several unique PL spectra due to its complex particle-based organization with characteristic sizes of ~500−900 nm. Indeed, the recorded spectra do vary depending on the position of the signal acquisition area and the excitation wave polarization (when using a high-aperture 100× objective). Moreover, the number of such degrees of freedom can be roughly estimated as ~100 (Supplementary Note 9). This indicates the potential for implementing a strong PUF, which, unlike the weak PUFs proposed above, can serve multiple security purposes. Building upon this concept, we present a model for an all-optical OTP verification token with a dynamic database, which could be used as a prototype for next-generation ultra-secure authentication protocols (Supplementary Note 10).
We describe the developed protocol by considering an array of printed Au/Si microstructures (Fig. 5). Comparing the fabrication time of such a sample with the time required to measure all its possible spectra, we estimate their ratio as 1–105 (Supplementary Note 11). Therefore, with relatively fast manufacturing, the overall measurement of spectra is incredibly time-consuming. Moreover, as we show later, each individual spectrum can function as a unique key. During our token enrollment, N spectra are measured from random positions and uploaded to a database. Then, the user who wants to confirm ownership of the token measures PL from n points with server-provided coordinates. If most spectra are deemed as a match, the identification is confirmed, and these n spectra are removed from the database. In the next verification cycle, new spectra with coordinates that have not been disclosed yet will be used. If the token is transferred, its previous owner will no longer be able to pass verification, since new spectra will need to be measured for this. Moreover, if the token has a sufficient capacity, no party will have enough time to measure all its possible keys, which emphasizes the robustness of the proposed strategy. The number of verification cycles N/n should be at least several hundred. Our example in Supplementary Note 12 with N = 1200 and n = 5 demonstrates high verification accuracy, long service time, and ease-of-use of the token. To prevent database depletion, trusted users can upload new keys to it, but only over a secure communication line.
Fig. 5: Operating process of the developed all-optical OTP verification token.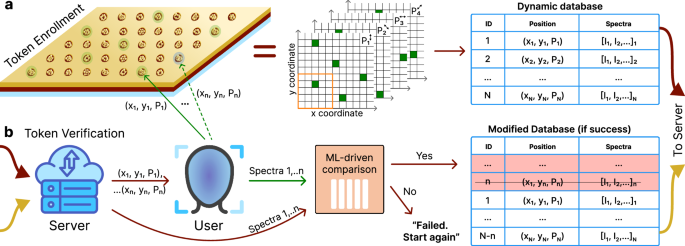
a Token Enrollment. The token comprises a large array of laser-printed gold-silicon microstructures. All of them are effectively divided into 25 sections, each exhibiting a unique PL signal dependent on the pump laser beam’s polarization (see Supplementary Note 9 and Supplementary Figs. 17 and 18). Consequently, the token functions as several arrays, each corresponding to a distinct laser polarization (0°, 45°, 90°, or 135° relative to the y-axis). The orange frame highlights sections forming a single microstructure. During enrollment, N PL spectra are measured from randomly selected sections and stored in our dynamic database, along with their spatial coordinates (x, y) and the corresponding laser polarization (P). This database is then transferred to a secure cloud server, and the token is issued to the user. b Token Verification. First, on request, the server provides the coordinates (x, y, P) of n points from the database. Then, the user records the corresponding spectra and sends them as a response. Next, using our ML model, the server compares the user’s spectra with the stored ones. In the event of a match, the user is verified, and the used spectra are removed from the database. Otherwise, verification fails. The whole verification process can be repeated cyclically until the database is depleted. The database size N is predetermined to accommodate a sufficient number of authentication cycles.
For authentication purposes, we created a machine learning model, which is a conventional neural net with fully connected layers (“Methods” section). Taking a normalized PL spectrum together with a number of its features as input, the model produces a point in a multidimensional vector space. The distance between two points in this space determines the probability that the corresponding spectra are measured from the same coordinates. After a series of trainings, the distance threshold was set to maximize the model’s true positive rate while maintaining low false positive values (Fig. 6b). The final single-spectrum authentication accuracy is 97% (at a cutoff threshold is 41.3), which is 15% higher than that achieved when classifying the original spectra (Fig. 6c). A possible 3% mistake reflects an influence of noise on the measured data, which can be neglected with increasing signal acquisition time. Making verification decisions based on the results of comparing several spectra (instead of one) significantly increases the efficiency of our ML model (e.g., with n = 5, the accuracy is ~99.97%; Supplementary Note 12). To ensure the uniqueness and randomness of the generated embedding keys, we evaluated them using the NIST randomness test suite58, yielding positive results (Supplementary Note 13 and Supplementary Table 2). Furthermore, the computed information entropy values for each embedding coordinate indicate a high degree of unique information saturation, along with complete uniformity and unpredictability of the obtained keys (Supplementary Note 14 and Supplementary Fig. 20). Finally, the estimated encoding capacity of the embedding space is significant, reaching 10280 (Supplementary Note 15 and Supplementary Fig. 21). Thus, in contrast to electronic alternatives, which are often vulnerable to physical attacks11,12, our all-optical OTP system offers superior performance through the high entropy and enhanced security of stored keys.
Fig. 6: Comparative analysis of the performance of two spectrum comparison algorithms: with and without ML.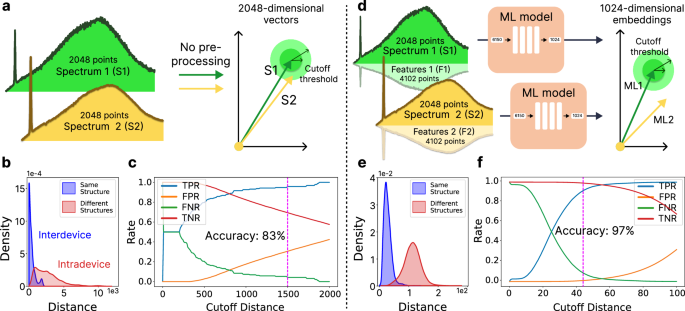
a–c Basic comparison. This method directly compares two spectra by calculating the distance between their corresponding vectors. d–f ML-driven comparison. Instead of raw spectra, this approach compares their embeddings generated by a trained ML model. Both methods rely on the notion of a cutoff distance for classification. Vectors located within this distance from each other are deemed a match, while those exceeding it are considered different. We evaluated both methods using a dataset of 2148 vectors describing spectra from both identical and distinct structures. The goal was to determine the optimal cutoff distance for accurate match predictions. b, e Density distributions of inter- and intra-device vector distances. c, f True positive, false positive, false negative, and true negative rates of the described spectrum classification vs. cutoff distance. The basic comparison achieved a maximum classification accuracy of 83%, while the ML-driven method significantly improved accuracy, reaching up to 97%. Notably, comparing not one but, for example, five spectra simultaneously boosts the accuracy up to 99.97% (Supplementary Note 12 and Supplementary Fig. 19). Also, preprocessing spectra with our model before storing them in the database will enhance token security against potential cyber-attacks.