MT-HGs are associated with efficacy in NIVO-treated patients
In this study, we tested whether MT-HGs, as inherited genetic factors, are associated with ICI clinical efficacy in MM, and whether MT-HGs can be proposed as host predictive biomarkers of ICI treatment outcome. We first assessed association of MT-HG status with ICI clinical benefit (CB) or no clinical benefit (NCB) in 115 patients with MM enrolled in the CM-067 clinical trial who received NIVO. In this discovery cohort (CM-067-D), 48 NIVO-treated patients (42%) showed CB, experiencing either a complete or partial response or durable stable disease (dSD; Supplementary Table 1). The distribution of MT-HGs in the CM-067-D NIVO-treated cohort is as expected in the European population (Extended Data Fig. 1 and Supplementary Table 2). Similarly to the European population frequency (~50%), the most common MT-HG in the CM-067-D NIVO cohort was HG-H (46%), and 42% of patients with HG-H showed CB (Fig. 1a,b).
Fig. 1: NIVO treatment efficacy by European haplogroup.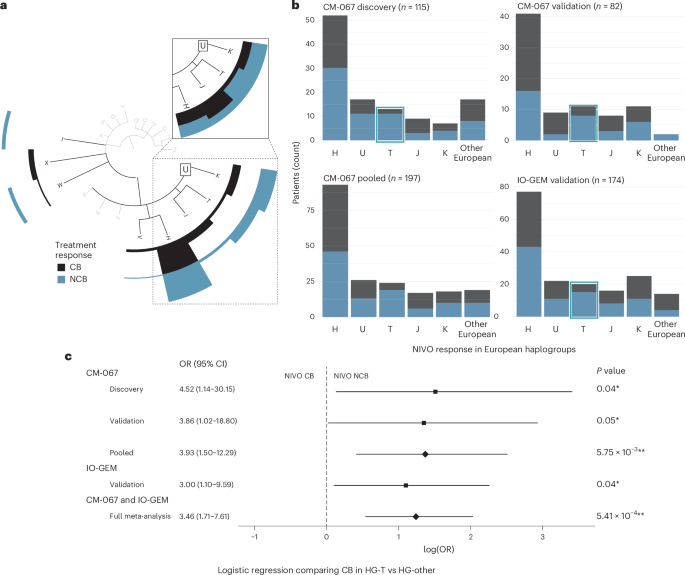
Dark bars represent participants with NIVO CB (CR, PR or dSD). Light bars represent participants with NIVO NCB (pSD or PoD). a, Phylogenetic tree depicting MT-HG lineages and CM-067 NIVO discovery cohort treatment efficacy (n = 115 patients) with CB/NCB frequencies (counts) for the major European haplogroups (H, U/K, T, J, V, I, X, W). Inset shows CB/NCB proportions within each major European haplogroup (H, J, T, U/K). b, CM-067 and IO-GEM NIVO treatment efficacy frequencies by European haplogroup (H, U, T, J, K and Other, including W, R, V, X, I). Left to right (from top left), CM-067 NIVO discovery cohort (n = 115), CM-067 NIVO validation cohort (n = 82), CM-067 pooled (n = 197) and IO-GEM validation cohort (n = 174). c, Forest plot from logistic regression analysis showing the ORs, log odds, CIs and two-tailed P values when comparing NIVO treatment outcomes for HG-T versus other MT-HGs. Black boxes represent the point estimate for the main effect size (log odds) in discovery and validation cohorts and the lines extending from them represent the 95% CIs. Diamonds represent the log odds point estimate for pooled analyses estimating the overall magnitude of effect. Point estimates to the left of the dashed line indicate increased odds of NIVO CB, while point estimates to the right indicate increased odds of no NIVO CB. CIs that do not cross the dashed line indicate a statistically significant point estimate (P
We saw significant differences in NIVO efficacy for patients with the HG-T in the CM-067-D NIVO cohort (~10% of both the European and CM-067-D NIVO cohort; Fig. 1a,b). Fifteen percent of patients belonging to HG-T showed NIVO CB, compared to 45% of patients with ‘other’ haplogroups (P value = 0.04), with significantly higher odds of NCB (odds ratio (OR) for NCB, T versus other MT-HGs = 4.52 (95% confidence interval (CI): 1.14–30.2); Fig. 1c). To validate these associations, we analyzed an additional n = 82 NIVO-treated patients from the CM-067 trial (CM-067-V; Supplementary Table 1). We again found a strong association between NIVO NCB and HG-T (P value = 0.048), with a 73% NCB rate in patients belonging to HG-T (OR for NCB, T versus other MT-HGs = 3.86 (95% CI: 1.02–18.8); Fig. 1b,c).
To provide a robust estimate of the overall effect magnitude of the observed association in the setting of a highly controlled clinical trial, we combined all CM-067 NIVO-treated patients (n = 197) into a pooled analysis. Overall, 80% of NIVO-treated patients belonging to HG-T from CM-067 experienced NCB, compared to 51% CB in other MT-HGs (OR for NCB, T versus other MT-HGs = 3.93 (95% CI: 1.50–12.3), P value = 5.75 × 10⁻³; Fig. 1b,c and Extended Data Fig. 2a). Adjusting the logistic regression model for age and disease stage further refined the association of HG-T with NCB (adjusted OR for NCB, T versus other MT-HGs = 4.05 (95% CI: 1.53–12.8)).
To validate these findings in the SOC setting, we used samples obtained from the IO-GEM, a collaborative international consortium of immunotherapy-treated patients with melanoma (n = 113 NIVO samples). We also included data derived from previously published datasets (n = 61)19,20. Clinical characteristics and MT-HG distribution of the IO-GEM NIVO cohort (n = 174) are consistent with those seen in the CM-067 analytical cohort (Supplementary Tables 1 and 2). Overall efficacy in the IO-GEM NIVO cohort is similar to the CM-067 analysis, with 47% of participants experiencing CB (Fig. 1b).
The IO-GEM analyses confirmed the observed associations from CM-067, showing that HG-T is significantly associated with NIVO resistance (75% NCB rate, P value = 0.04; OR for NCB, T versus other MT-HGs = 3.00 (95% CI: 1.10–9.59)). This association is comparable with the effect size and the significance observed in the discovery analysis in CM-067 (Fig. 1b,c and Extended Data Fig. 2b). Adjusting for age and sex, the association remains comparably significant (OR = 2.78, 95% CI: 1.00–9.15).
The meta-analysis, performed solely to evaluate the overall magnitude of the effect by combining all NIVO-treated patients (CM-067 and IO-GEM, n = 371), demonstrated a strong overall association with NIVO resistance (OR for NCB, T versus other MT-HGs = 3.46 (95% CI: 1.71–7.61), P value = 5.41 × 10⁻⁴; Fig. 1c), and the association remained after adjusting for age and sex (adjusted OR for NCB, T versus other MT-HGs = 3.43 (95% CI: 1.69–7.57)). A sensitivity analysis assessing the objective response by comparing only complete response (CR) or partial response (PR) to patients with progression of disease (PoD), removing those with stable disease (SD), showed the same association trend with comparable statistical significance (OR for PoD, T versus other MT-HGs = 2.86, 95% CI: 1.39–6.38; P value = 4.86 × 10⁻³).
MT-HGs predict clinical efficacy in other ICI regimens
To evaluate whether MT-HGs associate with outcomes of other frontline ICI therapies in MM, we tested MT-HG associations with the clinical efficacy of IPI-NIVO combination (anti-CTLA-4/anti-PD-1; COMBO), which is currently an approved SOC first-line ICI regimen for patients with MM. In CM-067 (n = 181), COMBO-treated patients belonging to HG-T showed significantly worse efficacy compared to all other MT-HGs (P value = 3.55 × 10⁻³), with an 80% NCB rate (OR for NCB, T versus other MT-HGs = 5.76 (95% CI: 1.75–26.0); Extended Data Fig. 2c), and this association remained comparably significant when adjusting for age and sex (OR = 5.73, 95% CI: 1.71–26.1). The same trend was shown in the IO-GEM COMBO cohort (n = 196), with patients belonging to HG-T showing the poorest outcomes after COMBO (54% NCB versus 33% NCB in other MT-HGs; Supplementary Table 1; OR for NCB, T versus other MT-HGs = 2.39 (95% CI: 0.76–7.73), P value = 0.12; Extended Data Fig. 2d), with comparable effect size when adjusting for age and sex (OR = 2.65, 95% CI: 0.79–9.19). To estimate the overall magnitude of the effect in the COMBO-treated patient population, we combined both CM-067 and IO-GEM COMBO-treated patients (n = 377), and found a strong association, with a 68% NCB rate in patients belonging to HG-T compared to a 34% NCB rate in the other MT-HGs (OR for NCB, T versus other MT-HGs = 3.64 (95% CI: 1.64–8.68), P value = 1.14 × 10⁻³; Fig. 2a). Adjusting the COMBO meta-analysis for age and sex demonstrated the same trend (adjusted OR = 3.64 (95% CI: 1.61–8.85)), as did a sensitivity analysis assessing objective response (OR for PoD, T versus other MT-HGs = 3.14, 95% CI: 1.33–7.80; P value = 7.28 × 10⁻³).
Fig. 2: ICI treatment efficacy in IPI, NIVO or IPI-NIVO cohorts comparing HG-T and other (H, U, J, K, W, R, V, X and I) MT-HGs.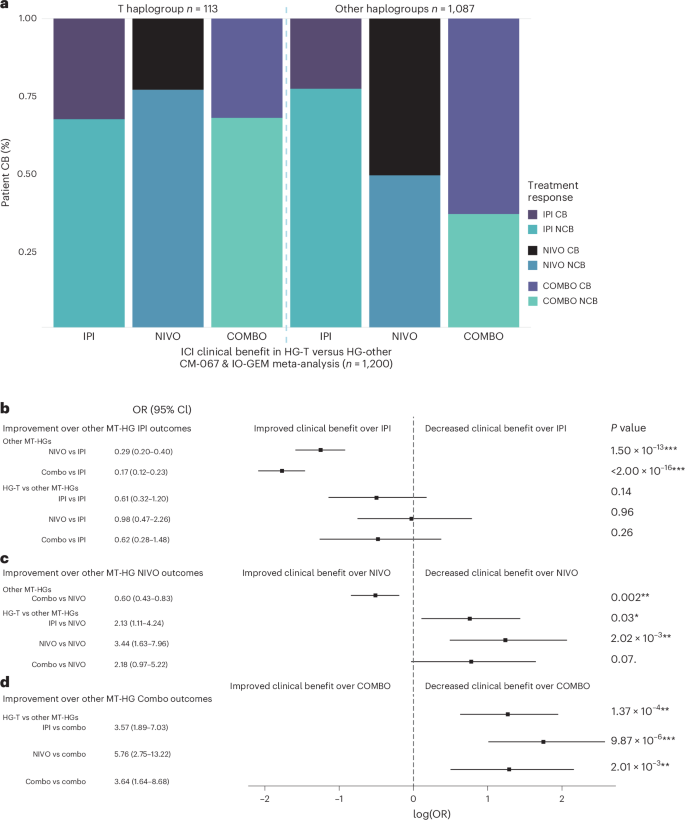
a, Meta-analysis proportions of CB and NCB comparing HG-T (n = 113) and other MT-HGs (n = 1,087) for CM-067 and IO-GEM IPI cohort (CTLA-4); CM-067 and IO-GEM NIVO cohort (PD-1); CM-067 and IO-GEM COMBO cohort. b–d, Forest plots from logistic regression analysis illustrating the improvement in ICI outcomes across treatments for HG-T and other MT-HGs for the patient population in a, showing the ORs, log odds, CIs and two-tailed P values. When a treatment is shown to be a significant improvement over another, it is not presented again in subsequent comparisons. Comparison groups are as follows: other MT-HGs treated with IPI (n = 431), NIVO (n = 307) or COMBO (n = 349); HG-T treated with IPI (n = 46), NIVO (n = 39) or COMBO (n = 28). b, Logistic regression comparing ICI treatment outcomes to outcomes for other MT-HGs treated with IPI (n = 431); point estimates to the left of the dashed line indicate an improvement in outcomes over those of other MT-HGs treated with IPI. For example, for other MT-HGs, treatment outcomes in NIVO were a significant improvement over treatment outcomes in IPI (row 1), while there was no statistical difference in treatment outcomes for patients belonging to HG-T who were treated with NIVO compared to other MT-HGs treated with IPI (row 4). c, Logistic regression comparing ICI treatment outcomes to outcomes for other MT-HGs treated with NIVO (n = 307). d, Logistic regression comparing ICI treatment outcomes to outcomes for other MT-HGs treated with COMBO (n = 349). Black boxes represent the point estimate for the main effect size (log odds) and the lines extending from them represent the 95% CIs. Point estimates to the left of the dashed line indicate increased odds of ICI CB compared to the reference (patients belonging to other European haplogroups who were treated with IPI, NIVO or COMBO), while point estimates to the right indicate increased odds of no ICI CB compared to the reference. CIs that do not cross the dashed line indicate a statistically significant point estimate (P
We also tested whether MT-HGs are associated with single-agent IPI (anti-CTLA-4) outcomes. There was no association between HG-T outcomes in the CM-067 IPI cohort (Extended Data Fig. 2e) compared to the IO-GEM IPI cohort (Extended Data Fig. 2f), and the meta-analysis combining both CM-067 and IO-GEM (n = 477) showed no statistically significant association of IPI efficacy with any of the MT-HGs (adjusted OR = 0.59 (95% CI: 0.31–1.18), P value = 0.13; Fig. 2a). We then evaluated improvements in outcomes for the different MT-HGs and ICI treatments to quantify the magnitude of the difference in CB for each treatment and haplogroup. For non-T MT-HGs, when compared to IPI, we found statistically significant improved outcomes in NIVO with further improvement in COMBO (OR = 0.29 and 0.17, respectively; Fig. 2b). For HG-T, however, none of the tested treatment regimens (IPI, NIVO or COMBO) showed statistically significant improvement when compared to non-T MT-HGs treated by IPI (Fig. 2b). For non-T MT-HGs, when compared to NIVO, COMBO-treated patients show significant improvement (OR = 0.60; Fig. 2c). The patients belonging to HG-T, however, when compared to non-T MT-HGs treated by NIVO, show comparably poorer outcomes for all three tested regimens (IPI, NIVO and COMBO; OR = 2.13, 3.44 and 2.18, respectively; Fig. 2c). The poor response outcomes observed in patients belonging to HG-T in all three regimens (IPI, NIVO and COMBO) were most significantly pronounced when compared to COMBO-treated patients belonging to non-T MT-HGs (OR = 3.57, 5.76 and 3.64, respectively; Fig. 2d).
HG-T subgroups do not correlate with NIVO response
HG-T, defined by the presence of ten ‘parental’ single nucleotide polymorphisms (SNPs), has been well characterized as consisting of several subgroups21, further defined by additional variants. We explored whether resistance to NIVO-based ICI was associated with the two primary subtypes of HG-T, T1 and T2. While subgroup T2 was more prevalent (~70% of all HG-Ts in our patient population), there was no statistical difference in response rates between HG-T1 and HG-T2 in NIVO (69% NCB in T1, 83% NCB in T2; P value = 0.30) or COMBO (71% NCB in T1, 67% NCB in T2; P value = 0.82) or a pooled analysis (NIVO and COMBO; 70% NCB in T1, 76% NCB in T2; P value = 0.57).
The predictive value of HG-T versus tumor-based ICI markers
We further tested whether HG-T may be a correlative for known tumor-based ICI predictors, or whether it represents an independent response biomarker. We evaluated the association between HG-T and CM-067 patients with tumor marker data available (n = 255 patients across the three treatment arms). This included PD-L1 status, CD8+ immune infiltration, TMB and expression of a ten-gene interferon-gamma (IFNγ) signature indicative of tumor inflammation (Supplementary Table 3). We calculated the correlation between HG-T, demographic variables (age and sex) and tumor variables (PD-L1 positivity; log10 TMB; and a composite score of either CD8+ T cell tumor infiltration > median, tumor IFNγ expression score > 0, or both; Fig. 3a). While PD-L1 status and the composite tumor immune infiltration score were highly positively correlated (R = 0.6), there were no other variables with a strong correlation, and HG-T was not correlated with any tumor or demographic factors (Fig. 3a and Extended Data Fig. 3a). When evaluating these tumor markers as continuous variables, we observed no difference in IFNγ expression (P = 0.87) or log10 TMB (P = 0.87); however, we have noted a slightly elevated CD8+ infiltration in HG-T compared to the other MT-HGs (P = 0.09; Extended Data Fig. 3b–d).
Fig. 3: Tumor markers and haplogroups in CM-067.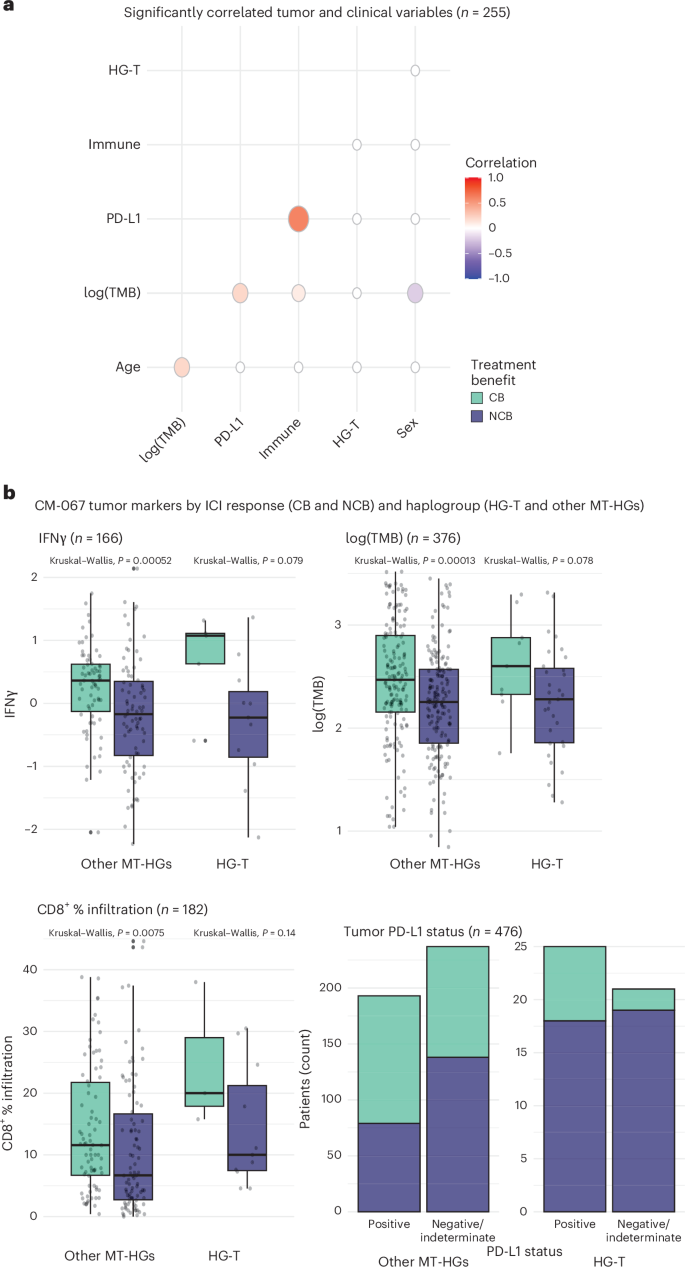
a, Correlation of tumor markers with clinical variables including log-transformed TMB, tumor PD-L1 status, composite ‘immune’ score (CD8+ T cell tumor infiltration > median, tumor IFNγ expression score > 0, or both), haplogroup (HG-T versus others) and sex (n = 255). b, Distribution of tumor markers stratified by haplogroup and ICI response for IFNγ score (n = 166), log-transformed TMB (n = 376), percentage tumor infiltration by CD8+ T cells (n = 182) and PD-L1 status (n = 476). Box plots depict lower and upper hinges (25th to 75th percentiles), median value (central line), whiskers extending from the hinges (largest and smallest values no more than 1.5 times the interquartile range) and outlying points outside this range (solid points beyond the whiskers). P values derived from Kruskal–Wallis tests.
We next evaluated the association between tumor characteristics, MT-HGs and treatment response. For both HG-T and the other MT-HGs, patients with CB tended to have higher levels of each tested tumor marker (PD-L1, TMB, IFNγ/CD8+ immune infiltration; Fig. 3b). While each of these tumor markers is significantly associated with CB in NIVO, they do not predict response in COMBO. In contrast, HG-T alone significantly predicts poor outcomes in both NIVO and COMBO treatments.
MT-HGs associated with baseline peripheral T cell phenotypes
Given the growing evidence that MT metabolism impacts T cell differentiation16, we assessed whether peripheral effector CD8+ T cells, as the targets of anti-PD-1 therapy, show distinct phenotypic features in patients with the NIVO-resistant haplogroup, HG-T, versus other haplogroups. To define a baseline immune profile associated with response and MT-HGs, we performed single-cell RNA sequencing (scRNA-seq) on pretreatment circulating CD8+ T cells from patients with HG-T and other MT-HGs.
We performed scRNA-seq analysis on CD8+ cells isolated from CM-067 NIVO-treated patients (n = 21), which included 8 patients with CB (n = 7 CR, n = 1 PR) and 13 with NCB (n = 13 PoD). To delineate the phenotypic differences associated with MT-HGs, we enriched the patient selection as follows: for NCB patients, we selected 7 HG-T (NCB-HGT) and an additional 6 NCB patients with other MT-HGs (NCB-HG°). For CB patients, we chose 1 with HG-T and 7 with other MT-HGs.
Using established scRNA-seq pipelines22,23,24, we mapped the transcriptional profiles of the CD8+ T cells using the uniform manifold approximation and projection (UMAP) algorithm identifying 17 CD8+ T cell clusters (Fig. 4a). Based on differential gene expression profiles of T cell marker genes derived from established reference sets24,25, we annotated these 17 clusters to specific cell types (Extended Data Fig. 4a,b). We defined major phenotypic states used for downstream analysis, ordering them by T cell differentiation state (Fig. 4b): naive cells (clusters 0 and 5), effector cells (cluster 6, earliest stage of effector cell differentiation; cluster 1, early exhaustion; cluster 2, late exhaustion) and dysfunctional T cells (cluster 10), defined as those with the highest mean expression levels of exhaustion markers (Extended Data Fig. 4c).
Fig. 4: scRNA-seq analysis for pretreatment circulating CD8+ T cells from CM-067 NIVO patients (n = 21) and CM-915 patients (n = 31).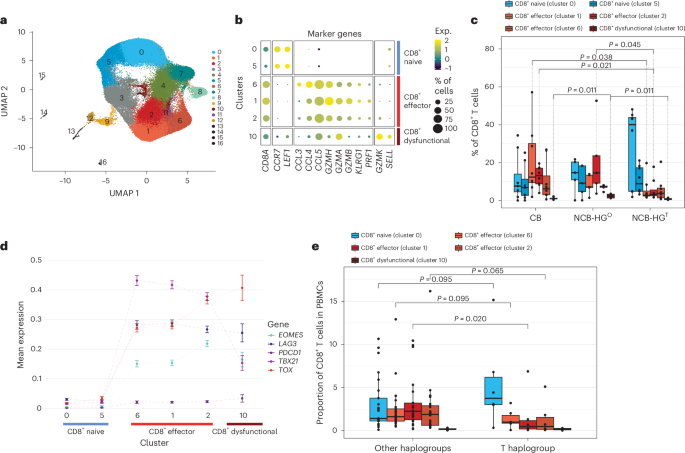
a, UMAP dimensionality reduction plot (CM-067, n = 21 patients). b, Bubble plot showing per-cluster cell-type classification based on T cell marker gene expression (CM-067, n = 21 patients). c, Box plots showing single-cell CD8+ T cell-type proportions stratified by NIVO treatment response (CB, NCB) and haplogroup (HGT; other haplogroups, HGO; CM-067, n = 21 patients). P value from one-tailed Wilcoxon rank-sum test for the following comparisons: cluster 1, HGT versus CB, P = 0.038; cluster 2, HGT versus CB, P = 0.021, HGT versus HGO, P = 0.045; cluster 10, HGO versus HGT, P = 0.011, HGO versus CB, P = 0.011. d, Scatterplot showing per-cluster mean expression of T cell exhaustion markers grouped by cell type. The connecting lines are used for the visualization of the changes in the gene expression of the selected markers per cluster. The clusters are ordered from least differentiated to exhausted phenotypes, based on the levels of differentiation markers as derived from b. e, Box plots showing single-cell CD8+ T cell-type proportions of baseline (postsurgical resection, pre-ICI) patient samples from CM-915 stratified by haplogroup (T haplogroup versus other haplogroups; CM-915, n = 31 patients). P value from one-tailed Wilcoxon rank-sum test, cluster 1, HG-T versus other MT-HGs, P = 0.020. Box plots depict lower and upper hinges (25th to 75th percentiles), median value (central line), whiskers extending from the hinges (largest and smallest values no more than 1.5 times the interquartile range) and outlying points outside this range (solid points beyond the whiskers).
When stratifying the CD8+ T cell phenotypes by NIVO response status and MT-HG, NCB-HGT patients tended to have predominantly naive cells and significantly fewer early exhausted cells (cluster 1, P value = 0.02) and late exhausted cells (cluster 2, P value = 0.04) compared to CB patients. Compared to NCB-HG°, NCB-HGT patients not only had fewer late exhaustion cells (cluster 2, P value = 0.05) but also significantly fewer dysfunctional cells (cluster 10, P value = 0.01; Fig. 4c). Of note, the one HG-T CB patient included in this analysis showed a phenotype similar to that of other CB patients, presenting with predominantly non-exhausted effector CD8+ T cells.
It has been shown that PD-1 inhibition can reinvigorate exhausted T cells and promote their effector function; however, only a subset of exhausted cells, characterized by high T-bet (TBX21hi) and low EOMES (EOMESlo), is capable of reinvigoration26,27. Conversely, cells that continue along this differentiation trajectory become terminally exhausted and cannot be reinvigorated25,28,29; these cells are characterized by low T-bet (TBX21lo), high EOMES (EOMEShi) and high TOX (TOXhi). Based on this model, we further refined exhausted phenotypes identified in our data and defined TBX21hi exhausted cells, the primary target of reinvigoration by NIVO, and those with high EOMES (EOMEShi) and/or TOX (TOXhi). Cluster 1, with TBX21hi and EOMESlo expression (Fig. 4d), likely represents the early exhaustion phenotype that can be reinvigorated and is predominantly present in CB patients. NCB-HG° patients show elevated levels of both cluster 2 (EOMEShi, TOXhi and TBX21lo) and cluster 10 (EOMESlo, TBX21lo and TOXhi; Fig. 4d), both likely the terminally exhausted cells (cluster 2) or dysfunctional T cells (cluster 10) with no capacity for anti-PD-1 reinvigoration. In contrast, NCB-HGT patients show a significantly lower proportion of all three states of exhausted cells, exhibiting a distinct baseline peripheral cell phenotype characterized by an overall lower fraction of differentiated CD8+ T cells in patients with these haplogroups.
To further validate the HG-T baseline peripheral phenotype, we generated scRNA-seq data from PMBCs of an additional n = 31 patients available from a separate clinical trial (CheckMate-915 (CM-915)). These included n = 6 patients with HG-T and n = 25 patients of other non-T MT-HGs. Based on the gene expression profiles from this independent analysis, we were able to match the corresponding clusters of CD8+ T cells identified from the CM-915 scRNA-seq with those defined in CM-067 (Extended Data Fig. 4d). This comparison further confirmed the overall reduction in terminally exhausted T cells in patients belonging to HG-T (Fig. 4e) compared to other non-T MT-HGs. The association was statistically significant in the same direction as in CM-067 patients (P = 0.0203), further confirming that this is a peripheral cell phenotype specific to HG-T.
HG-T CD8+ cells express ROS detoxification genes
The results from scRNA-seq analysis in CM-067 demonstrated the three patterns of baseline CD8+ T cell phenotypes stratified by both treatment response (CB/NCB) and MT-HG status (HG-T versus other MT-HGs). The most distinct subgroups were HG-T NCB patients (with very few differentiated effector cells) and NCB patients with other MT-HGs (with a higher fraction of terminally exhausted ‘dysfunctional’ effector cells). Existing evidence suggests that the mitochondrially driven ROS production drives effector T cell differentiation16, and there are prior observations indicating that ROS tolerance may differ between HG-T and other MT-HGs17. We therefore sought to identify whether transcriptional differences of ROS or other related metabolic pathways between HG-T and non-T HGs may expand further functional understanding of how MT-HGs associate with the T cell phenotypes observed in the scRNA-seq analysis.
We performed bulk RNA-seq analysis on CD8+ T cells isolated from NIVO-treated NCB patients from CM-067 (n = 62; n = 9 with HG-T and n = 53 with other MT-HGs). Differential gene expression analysis demonstrated baseline transcriptional differences in the immune cells of patients with different haplogroups: 240 differentially expressed genes (DEGs) were upregulated in HG-T, and 277 were upregulated in the other MT-HGs (Extended Data Fig. 5a). Consistent with our hypothesis, Gene Ontology (GO) analysis on the top 260 DEGs revealed the ROS pathway as the top significantly enriched pathway (P = 0.02; Fig. 5a), with two genes (glutamate-cysteine ligase catalytic subunit, GCLC; and glutathione peroxidase 3, GPX3) associated with ROS detoxification upregulated in HG-T.
Fig. 5: Baseline differences in gene expression by haplogroup comparing bulk RNA-seq from peripheral blood CD8+ T cells in CM-067.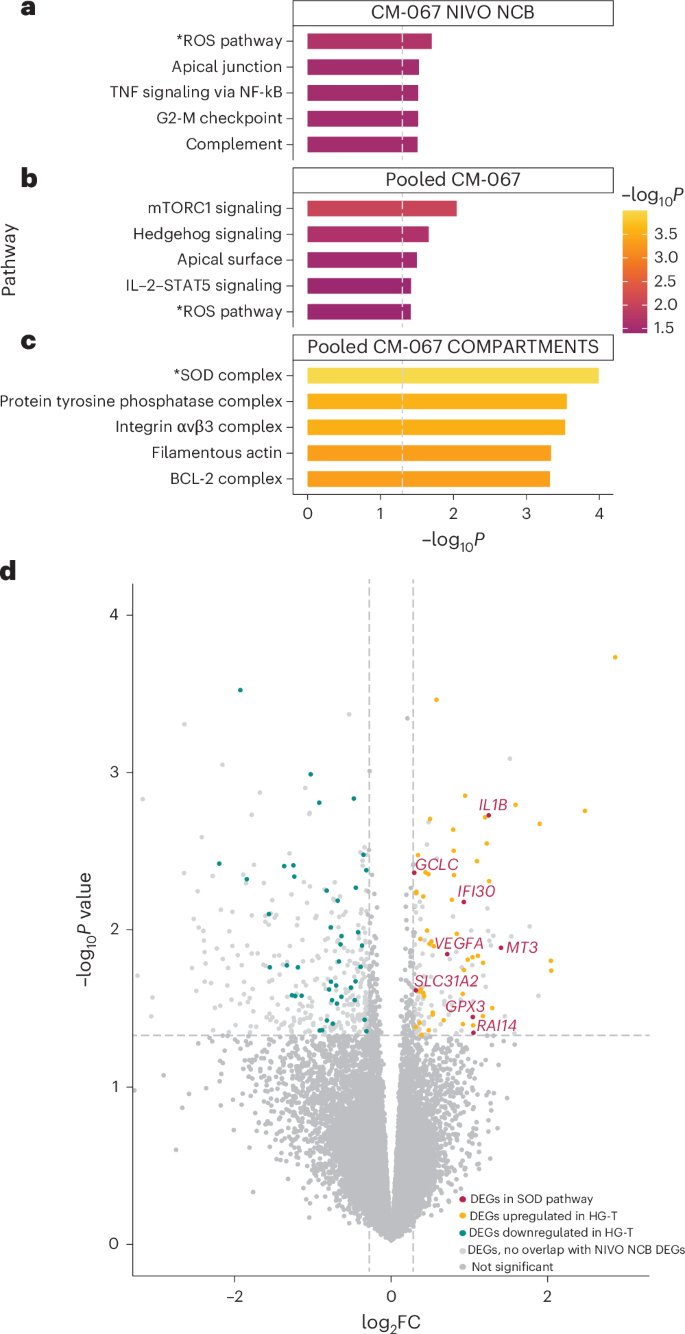
a, Top five significantly enriched pathways from GO analysis on top DEGs from CM-067 NIVO NCB cohort (n = 62 patients) comparing HG-T (n = 9) versus other MT-HGs (n = 53). −log10-transformed P values derived from two-tailed Fisher’s exact test. b,c, Top five significantly enriched pathways from GO analysis (Fig. 5b) and COMPARTMENTS database (Fig. 5c) on top DEGs from CM-067 NIVO and COMBO cohorts (n = 212 patients) comparing HG-T (n = 17) versus other MT-HGs (n = 195). −log10-transformed P values derived from two-tailed Fisher’s exact test. d, Volcano plot from differential expression analysis from NIVO and COMBO CM-067 analysis (n = 212) showing upregulation of DEGs in the SOD pathway in HG-T. Genes with negative log2 fold change (log2FC) are downregulated in HG-T; genes with positive log2FC are upregulated in HG-T. Red points are the significant DEGs in both NIVO NCB and NIVO and COMBO analyses that are present in the SOD pathway. Yellow and blue points are DEGs that are significantly upregulated and downregulated, respectively, in HG-T in both NIVO NCB and NIVO and COMBO analyses. Light gray points are significant DEGs in the NIVO and COMBO analysis that did not overlap with DEGs in the NIVO NCB comparison. Dark gray points are genes that were not significantly differentially expressed and did not overlap between the NIVO NCB comparison and NIVO and COMBO comparison. −log10-transformed P values derived from negative binomial Wald test in DESeq2.
To test the baseline differences between HG-T and other non-T HGs, regardless of treatment outcome, we performed another DEG analysis on a larger cohort of CM-067 patients treated with either NIVO or COMBO and comprising both CB and NCB outcomes (total n = 212 CM-067 patients; n = 17 HG-T, n = 195 other MT-HGs; Extended Data Fig. 5b). Using the overlap between the top DEGs from the NIVO NCB analysis and the DEGs in this comparison, we identified 127 of 206 genes still differentially expressed, all with the same directionality as in the original analysis. When performing GO on this set of 127 genes, the ROS pathway was still among the top five significantly enriched pathways (P = 0.04; Fig. 5a), with GCLC and GPX3 again upregulated in HG-T. We further explored the pathways enriched among these DEGs using the COMPARTMENTS database, which uses protein subcellular localization evidence to explore the potential cellular functions of proteins. Here, the most significantly enriched pathway was the superoxide dismutase (SOD) complex pathway (P = 1.02 × 10⁻⁴; Fig. 5a), involving genes encoding proteins related to key antioxidant cellular functions30. The SOD pathway contains both GCLC and GPX3 (also found in the ROS pathway) but also includes additional antioxidant-related genes found to be upregulated in HG-T, including SLC31A2, IL1B, IFI30, MT3, RAI14 and VEGFA (Fig. 5b).
Association between MT-HG and post-ICI survival
As survival is the most definitive indicator of ICI therapy success, we also tested whether MT-HGs are associated with progression-free survival (PFS) and overall survival (OS) after ICI (Extended Data Fig. 6a–d and Supplementary Tables 4 and 5a,b) using well-harmonized survival data from CM-067. We found significantly decreased PFS among the HG-T NIVO-treated patients (age, sex, stage-adjusted PFS hazard ratio = 1.83 (95% CI: 1.09–3.05), P value = 0.021) and a similar trend for COMBO-treated patients (adjusted PFS hazard ratio = 1.78 (95% CI: 0.89–3.57), P value = 0.11; Fig. 6a,b and Supplementary Table 4). Indeed, 78% of all patients belonging to HG-T progressed within the first 4 months of treatment (75% for NIVO-treated HG-T and 80% for COMBO-treated HG-T), and their OS was also significantly poorer than patients who experienced CB (NIVO adjusted P value P value 6e,f and Supplementary Table 5c,d).
Fig. 6: PFS probability by haplogroup in CM-067.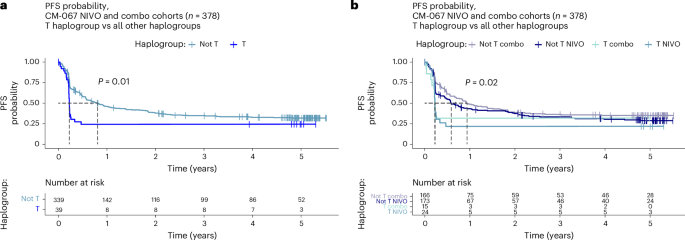
a, PFS (in years) comparing HG-T (n = 39) and other MT-HGs (n = 339) in CM-067 NIVO and COMBO cohorts (n = 378). P value from two-tailed Kaplan–Meier (log-rank) test. b, PFS (in years) stratified by treatment, comparing HG-T treated by NIVO (n = 24) and COMBO (n = 15) and other MT-HGs treated by NIVO (n = 173) and COMBO (n = 166). P value from two-tailed Kaplan–Meier (log-rank) test.
MT-HGs predict ICI outcome independent of disease prognosis
Given the observed associations of HG-T with NIVO and COMBO resistance, validated in multiple patient populations in our study, we sought to evaluate whether MT-HG status is predictive of ICI outcomes or a reflection of overall disease prognosis. We assessed the association of MT-HGs and OS in a prognostic cohort of 1,024 ICI-naive patients with melanoma (not treated by ICI) enrolled at New York University Langone Health31, with extensive follow-up (Extended Data Fig. 6g,h). In this analysis, we found no difference in survival in early-stage (I and II) patients (n = 915, P value for OS by haplogroup = 0.41; Extended Data Fig. 6g and Supplementary Table 5e) or later-stage (III) patients in both univariable and multivariable analyses (n = 109, P value for OS by haplogroup = 0.78; Extended Data Fig. 6h and Supplementary Table 5f).