The problem: chirp/dispersion penalty
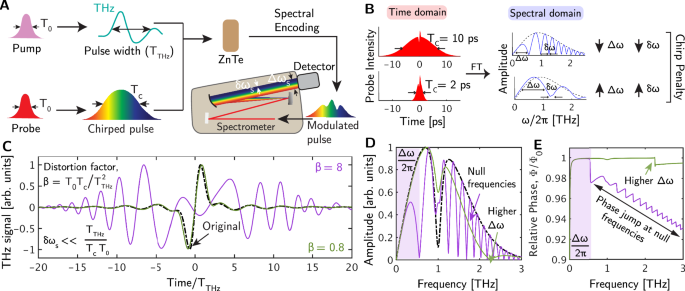
Spectral encoding is a technique that is employed commonly to extract THz-TDS in a single shot of a laser pulse9,10,11. This method modulates a THz time domain signal onto the frequency components of a chirped probe beam at an electro-optic crystal (Fig. 1A). The THz modulated probe beam is then sent into a spectrometer to extract the THz signal (SI Sec. 1) by mapping the frequency components of a probe beam to the time domain using a time-wavelength calibration (Methods, SI Sec. 4). This method, however, introduces a chirp penalty because of mismatches that exist between the THz time domain information and the finite bandwidth of a probe pulse (i.e., measurement window vs. probe bandwidth). A finite bandwidth can only accommodate a limited amount of information while maintaining a phase-accurate representation of the original modulating signal (i.e., the THz electric field) after demodulation. However, a narrow probe bandwidth is often chirped to longer pulse durations and forced to carry the time domain information from extended THz pulses, which, while increasing the measurement window of the diagnostic, leads to signal distortion and a lack of phase accuracy.
Quantitative applications of THz-TDS require a high spectral resolution, typically up to ~10–100 GHz, to resolve line shapes and measure phase shifts across a broad range of frequencies. Achieving this level of resolution necessitates single-shot approaches that are capable of measuring THz signals over an extended time period, often spanning ~10–100 ps, to ensure sufficient sampling for a given resolution and sensitivity. For example, extending the measurement time (i.e., chirped pulse width, Tc) in THz-TDS resolves lower THz frequencies (\(1/\)Tc), which enhances the sensitivity for detecting refractive media that exhibit a Drude response (Fig. 5C)22. Decreasing the spacing between measurements in the time domain improves the resolution in resolving absorption features (Fig. 4C–E). This is due to the reciprocal relationship between spectral resolution in the Fourier domain (δω, the spacing between two adjacent data points in the frequency domain) and the measurement duration in the time domain, which is governed by the number of time domain steps, the signal-to-noise ratio (SNR) of the diagnostic, and the spacing between successive measurements. However, as chirped pulse widths increase to improve the spectral resolution, the distortion of the THz signal increases, shrinking the usable bandwidth (Δω) in the frequency domain (Fig. 1B). This distortion creates a trade-off between δω and Δω in single-shot THz-TDS, restricting the quantitative accuracy of the diagnostic (Fig. 1B).
The extent of signal distortion can be quantified using the distortion factor, β (SI Secs. 1, 2, Fig. 1C), where lower β values indicate that a signal extracted in a single shot more closely resembles an undistorted THz signal (pulse width, TTHz, Fig. 1A). β is proportional to the probe bandwidth (or its transform-limited pulse width, T0) and Tc, where a narrower probe bandwidth (larger T0) or longer Tc increases signal distortion. The effect of β on a THz waveform can be evaluated analytically in the limit of chirp rate (α) \(\gg \frac{1}{{{\mbox{T}}}_{{\mbox{c}}}^{2}}\) and \({{\mbox{T}}}_{{\mbox{c}}}^{2}\gg {{\mbox{T}}}_{{\mbox{THz}}}^{2}\) (SI Sec. 1) or numerically using fast Fourier transforms (FFTs) (Methods, SI Sec. 2) and wavelength-time conversion. In this work, we adopted the numerical approach because it can be applied to any THz waveform, including those that are measured experimentally, not just well-defined mathematical forms like the bipolar signal (Eq. 3). Additionally, while the analytical expression (Eq. S2.4, SI Sec. 2) captures the stretching effect of the distorted signal, it fails to capture the multi-cyclic nature (as shown in Fig. 1C) of the distortion23. Capturing these features in the time domain using a numerical approach (Fig. 1C) is essential because they introduce artifacts in the frequency domain (i.e., null frequencies) which limit Δω in both amplitude (Fig. 1D) and phase (Fig. 1E) spectra. The higher the β, the higher the number of null frequencies in the frequency domain. The presence of these features limits the quantitative accuracy of the diagnostic. While shortening Tc can reduce β, it also limits δω which can constrain the range of frequencies over which phase shifts can be measured or the ability to resolve absorption features in an amplitude spectrum. For example, a β = 8 corresponds to a narrower Δω (~0.5 THz) compared to β = 0.8, and thus fails to capture a spectral feature of interest present at 1 THz (Fig. 1D) (in time domain, it corresponds to a bipolar signal devoid of a 1 THz sine wave, Fig. 1C). To improve and optimize performance, a quantitative single-shot diagnostic needs to extend the measurement window to enhance δω while also minimizing β. Since TTHz is fixed for a given generation scheme, reducing T0 of a probe pulse (i.e., increasing its bandwidth) becomes one method that is used in SETS to reduce β and expand Δω without compromising δω.
A solution: supercontinuum-Enhanced Terahertz Spectroscopy (SETS)
Supercontinuum pulses24,25 (Methods) provide a broadband probe that overcomes a fundamental limitation of single-shot measurements by expanding the probe’s bandwidth independently of its chirped pulse width. In this study, three methods for measuring THz radiation in a TDS configuration were implemented: a delay line method, a chirped pulse single-shot method with a narrow and limited probe bandwidth, and a chirped supercontinuum single-shot method with adjustable probe bandwidth (i.e., SETS) (Fig. 2A, Methods). The diagnostic setup employed a femtosecond laser amplifier to pump an optical parametric amplifier (OPA), producing a 1532 nm, 80 fs pump beam and a 780 nm, 350 fs probe beam, each with ~1 µJ pulse energy and repetition rates of up to 2 MHz. THz radiation was generated using the pump beam via optical rectification in a 500 µm-thick PNPA organic crystal, achieving >4% efficiency26, and detected using a 2 mm-thick ZnTe crystal that modulated the probe beam through the electro-optic effect, responding proportionally to the local THz electric field (Methods). In delay line detection, the polarization-modulated probe pulse was converted to amplitude modulation using a Wollaston prism and a quarter-wave plate in a balanced photodetection setup, with data acquired at 133 fs/step using a motorized delay stage, lock-in amplifier, and digital oscilloscope. Single-shot detection used chirped probe pulses that were polarization-modulated using electro-optic modulation, converted to amplitude modulation with cross-polarizers (extinction ratio >1000:1), and analyzed using a spectrometer equipped with an EMCCD camera (Methods). This modular design supported multiple detection methods while ensuring high SNR. For SETS, A supercontinuum was generated by focusing the probe beam onto a 6 mm thick sapphire crystal. By adjusting the focal point of the probe within the crystal, the probe’s bandwidth was controlled, compensating for the chirping of the probe pulse.
The delay line method, while offering high accuracy and temporal resolution, is limited by its slow mechanical scanning process, making it unsuitable for capturing transient reactive flow phenomena27. This method introduces a trade-off between temporal resolution (set by the delay line stepping and T0 of the probe) and the total measurement time window (set by the scanning range). In this work, the delay line signal is used for benchmarking purposes and validating the single-shot results in terms of temporal, amplitude and phase accuracy. The chirped pulse method with limited bandwidth, though faster with measurements times of a single-shot, succumbs to the chirp penalty from spectral encoding, leading to time domain signal distortion. In contrast, the chirped supercontinuum single-shot method overcomes this limitation by generating a broadband supercontinuum pulse compared to a narrow probe bandwidth for the same temporal pulse width. Experimentally, we demonstrated a 2-fold increment in bandwidth with supercontinuum for a fixed temporal pulse width of ~2 ps (Fig. 2B). This approach reduces β by increasing the carrier/probe bandwidth, preserves high δω, and extends Δω, offering a more efficient and accurate method for capturing THz radiation with enhanced fidelity.
A supercontinuum improves THz pulse extraction
In this section, experiments and theory were developed to understand the root cause of distortion and validate the spectral encoding model with experimental data obtained with SETS. Experiments were performed to demonstrate how increasing the bandwidth of a probe beam using a supercontinuum pulse, or equivalently reducing T0, reduces the distortion in extracted THz signals (Fig. 3A, B). For instance, using a regular chirped pulse with limited bandwidth (22 nm) resulted in a β of 1.22, which improved to 0.64 when switching to a supercontinuum pulse with a bandwidth that is 2 times larger (45 nm). This demonstrates that a supercontinuum pulse more accurately reconstructs the original delay line signal (obtained through point-by-point sweeping of the delay line, Methods) compared to a chirped pulse. Additionally, simulations were performed using the spectral encoding algorithm (SI Sec. 1, Methods) to replicate the electro-optic modulation and demodulation of chirped (T0 = 40 fs) and supercontinuum (T0 = 20 fs) signals, assuming a modulation constant, k, of 0.01 (∣k∣ ≪ 1, Methods). These simulations utilized the delay line THz electric field as the original, undistorted THz waveform. This was used to validate the experimental results and extrapolate the results further.
The 2-fold reduction in distortion that was observed in the experimental time domain data (Fig. 3A, B) enhanced spectral characteristics, increasing Δω from 1.5 THz to > 2.2 THz while maintaining a fixed δω of 0.3 THz. This improvement is evident in both the amplitude (Fig. 3C) and phase spectra (Fig. 3D), showcasing how a supercontinuum pulse enhances the overall spectral fidelity. In amplitude spectra, Δω is constrained by the location of the first null frequency, marking the effective limit of usable bandwidth. In the phase spectra, represented as a ratio relative to the benchmark delay line phase (ϕ0), deviations from unity indicate the influence of null frequencies and their disruptive effect on the spectral data as discussed in Fig. 1D, E. Therefore, when the spectral information of the target THz electric field extends beyond the first null frequency, the time domain signal becomes distorted. This is because null frequencies act as a virtual low-pass filter, removing or perturbing critical high-frequency components (i.e., those beyond the first null frequency). These null frequencies get closer to each other progressively with Tc (Fig. 1D) and thereby remove a significant portion of the spectrum beyond the first null frequency, leading to issues with quantitative absorption spectroscopy (Fig. 4) and phase linearity (Fig. 5). The higher the β, the narrower the frequency range that this low-pass filter allows, leading to increased distortion. Thus, minimizing β is essential to preserve the time domain signal and its spectral accuracy.
Tuning T0 relative to Tc allows control over β and enables adjustments to Δω and δω in single-shot approaches (Fig. 3E), manipulating the characteristics of the virtual “low-pass filter”. While increasing Tc improves δω, it narrows Δω. For example, for a Tc of ~10 ps, δω changes from ~0.3 THz (corresponding to a Tc of ~2 ps) to ~0.06 THz. However, this increase in Tc reduces Δω from ~1.5 THz to 3E). To counteract this, a proportional 5-fold reduction in T0 maintains a consistent low β, preserving the original Δω, because \(\Delta {\upomega}\propto \frac{1}{\sqrt{{{\mbox{T}}}_{{\mbox{c}}}{{\mbox{T}}}_{0}}}\). Nevertheless, reducing β allows Δω to expand but only up to the intrinsic THz bandwidth or the phase-matching limit of the electro-optic crystal, beyond which it plateaus to this limit (Fig. 3E).
Impact of supercontinuum probing on the amplitude spectrum
In this section, experiments were performed to quantify the gaseous absorption features using single-shot THz-TDS. Theory was developed to extend experimental results to higher Tc values using simulated THz pulses, both in the presence and absence of water vapor, to dictate conditions that are necessary for a desired accuracy in gas sensing applications. By applying a Beer’s law fit28 to their Fourier counterparts (Methods, SI Sec. 7), we investigate the impact of freely adjustable T0, enabled through the use of a supercontinuum, on the accuracy of quantitative absorption spectroscopy. Experiments demonstrated how optimizing both the experimental setup and measurement conditions is crucial for quantitative THz spectroscopy, particularly in extracting physical properties like the line-averaged number density (ñ). This involved analyzing the amplitude spectra of the THz signal modulated by water vapor and the background THz signal without water vapor absorption. The spectra were obtained by applying FFT to the corresponding time-domain THz signals (Methods). Calculating the logarithm of the ratio of these spectra results in the absorption spectrum, which was then fit to determine ñ. This was done using a purge box maintained at 1 atm to isolate the THz beam path of 70 cm from the surroundings and control the water vapor content (Fig. 4A) or relative humidity (RH) within a range of 3C), δω of 0.3 THz remained inadequate for quantitative absorption spectroscopy due to the use of a 2 ps probe pulse. Applying Beer’s law to absorbance data (Methods, SI Sec. 7) obtained from 2 ps chirped and supercontinuum-extracted THz signals resulted in fits that extracted ñ with > 80% uncertainty due to a large δω of 0.3 THz (Fig. 4B).
We simulated THz absorption by water vapor for various measurement windows (i.e., Tc in the case of single-shot methods) to understand the impact of Tc on the absorption spectrum. In these simulations, the original delay line signal passes through a section filled with humid air at an RH of ~14%, allowing us to determine the theoretical undistorted THz signal modulated by water vapor. This signal is then transformed into the single-shot time domain signal using spectral encoding (detailed in SI Sec. 7). By expanding Tc, we not only reduce δω but also capture more THz time-domain information. For instance, when Tc is increased to ~10 ps, δω improves from ~0.3 THz (at Tc ~2 ps) to ~0.06 THz. Therefore, increasing Tc is a pathway to improve absorption spectrum data for a better fit and extraction of ñ (Fig. 4C). In this work, the accuracy of the fit is quantified as the ratio of estimated ñ from the fit for a given Tc to the actual ñ content in the purge box as measured by a thermal conductivity humidity sensor. Nevertheless, increasing Tc also introduces a chirp penalty, which can be mitigated by reducing T0 prior to applying this approach for quantitative absorption spectroscopy.
While increasing Tc captures more THz information and brings the measured ñ closer to its actual value, the reliability of the fit is also sensitive to T0 (Fig. 4C, D) due to the chirp penalty from spectral encoding. For example, at Tc = 2 ps, experimental data reveals that supercontinuum pulses with a 45 nm bandwidth result in approximately a 22% improvement in fitting the J-branches of H2O between 0.4 and 1.1 THz, compared to chirped pulses with a more limited bandwidth of 22 nm. This discrepancy arises because higher T0 values in chirped pulses introduce more null frequencies, as seen in Fig. 4C. These nulls can overlap with critical peaks in an absorption spectrum, amplifying uncertainty in both the spectral fit and the extracted ñ. In contrast, reducing T0 minimizes null frequencies, improving the reliability of the fit (Fig. 4D). This highlights the importance of optimizing T0 alongside extending Tc for accurate measurements. We demonstrate this by fitting two absorption spectra corresponding to a fixed Tc of 250 ps (i.e., 4 GHz of spectral resolution) but with different probe bandwidths (T0) (Fig. 4E). The spectrum extracted with higher T0 shows null frequencies as expected and a few of them overlap with the peaks of interest, increasing the uncertainty in the extracted ñ (or relative humidity in this case, as the medium was humid air). On the other hand, the spectrum obtained with lower T0 exhibits no null frequencies, enabling the use of a larger Tc to reduce δω while mitigating the associated increase in β. This results in improved spectral fidelity and reduced measurement uncertainty, which was previously not possible or shown with single-shot THz-TDS systems.
Impact of supercontinuum probing on the phase spectrum
In this section, experiments were performed to demonstrate the capability to measure refractive properties of media using phase shifts in single-shot THz-TDS. A combination of theory and simulations are applied on an ideal bipolar signal (Eq. 3) to establish how a supercontinuum is advantageous compared to chirped pulses with limited bandwidth at extracting a phase spectrum (Fig. 5). We then measure phase spectra using SETS on a plasma as a refractive medium of interest9,10,29,30,31,32 to test the quantitative capabilities of SETS and validate the claims (Fig. 6, SI Sec. 6).
Two critical aspects of phase spectra are phase linearity, δω, and Δω. Phase linearity refers to the frequency range over which the phase changes linearly with frequency, and this linear range determines the usable bandwidth (Δω). Increasing the chirped pulse width Tc enhances δω but reduces Δω, as the increase in β disrupts phase linearity (or close to unity in the case of ϕ/ϕ0) due to the presence of null frequencies. We show this by simulating a spectrally encoded single-shot time domain signal from an ideal bipolar signal (Eq. 3, TTHz = 0.25 ps) and transforming it into frequency domain using FFT to find the phase spectrum (Fig. 5A). The null frequencies introduce abrupt changes in ϕ/ϕ0 (Fig. 5A), mirroring their impact on the absorption spectrum. A supercontinuum helps mitigate this by reducing β, maintaining high spectral resolution and preserving phase linearity across a broader frequency range. For example, for a Tc of 2 ps, a 2-fold increase in bandwidth due to the supercontinuum, reduces β by half and increase Δω from ~1.5 THz to ~2 THz. As discussed earlier for absorption spectrum, increasing Tc (to say 10 ps from 2 ps, Fig. 5A) limits Δω due to the chirp penalty, which a supercontinuum overcomes.
On the other hand, understanding the need for higher δω originates from the need to infer refractive properties using a phase shift (Δϕ) spectrum. For example, when a THz waveform passes through a plasma, an example of a medium that has a refractive index varying as a function of frequency, it incurs a phase shift. This is because different frequency components of the waveform travel at different speeds, resulting in signal dispersion. A higher δω in Δϕ spectra, or a longer Tc, is advantageous for the quantitative characterization of a plasma for a few reasons: 1) to access low-frequency data such as collision frequency (\({\nu}_{{\mbox{en}}}\)) (Figs. 5B and 2) to improve resolution for measuring low plasma electron density (\({\widetilde{{{\rm{n}}}}}_{{{\rm{e}}}}\)) or plasma frequency (ωp) (Fig. 5C). These properties can be inferred from a measured phase shift using the Drude model, which relates the plasma properties like ωp and \({\nu}_{{\mbox{en}}}\) with Δϕ (Methods, SI Sec. 5) through a plasma’s complex refractive index (N). Therefore, single-shot THz spectroscopy can serve as a valuable diagnostic tool for measuring ωp (or ne) and \({\nu}_{{\mbox{en}}}\). Since Δϕ drops with frequency, a higher δω allows for measuring larger Δϕ values that exceed its experimental measurement uncertainty (SI Sec. 8). Thus, longer Tc enables the detection of lower \({\widetilde{{\mbox{n}}}}_{{\mbox{e}}}\) (Fig. 5C). For example, increasing the probe pulse width from 2 ps to 100 ps enhances the \({\widetilde{{\mbox{n}}}}_{{\mbox{e}}}\) resolution from 1017 m⁻³ to 5 × 10¹⁵ m⁻³ respectively (Fig. 5C). Further increasing Tc can extend this range even more, but T0 must be reduced proportionally to keep β low and minimize signal distortion. A limitation of this diagnostic is that when \({\nu}_{{\mbox{en}}}\) is large, the \({\widetilde{{\mbox{n}}}}_{{\mbox{e}}}\) resolution quickly plateaus and no longer improves with increasing Tc (Fig. 5C). This means that the diagnostic’s ability to measure progressively lower \({\widetilde{{{\rm{n}}}}}_{{{\rm{e}}}}\) diminishes when ωp/\({\nu}_{{\mbox{en}}}\)«1, as the maximum achievable Δϕ is constrained by ωp/\({\nu}_{{\mbox{en}}}\) (Fig. 5B).
The THz electric field undergoes both amplitude attenuation and phase shift when interacting with a dispersive plasma. This behavior arises from reflection losses at the plasma-air interface and the dispersive nature of plasma. To extract plasma parameters such as ωp and \({\nu}_{{\mbox{en}}}\), it is necessary to analyze both amplitude and phase changes for a given frequency, similar to microwave interferometry8. However, unlike interferometric techniques, THz-TDS enables simultaneous broadband measurements in the time domain, allowing direct comparison of undispersed and plasma-dispersed signals. This provides two methods to extract properties of a plasma: 1) Amplitude and phase analysis: By applying the Drude model, both ωp (or ne) and \({\nu}_{{\mbox{en}}}\) can be extracted simultaneously, forming a well-defined two-variable system. This can also be achieved by fitting THz time domain data obtained experimentally to simulated plasma-dispersed THz signal (Methods, SI Sec. 5–6). 2) Phase-shift analysis: For conditions where ω ≫ \({\nu}_{{\mbox{en}}},\) ωp, the simplified Drude model can extract \({\widetilde{{\mbox{n}}}}_{{\mbox{e}}}\) independently from Δϕ spectra (Methods, SI Sec. 5).
Experiments were conducted using a 27.17 MHz inductively coupled plasma at 220 mTorr, with RF power varied from 150 W to 500 W (Fig. 6A) to demonstrate the use of SETS as a diagnostic to infer the refractive properties of a plasma. Single-shot time domain measurements were conducted using chirped (22 nm) and supercontinuum (45 nm) pulses. The experimental results were compared to simulated THz pulse shapes (Fig. 6B) by applying the spectral encoding algorithm (SI Sec. 1) to the delay line signal (Fig. 6B) and compare with the experimental results, corresponding to a reduction in β from 1.22 (chirped) to 0.64 (supercontinuum). To extract \({\widetilde{{\mbox{n}}}}_{{\mbox{e}}}\), the time domain data was transformed into the frequency domain using a Fourier Transform (Methods) to analyze Δϕ, the phase shift induced by the plasma. This approach is valid when ω (~1 THz) ≫ \({\nu}_{{\mbox{en}}}\) (~6.5 GHz at 150 W) and ωp (~4.5 GHz at 150 W). The values for \({\nu}_{{\mbox{en}}}\) and ωp were determined by transforming the undispersed original experimental THz waveform into the frequency domain, applying the plasma transfer function, and iteratively minimizing the least square difference between the simulated and experimental signals (Methods, SI Sec. 5–6). Finally, the extracted Δϕ from the experiments was fitted to the simplified Drude model, which relates Δϕ directly to \({\widetilde{{{\rm{n}}}}}_{{{\rm{e}}}}\) (Methods, SI Sec. 5), to determine \({\widetilde{{{\rm{n}}}}}_{{{\rm{e}}}}\) (Fig. 6C). The single-shot results were validated against baseline delay line data, with measurements repeated at different powers (250 W, 330 W, 400 W, and 500 W) for all three measurement types. The \({\widetilde{{\mbox{n}}}}_{{\mbox{e}}}\;{\mbox{values}} \;{\mbox{obtained}} \; {\mbox{were}}\;2.4\times {10}^{19},2.9\times {10}^{19},3.3\times {10}^{19}\), and \(3.8 \times {10}^{19}\) m-3 respectively. This confirmed a linear increase in \({\widetilde{{{\rm{n}}}}}_{{{\rm{e}}}}\) with RF power (Fig. 6D, SI Sec. 9).
Chirped pulses showed earlier deviations in Δϕ compared to supercontinuum pulses due to a higher β (1.22 compared to 0.64, respectively), making \({\widetilde{{{\rm{n}}}}}_{{{\rm{e}}}}\) extraction less reliable with chirped pulses. This indicates that Δω for chirped pulses is shorter (1.4 THz) than that of supercontinuum pulses (Δω > 2 THz). The broader Δω of supercontinuum pulses expands the bandwidth of the virtual low-pass filter, allowing more frequencies of the time domain THz waveform to pass through. This shifts the null frequencies to higher frequencies, preserving phase linearity and enabling \({\widetilde{{{\rm{n}}}}}_{{{\rm{e}}}}\) extraction over a wider range (Fig. 6C). This observation aligns with the experimental results in Fig. 2, which demonstrate measurement consistency as long as β remains unchanged.
In summary, this study establishes SETS as an effective solution to the limitations that are inherent in single-shot THz diagnostics that use spectral encoding. By addressing the chirp penalty using broadband supercontinuum pulses, SETS overcomes long-standing trade-offs between the spectral resolution and bandwidth of THz. Our findings demonstrate that SETS improves the fidelity of single-shot THz diagnostics and make it useful for quantitative measurements, extending the usable spectral bandwidth from 1.5 THz to over 2.2 THz while maintaining low δω. Using spectral encoding algorithm, these results were further extrapolated and generalized to a broader range of Tc (> 250 ps) and T0 (
SETS enables quantitative spectroscopy by minimizing null frequencies and reducing β, as demonstrated through experimental measurements and theoretical simulations. This advancement supports accurate and reliable measurements of the refractive properties of dynamic media. Additionally, SETS achieves rapid sub-picosecond measurement timescales, resolving dynamics at the laser repetition rate, making it suited for investigating non-repetitive and ultrafast events. We studied plasma as a dynamic medium and measured critical properties of its refractive index, such as ωp (or ne) and νen. The supercontinuum also enabled high-resolution absorption spectroscopy, which was previously not possible, to extract species number densities with desirable accuracy (i.e., depending on Tc). The ability to optimize T0 and Tc balances spectral resolution and phase linearity, enhancing measurement reliability over a wider frequency range. Although challenges remain, such as the plateau effect in \({\widetilde{{{\rm{n}}}}}_{{{\rm{e}}}}\) resolution at high \({\nu}_{{\mbox{en}}}\), this approach shows potential for advancing THz diagnostics and enabling deeper understanding of dynamic and refractive media, with applications extending to material science and fusion research.