The UK government and a wide range of commentators continue to claim that Brexit has had a large negative impact on UK economic performance. But while UK export growth in recent years has been sluggish it has been far from disastrous and the negative impact on GDP is likely to have been a fraction of 1%. A large part of the sluggishness of UK exports has been due to other factors including soaring energy costs, electric vehicle mandates and reduced re-exports of non-UK products.
It remains an article of faith among many UK commentators and politicians that Brexit has had a large negative impact on UK economic performance. The Office for Budget Responsibility continues to claim that the long-term cost will be 4% of GDP and similar estimates have come from some analysts using tortuously and opaquely constructed ‘counterfactuals’ of how UK trade and/or GDP might have developed in the absence of Brexit.
But these claims are increasingly difficult to square with the empirical evidence. It’s true that UK total export growth since 2018 (the best pre-Brexit comparison year as 2019 exports were inflated by firms shipping goods ahead of Brexit deadlines) has been sluggish (in constant prices). In the first quarter of 2025, the volume of UK exports of goods and services were only 5% higher than the average of 2018. But this is very far from a collapse and is actually better than German exports over the same period which were only 2% higher than in 2018 (see Chart 1).

Source: ONS, German Federal Statistical Office
UK export performance since 2018 has been greatly helped by a strong performance by services exports. After sizeable upward revisions, the data now show that in Q1 2025, the volume of services exports was 28% higher than the average of 2018. This has more than offset the relative weakness of goods exports. The strength of services trade also means that in Q1 2025, the UK’s economic ‘openness’ – the ratio of goods and services trade to GDP – was actually slightly higher than in 2018. This is important because the oft-parroted claims of the OBR rest on UK ‘openness’ being reduced by 15% – something which has just not happened.
Drawing strong conclusions about the impact of Brexit from the UK trade data is also made difficult by the fact that the data series is not consistent; Brexit created a structural break in the series in 2021 as the data is no longer collected in the same way. The ONS has made clear that there is no satisfactory way to correct for this.
A recent attempt to get round this problem is the study by Freeman et al. which tries to construct a consistent data set of individual firms. This paper yields some interesting and intuitively sensible results, including that Brexit had little effect on the exports of larger firms (supporting our view that post-Brexit trade barriers are more of a fixed cost than a variable one).
The headline result is that Brexit might have cut total UK goods exports by around 6% by 2022. This is quite a modest effect compared to the claims made in the run-up to the UK EU referendum. It equates to just 1% of 2022 UK GDP and the actual decline in GDP from a negative shock to goods exports of this size would be much smaller as the economy and policy settings adjusted (resources will shift between sectors, exchange rates and interest rates will also move). If we feed a negative shock to goods exports of this size into a standard macroeconomic model, we find that the decline in GDP relative to a no-Brexit baseline is around 0.3% in two years. This is a tiny fraction of the decline claimed by the OBR and others.
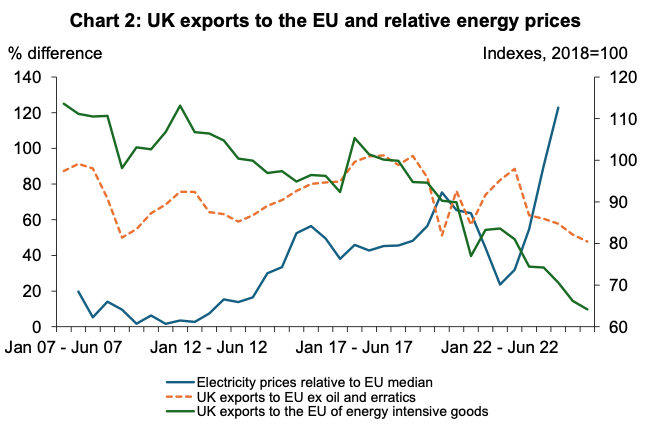
What about the years since 2022? UK goods exports to the EU have certainly performed poorly since then but there are other factors that explain this better than Brexit. In particular, we would draw attention to the massive negative supply shock created by UK industrial energy prices soaring above those in other advanced economies.

Source: ONS Note Electricity prices refer to left-hand scale and the two export indices to the RH scale
As far back as 2018, UK electricity prices for industry were already 40% above the EU median, after having been more or less in line with the median in 2012. And energy-intensive exports to the EU (chemicals and petrochemicals, rubber and plastics, metals, minerals and paper) were in decline. But since 2018, the premium over EU median electricity prices has soared from 40% to a massive 120% with a massive spike since 2022. It is hardly surprising that energy-intensive exports to the EU have slumped by more than a third since 2018 (Chart 2).
Indeed, the decline in energy-intensive exports has contributed 50% of the fall in UK exports to the EU since 2018. And crude oil exports, which have been falling for many years due to the run down of the industry – also nothing to do with Brexit – contributed an additional fifth (see Chart 3). Without the steep declines in these two sectors, the fall in UK goods exports to the EU would have been much lower at only around 5%.

Source: ONS
It could of course be a mere coincidence that energy-intensive exports to the EU have fallen so much – perhaps these were also the sectors that faced the biggest rises in trade barriers post-Brexit. But if so, it is surprising that these same sectors also suffered significant (sometimes larger) drops in exports to non-EU destinations too (see Chart 4). A much more likely explanation is that the steep rise in relative energy prices created a negative supply shock that cut exports of energy-intensive goods to all destinations.
Source: ONS

Even this is not the whole story, though, as there are other non-Brexit related factors to consider that have negatively impacted UK exports.
One of these is the weakness of the EU market. We have noted before that UK exports to the EU are closely correlated with eurozone industrial production given that many UK exports are intermediate products used in eurozone industries. Industrial production in the eurozone (excluding Ireland which distorts the figures) was 5.5% lower in March 2025 than in 2018.
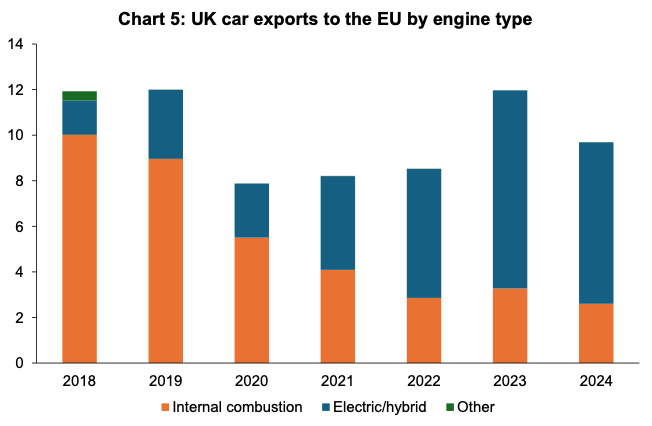
There are also other sectoral issues. One of these concerns car exports. This is a significant export sector for the UK but the industry has been turned upside down as a result of net zero-related electric vehicle mandates.
UK firms are being forced to shift to producing electric vehicles for which consumer demand is at best hesitant, and the effect of this is strikingly visible in the detailed (6-digit) trade data. From 2018-2024, exports to the EU of electric and hybrid cars rose by £5.6 billion but exports of cars with internal combustion engines and other cars slumped by £7.8bn for a net loss of £2.2 billion (Chart 5). Again, this is nothing much to do with Brexit and it is notable that UK car exports to non-EU countries have declined by a similar amount.
Source: ITC Trade Map

A final area worth mentioning is the end of re-exports to the EU from the UK of certain classes of products not produced in the UK. This is a Brexit effect but one whose impact on UK GDP is far lower than might first appear.
When the UK was in the EU customs union, certain kinds of products such as clothing and tropical fruit were imported into the UK and distributed to other EU countries. Outside the customs union this makes no sense, and recorded exports of these items from the UK have accordingly slumped. UK clothing and footwear exports to the EU are over 70% down on 2018 levels, a drop of £5.7 billion. Similarly, we have identified £2-3 billion of re-exports from other sectors such as food, textiles and leather that essentially ended in 2021.
Importantly though the real economic losses from 2018-2024 are far lower than these headline numbers suggest because only a small fraction of the ‘exported’ value in 2018 represented UK value-added – often it would have been little more than some packaging.
Overall we would make three key points:
- Total UK export growth since 2018, while sluggish, is not at all in line with the catastrophic pre-Brexit scenarios forecast by the Treasury and others nor does it square with the OBR’s continued claims that Brexit will cost 4% of UK GDP.
- It is likely that Brexit reduced exports to the EU to some extent, but the effect on GDP will have been small. We think the estimates for export declines in the recent article by Freeman et al are probably a little bit too large but even if we take them as correct, they imply a drop in GDP of only 0.3% by 2022 – a small change.
- The main blame for sluggish UK goods exports growth since 2021, and especially in 2023 and 2024 is a mixture of external shocks and policy own-goals. In particular, the massive rise in the cost of energy for UK firms relative to the EU median is hollowing out UK energy-intensive industry at a rapid rate. Some of this rise represents the UK energy mix but much is due to policy decisions. Policy decisions are also accelerating the decline of the oil industry and have undermined the car industry too. Observers bemoaning the sluggish performance of UK exports should look away from Brexit and concentrate on domestic policy failures.
Related

