NPS of attosecond pulses
Figure 1 shows the basic concepts for the generation (Fig. 1a) and characterization (Fig. 1b) of attosecond waveforms in the NIR and UV spectral regions. First, we launch pulses with peak power P0 and duration τ0 of a single optical cycle into a hollow-core waveguide filled with helium and tune the pressure such that the dispersion β2
$$N=\sqrt{\frac{{{\gamma }}{P}_{0}{{{\tau }}}_{0}^{2}}{\left|{{{\beta }}}_{2}\right|}} > 1,$$
(1)
with γ being the nonlinear parameter of the fibre \(\gamma \approx \frac{4\uppi }{\lambda }\frac{{\rho n}_{2}}{3{a}^{2}}\) (ref. 27). There, ρ is the ratio of gas density to that of standard conditions, n2 is the Kerr nonlinear refractive index under those conditions, and a is the hollow-core radius of the fibre. The interplay of self-phase modulation-induced spectral broadening and anomalous dispersion (due to the negative β2) leads to soliton self-compression, followed by pulse break-up and the emission of RDWs once the pulses reach their minimum supported duration26. The emission wavelength depends on the zero-dispersion wavelength, and by adjusting the helium pressure, we continuously tune the phase-matching to RDWs in the spectral region between 200 nm and 270 nm (refs. 27,36,37,38).
Fig. 1: Generation and detection of a self-compressed attosecond soliton and dispersive wave.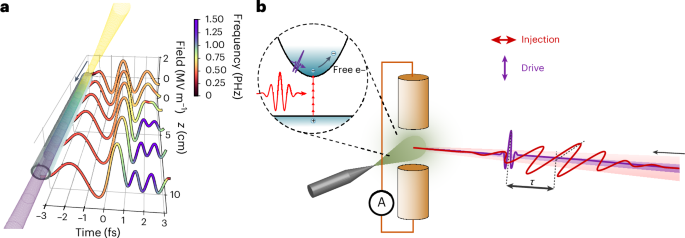
a, The simulated evolution of the electric field transient as it propagates along the hollow-core waveguide filled with helium gas. The colour scale shows the instantaneous frequency of the field, with the emergence of the RDW shown in purple. The dynamics of soliton self-compression and RDW emission are different in their modification of adjacent half-cycles of the field, enhancing and shortening the primary half-cycle of the waveform. b, The measurement scheme for NPS of the generated DUV RDW emission and solitons. The injection and drive pulses are colinearly focused into a gas jet. The injection pulse ionizes the gas via nonlinear photon absorption, while the DUV drive pulse accelerates the free charges. The electrodes detect the generated current.
These waveforms are directly delivered into a vacuum chamber with decreasing pressure along the fibre and without any transmissive optical elements, to avoid introducing dispersion and thus preserve their duration31. To illustrate the process, in Fig. 1a, we show the simulated evolution of the electric field along the fibre. As the single-cycle pulse propagates, the typical action of self-phase modulation results in a redshift of the rising edge and blueshift of the falling edge. Simultaneously, the resulting positive chirp is compensated by the negative group delay dispersion of the waveguide mode, while the field dependence of the group delay causes a steepening of the carrier trailing edge. Thereby, the soliton dynamics reshape the field, cycle by cycle, resulting in the formation of an attosecond transient followed by the emission of an RDW after ~8 cm. The self-steepening of the carrier wave is not as extreme as in the mid-infrared39,40; the effect, however, is crucial to achieving fields of few-hundred attosecond duration and to enhancing the conversion efficiency of the RDW.
In the time domain, the resulting electric field is the superposition of the soliton and the RDW it emitted: the two combine to produce a short electric field transient. Without additional filtering, this transient is the result of the soliton dynamics.
We measure the electric-field transient using NPS. In this method, the drive field accelerates charges that have been rapidly injected by an ultrashort gate pulse, producing an optically driven current approximately proportional to the drive field’s vector potential at the moment of injection. Measurements with this technique have been conducted in various materials, including dielectrics41, nano-antennas25 and gases42. Here, we use strong ultrashort VIS–NIR laser pulses (injection) to free electrons in argon via high-order nonlinear absorption, which are accelerated by the field under study (the drive field), resulting in an asymmetry of the charge distribution to be detected by the electrodes, as shown in Fig. 1b.
After the waveguide, the orthogonally polarized injection and drive pulses (the fibre output) are combined using a perforated mirror and focused collinearly onto an argon jet, as shown schematically in Fig. 2. Two electrodes measure the induced current as a function of the delay between the two waveforms. The strong nonlinearity of the absorption of the injection pulse confines the injection of charge carriers to a duration of hundreds of attoseconds, and the resulting temporal gate allows waveform sampling of the drive with a comparable resolution. It has been shown that the measured electric current Idrift(τ) maps the vector potential of the drive pulse convolved with a gating function G(t). In the frequency domain, we can approximate the signal at low pressures as43
Fig. 2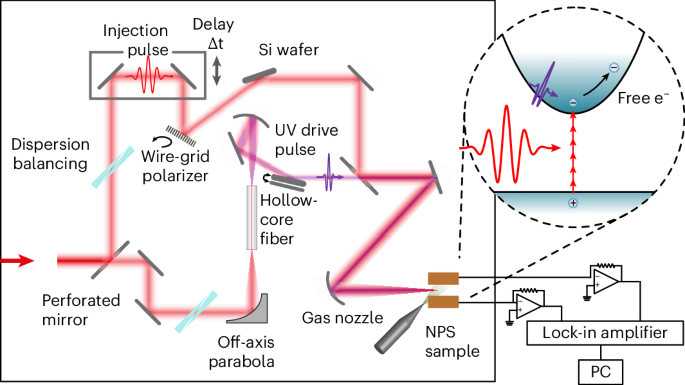
Measurement set-up for the soliton and RDW generation and characterization via NPS.
$${I}_{{\rm{drift}}}\left({\rm{\omega }}\right)=\frac{{e}^{2}{N}_{{{\mathrm{at}}}}}{{m}_{{\mathrm{e}}}}{A}_{x}\left({\rm{\omega }}\right){G}^{*}({\rm{\omega }}),$$
(2)
where Nat is the concentration of atoms, e > 0 is the elementary charge and me is the mass of the electron. The vector potential of the probe field is Ax(t), and, in the frequency domain, its electric field is \({\widetilde{E}}_{x}\left(\omega \right)=i\omega { \tilde{\rm{A}} }_{x}\left(\omega \right)\). The spectral response function \({G}^{*}({\rm{\omega}})\) is the complex conjugate of G(ω), the Fourier transform of G(t). In Fig. 3, we show the HCF output electric fields obtained by deconvolving the recorded delay-dependent signal with the response function G(t), calculated by solving the time-dependent Schrödinger equation numerically with the tRecX code44 in the single-active-electron approximation. In the simplest, classical rate-equation-based interpretation of the formation of the current, the response function would be the ionization rate of the gas, but the more general response function used here is modified by electronic coherence and the influence of the ionic Coulomb potential43.
Fig. 3: Measured electric field of self-compressed soliton and RDW.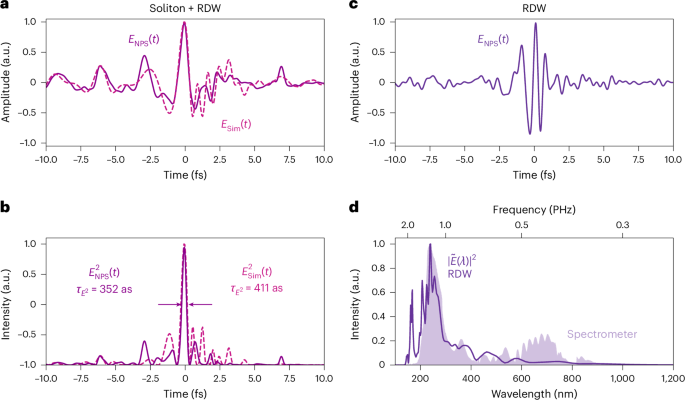
a, The measured and simulated electric field of the soliton plus RDW for optimal CEP. b, The intensity representation of the fields shown in a highlights the short pulse duration of the generated ~350 as light transient (E2). The intensity envelope is 0.83 fs. c, The electric field of the Si-wafer filtered pulse, with E2 FWHM of 0.9 fs and intensity envelope of 1.39 fs. d, The Fourier transform (squared amplitude and spectral phase) of the Si-wafer filtered pulse versus the wavelength, together with the spectrum measured with a calibrated UV spectrometer, clearly showing the RDW around 235 nm. The spectral range reaches from 150 nm (2 PHz) to approximately 1,100 nm (0.27 PHz).
We filled the input end of the fibre with 10 bar of helium to obtain soliton order N ≈ 1.9 and set the RDW phase-matching at wavelengths around 240 nm (Methods). As the fibre output lies in vacuum, the transients propagate without any major dispersion-induced temporal stretching until reaching the argon target. The extremely broad bandwidth of our argon-based NPS allows the transient to be recorded in a single measurement, although the frequencies of the underlying soliton and RDW are separated by almost 1 PHz. In this fashion and by optimizing the carrier-envelope offset phase (CEP), we can tune the input pulse to get the shortest transients.
In Fig. 3a, the measured electric field is compared with the simulated field. Experimentally, we achieve a pulse duration as short as 352 as at FWHM for the squared electric field (and 0.83 fs when considering the intensity envelope as defined in the Methods) in the optical domain (Fig. 3b). In the simulations, the duration of the squared field is 411 as. The measured electric field features low frequencies on the leading edge and higher frequencies on the trailing edge corresponding to the RDW. In the frequency domain, the overall bandwidth exceeds 1 PHz, with the RDW manifesting as an isolated peak centred around 230 nm.
It is also useful to isolate the UV pulse without substantially altering its spectral phase. Using a silicon wafer placed at Brewster’s angle for 800 nm (~74°), we can suppress the long wavelengths, isolating the RDW and thus measuring the UV waveform with reduced intensity. The resulting field of the filtered light corrected by its gating function is shown in Fig. 3c. The FWHM duration of the resulting real squared field is ~0.90 fs and ~1.39 fs when considering the FWHM intensity envelope. The corresponding spectrum is in agreement with the one independently measured by an amplitude-calibrated spectrometer, as shown in Fig. 3d. In both measurements, the soliton tail (the wavelengths longer than ~350 nm) is not fully suppressed, and in the NPS measurement, these spectral components exhibit a larger amplitude. We attribute this to unaccounted spatial averaging at the focal spot.
By changing the pressure of helium at the fibre input, we can continuously shift the RDW phase-matching wavelength and generate few-cycle UV pulses at shorter wavelengths. In Fig. 4, we show the spectra and the waveforms measured after the fibre when varying the pressure from 10 bar to 6 bar (Fig. 4a), together with the corresponding numerical simulations (Fig. 4b). As we decrease the pressure, the RDW shifts to shorter wavelengths, and with 6 bar, we generate radiation at around 200 nm. However, as we do not change the input energy, also the soliton order decreases, resulting in a lower conversion efficiency to the higher-frequency UV. In Fig. 4c, we show the waveforms measured with NPS for each He-filling pressure, showing the different electric fields after interacting in the fibre with the different amounts of gas. Because the CEP was not optimized for these measurements, the field is not necessarily the shortest transient. However, the overview clearly shows the dynamics, letting the RDW evolve. The change in spectrum, acquired via Fourier transformation of the NPS field, is shown in Fig. 4d.
Fig. 4: Pressure tuning of the emitted transient.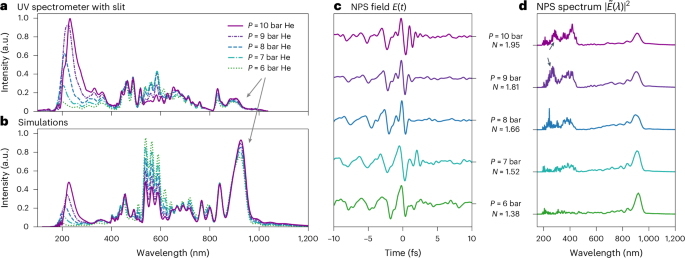
a,b, The pressure at the entrance of the HCF was varied from 6 to 10 bar experimentally measured with an UV spectrometer (a) and in the simulations (b). Typically, the peak of the RDWs experiences a shift in wavelength. It moves towards lower wavelengths with lower pressures. Keeping the input intensity constant, the RDW gets weaker with lower pressures. c,d, The NPS measurements show the electric field for the different pressures (c) and the corresponding spectra, derived via Fourier transformation (d).
Nonlinear processes induced by attosecond DUV pulses
In the measurements above, the attosecond field transient’s contribution to the measured signal was linear, as only its temporal structure was examined. However, its energy content is sufficient to also perform the role of an attosecond pump pulse, allowing strong-field NIR-DUV experiments with high temporal resolution. As a proof of principle, we changed the configuration shown in Fig. 1 to use the pulses for their opposite tasks.
When the pulse intensities are reversed, such that the DUV beam is now much stronger compared with the NIR beam, and the electrodes are rotated by 90°, the two pulses exchange roles (Figs. 2 and 5d). Now, the DUV pulse acts as an ultrashort injection, delivering the gate for the field sampling. The electrodes are now aligned with the polarization of the NIR beam, hence acting as a drive field. In argon, single-photon ionization requires wavelengths shorter than 79 nm. Hence, the photoionization of argon by the RDW is at least a two-photon or three-photon process. As we can detect a current, we show that the DUV–NIR pulse is nonlinearly absorbed by the argon, leading to free electrons. The derived electric field and the corresponding spectrum are shown in Fig. 5e,f. To compare this measurement with the standard configuration, the fibre was removed, and the fibre input (VIS–NIR) was measured (Fig. 5a–c). As the two interferometer arms are separated by a perforated mirror, the spectrum shown in Fig. 5c, measured in the standard configuration, differs from the reversed configuration owing to spatial differences, which was confirmed by a spectrometer measurement. In time, the pulses are comparable, proving that the attosecond transient can be utilized as a nonlinear pump pulse.
Fig. 5: Ionization gate triggered by attosecond soliton.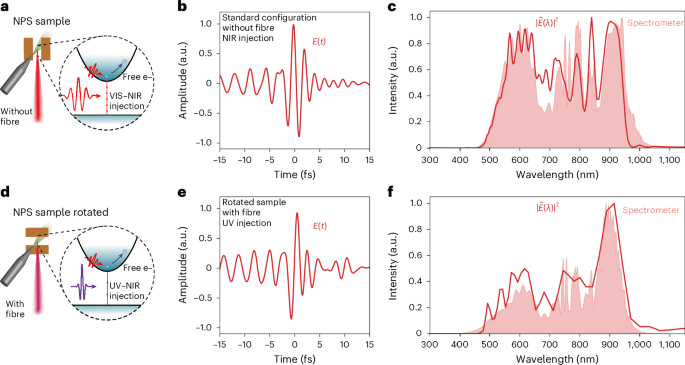
a, A typical NPS measurement configuration without soliton generation when the fibre is removed. b, The measured electric field of the VIS–NIR pulse that is usually used as fibre input with an intensity envelope FWHM of 2.9 fs. c, The Fourier transform of the field shown in b together with the spectrum measured with a spectrometer. d, The reversed measurement configuration with fibre and rotated NPS sample to use the attosecond DUV–NIR beam as the injection pulse and the NIR beam as the drive. The DUV–NIR beam is strong enough to ionize argon via a two-photon or three-photon transition assuming the DUV drive contains the same measured photon energies as presented above. The FWHM pulse duration of the intensity envelope is 2.1 fs. e,f, The electric field measured in the reversed configuration (e) and its spectrum (f).