An overview of the study design and analysis is provided in Fig. 1. Demographic and clinical characteristics of study participants from The Cancer Genome Atlas (TCGA) stratified by availablity of genotyping and radiomic data is provided in Table 1. The median age of included cases was 52 years, with more males (58.5%) than females (41.5%). Overall, we included 384 subjects diagnosed with IDH-wildtype glioma and 384 with IDH-mutant glioma.
Fig. 1: Overview of the study design.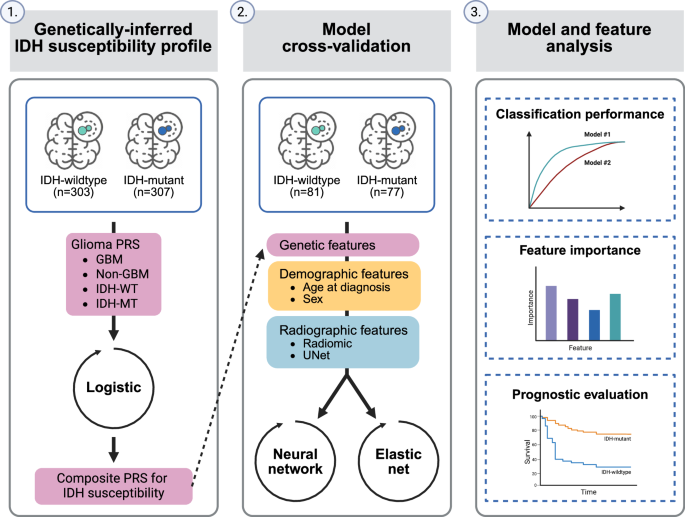
Abbreviations: PRS polygenic risk score, GBM glioblastoma, IDH-WT IDH-wildtype, IDH-MT IDH-mutant.
Table 1 Characteristics of glioma cases in The Cancer Genome Atlas (TCGA)Evaluation of multimodal IDH classifiers
An elastic net was used to classify glioma cases according to IDH mutation status in the subset of 158 cases with both radiomic and germline genetic information. In elastic net models limited to features of a single class (i.e., demographic [age and sex], genetic or radiographic), we found that the radiomics-based model was the most predictive for IDH status classification (Table 2, Supplementary Fig. 1). Radiomic features yielded the highest mean area under the receiver operating characteristic curve (AUC) of 0.83 (95% confidence interval [CI]: 0.79–0.86), followed by the demographics-only model (0.76, 95% CI: 0.74–0.77), the UNet-based autoencoder (UNET) model (0.72, 95% CI: 0.64–0.78) and the composite PRS model (0.68, 95% CI: 0.66–0.70). Radiomic features also exhibited improved accuracy (0.80), precision (0.82) and recall (0.77) compared to the other single-class models.
Table 2 Classification performance of models for IDH mutation status
Combining germline genetic, demographic, and radiographic features improved classification of IDH status compared to each class of predictors alone (Table 2, Supplementary Fig. 2). PRS and radiomic features had significantly improved performance compared to radiomics alone, with a mean AUC of 0.88 (95% CI: 0.84–0.90, PΔAUC = 6.9 × 10⁻⁵). Classification of IDH status was further improved by adding age at diagnosis and sex (AUC = 0.91, 95% CI: 0.88–0.93). Overall, the model that included age, sex, radiomic features, and PRS achieved the highest mean AUC (0.93, 95% CI: 0.89–0.95), accuracy (0.86), precision (0.87) and recall (0.84) (Fig. 2A). Although performance was attenuated using UNET features compared to radiomic features, we found that incorporating PRS and demographic information increased the mean AUC from 0.72 (95% CI: 0.64–0.78) to 0.82 (95% CI: 0.76–0.86, PΔAUC = 7.3 × 10⁻⁹) (Table 2, Fig. 2B).
Fig. 2: Distribution of AUC for classification of IDH mutation status from repeated nested cross-validation.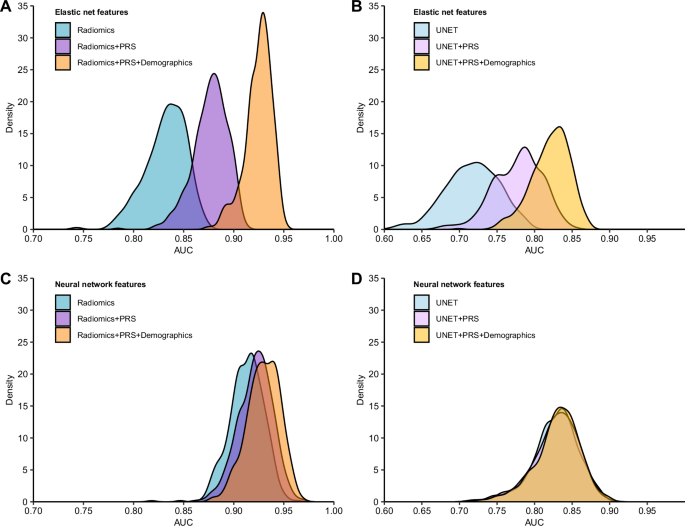
AUC estimates from 500 random iterations of nested cross-validation were obtained from IDH classification models using different combinations of features and model architectures. A, C Models that included radiomic features that were trained with an elastic net and a neural network, respectively. B, D Models that included UNet-based autoencoder (UNET) features that were trained with an elastic net and a neural network, respectively. Demographic factors include age at diagnosis and sex. Genetic factors are captured by the composite polygenic risk score (PRS).
In sensitivity analyses using radiomic features that were not adjusted for confounding factors such as age, sex and brain volume, we found that multimodal classifiers that integrated demographic information and PRS with radiomic features showed the best performance (Supplementary Fig. 3, Supplementary Table 1). Compared to the radiomics-only model (AUC = 0.89, 95% CI: 0.88–0.90), the combined radiomics and PRS model (AUC = 0.92, 95% CI: 0.89–0.94, PΔAUC = 6.6 × 10⁻⁵) and the full integrated model (AUC = 0.93, 95% 95% CI: 0.90–0.94, PΔAUC = 1.2 × 10⁻⁶) showed significantly improved performance.
Next, we evaluated multimodal classifiers for IDH status trained using a neural network architecture that accommodates more complex, non-linear interactions between predictors (Table 2). Combining PRS with radiomic features did not produce an appreciable increase in mean AUC (0.92, 95% CI: 0.88–0.95) relative to the radiomics-only model (AUC = 0.91, 95% CI: 0.88–0.94). However, the integration of all three data modalities demonstrated a modestly higher mean AUC of 0.93 (95% CI: 0.90–0.96, PΔAUC = 0.043) compared to radiomics alone (Fig. 2C). The integration of genetic and demographic information with UNET features in a neural network model did not alter classification performance (AUC = 0.83, Fig. 2D).
Feature importance
Next, we sought to gain more insight into factors contributing to model performance by examining feature weights across all predictors in the elastic net model. Overall, 40 out of the 256 features had non-zero cumulative weights in >50% of the 500 random iterations of nested cross-validation (CV) (Fig. 3A). Of those 40 features, 11 were predictive of IDH mutation status in all 500 iterations: age at diagnosis, the composite PRS, the ratio of the enhancing tumor (ET) volume to whole tumor (WT) volume, the percentage of the tumor core (TC) in the frontal lobe, the ratio of the non-enhancing tumor (NET) volume to the WT volume, the ratio of the ET to the TC volume, the ratio of the NET volume to the TC volume and several metrics of the heterogeneity of the NET (Fig. 3B). Compared to IDH-wildtype tumors, IDH-mutant tumors were generally diagnosed at an earlier age, had minimal areas of enhancement and more often developed in the frontal lobe (Fig. 3B).
Fig. 3: Predictive features for IDH status classification.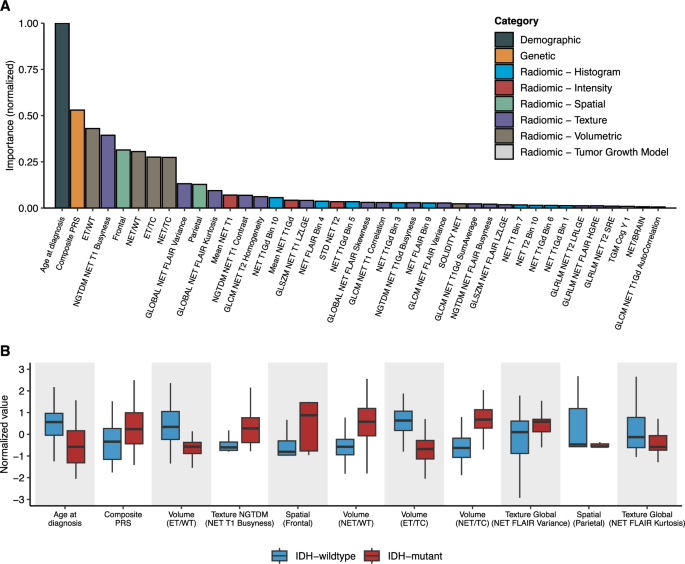
A Mean cumulative value of feature weight in the full integrated elastic net model across the 500 random iterations of nested cross-validation. Feature weights are normalized by the maximum value. Features with non-zero cumulative weights in >50% of the 500 random iterations are shown. B Distribution of the predictive features stratified by tumor subtype. Features were defined as predictive if the cumulative weight was non-zero across all 500 random iterations of nested cross-validation. Features are ordered (from left to right) in decreasing importance. Abbreviations: NET non-enhancing tumor, WT whole tumor, TC tumor core, ET enhancing tumor, GLCM gray-level co-occurrence matrix, GLSZM gray-level size zone matrix, GLRLM gray-level run-length matrix, SZLGE small zone low gray-level emphasis, SRE short run emphasis, NGTDM neighborhood gray-tone difference matrix, STD standard deviation, TGM tumor growth model.
Multimodal IDH classifier predicts mortality
To evaluate the potential utility of our multimodal IDH classifier, we compared its association with mortality to ground-truth labels based on confirmed IDH status. Median survival time for patients predicted to have IDH-mutant (87.4 months) vs. IDH-wildtype tumors (14.7 months) was similar in magnitude to the survival differences observed based on biopsy-confirmed IDH mutation status (87.4 months vs. 14.1 months) (Fig. 4A). The difference in median survival between predicted IDH-mutant and predicted IDH-wildtype was 72.7 months (P = 6.8 × 10⁻¹¹) (Fig. 4B). Associations with mortality for predicted IDH-mutant status remained robust in multivariable Cox models adjusted for genetic ancestry principal components (PCs) and demographic information (HR = 0.18, 95% CI: 0.08–0.40, P = 2.1 × 10⁻⁵) (Table 3).
Fig. 4: Overall survival for adult glioma cases with predicted or biopsy-confirmed IDH mutation status.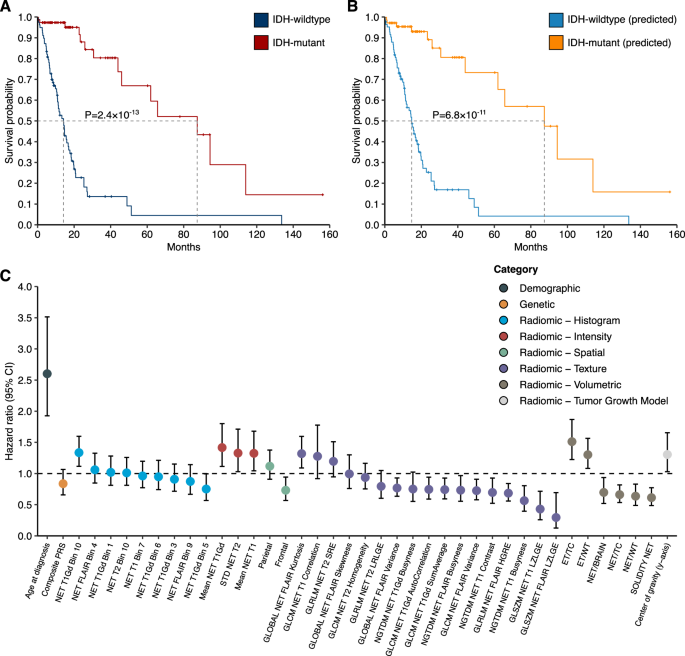
A, B Percent survival distributions for adults with glioma stratified by predicted or biopsy-confirmed IDH mutation status. Differences in event time distributions were assessed using the log rank test. A IDH mutation status confirmed by molecular profiling of tumor samples. B IDH mutation status predicted based on integrated elastic net model (“predicted”). C Features used for IDH status classification are examined for association with overall survival using univariate Cox proportional hazards regression. Hazard ratio (HR) and 95% confidence interval (CI) for each feature are presented. Abbreviations: NET non-enhancing tumor, WT whole tumor, TC tumor core, ET enhancing tumor, GLCM gray-level co-occurrence matrix, GLSZM gray-level size zone matrix, GLRLM gray-level run-length matrix, SZLGE small zone low gray-level emphasis, SRE short run emphasis, NGTDM neighborhood gray-tone difference matrix, STD standard deviation.
Table 3 Association between IDH mutation status and survival among glioma cases
When considering individual predictors, of the 40 features that had non-zero cumulative weights in >50% of the 500 random iterations of the integrated elastic net classifier, age at diagnosis and 24 radiomic features were associated with all-cause mortality at P 4C, Supplementary Table 2). The composite PRS predictor was not strongly predictive of mortality (HR = 0.84, 95% CI: 0.66–1.07). Prognostic radiomic features were primarily related to characteristics of the ET and NET regions. For instance, higher relative enhancing tumor volume (i.e., ET/TC) was associated with a 51% increase in overall mortality risk (HR = 1.51, 95% CI: 1.22–1.87, P = 1.3 × 10⁻⁴), while tumors with greater solidity of the NET had lower mortality risk (HR = 0.61, 95% CI: 0.49–0.77, P = 3.3 × 10⁻⁵).