Compliance to WHO PM2.5 interim and limit values
The analysis has been performed for the bias-corrected simulated annual mean PM2.5 surface concentrations (see Methods Section “Bias correction”) to alleviate the impact of models underestimating surface PM2.5 concentrations by -4% to -57%, with a bias of -24% for the multi-model mean (MMM; Table 1). As the bias correction has been done using monthly observed PM2.5 values (see Methods Section “Model evaluation”), we have not performed analyses on the 99th percentile of the daily mean PM2.5 concentrations. Fig. 1 shows the surface PM2.5 concentrations over continental Europe as simulated by the MMM under the different scenarios, after bias-correction. Surface PM2.5 concentrations decrease from 2015 to 2050 in all three scenarios, by 47%, 26%, and 13% under SSP1-2.6, SSP2-4.5, and SSP3-7.0, respectively. The largest decreases are projected to take place over central Europe, in particular under SSP1-2.6 (Fig. 2, upper panel). However, as seen in Fig. 1, SSP1-2.6 is the only scenario where the mean surface PM2.5 concentration approaches the 5 µg m−3 WHO target value, only after 2040, and only according to some models.
Fig. 1: Bias-corrected surface PM2.5 concentrations as predicted by the ensemble mean in 2015–2050 over continental Europe under different emission scenarios (solid lines of the corresponding color).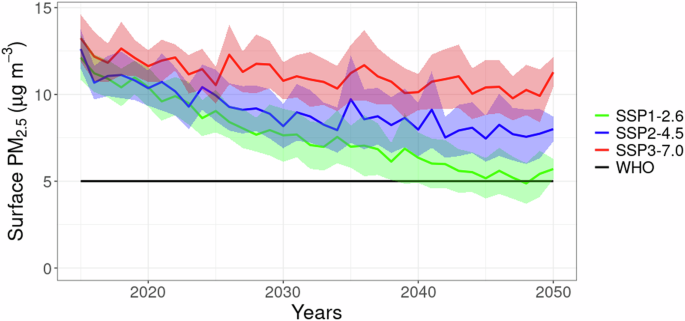
The black line shows the WHO guidelines target value of 5 µg m−3. Shaded ranges show the standard deviation between the individual models.
Fig. 2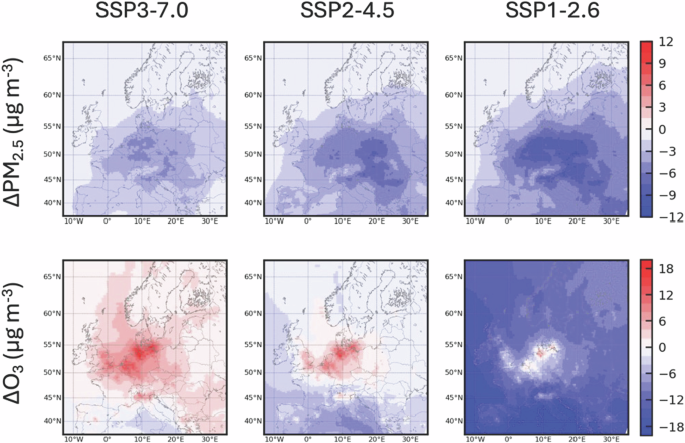
PM2.5 (upper panel) and O3 (lower panel) surface concentrations in 2050 with respect to 2015 under different emissions scenarios: SSP3-7.0 (left panel), SSP2-4.5 (middle panel), and SSP1-2.6 (right panel).
Table 1 Mean bias (MB), root mean square error (RMSE), normalized mean bias (NMB), fractional gross error (FGE), Pearson correlation (r), and the regression coefficient (r2) for simulated daily maximum 8-hour moving average O3 concentration (DMAX8hrO3) and annual mean PM2.5 concentrations against EBAS measurements in the 1980–2014 period for each model and their ensemble mean
Figure 3 shows if and when the future surface PM2.5 concentrations in the individual EU countries are projected to comply with the WHO guidelines under the different emission scenarios, based on the MMM. As seen in the figure, the majority of the EU countries are projected to not fulfill the WHO target value of 5 µg m−3 for PM2.5. According to the MMM, 19 countries, mainly western and northern countries will comply with the WHO target level under the SSP1-2.6 scenario, and majority only after 2030 or 2040. Few countries in Scandinavia (Finland, Norway, and Sweden) also comply in the SSP2-4.5 and SSP3-7.0 scenarios, already during present-day.
Fig. 3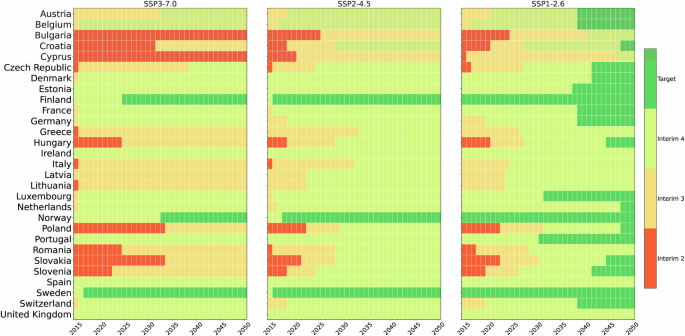
WHO interim and target values for surface PM2.5 and the compliance across European countries under SSP1-2.6 (right panel), SSP2-4.5 (middle panel), and SSP3-7.0 (left panel).
Compliance to the interim values (Fig. 3) is easier. The first interim value of 35 µg m−3 is complied with in all EU countries and is therefore not shown in Fig. 3. All EU countries would have already complied with the interim target 3 (15 µg m−3) if the developments during 2015–2024 would follow SSP1-2.6 or SSP2-4.5, and only two countries (Bulgaria and Cyprus) would not comply under SSP3-7.0. Similarly, all EU countries either already or will comply with interim target 4 (10 µg m−3) under SSP1-2.6, the majority before 2025, while Bulgaria and Cyprus will not comply in SSP2-4.5. Under SSP3-7.0, the majority of countries complies with the interim target 4, while 12 countries will fail reaching 10 µg m−3. Overall, results show that compliance to WHO target and interim values for PM2.5 will mainly be possible after 2040, and mostly in the western and northern Europe.
Contribution of natural sources to PM2.5 concentrations
Two of the models from our ensemble, SILAM and WRF-Chem, have the natural emission of mineral dust aerosols calculated online (see Methods Section “Air Pollution Downscaling”). Current version of the DEHM model has natural mineral dust from the boundaries only and has no natural mineral dust emissions. Although all three models have online-calculated sea-salt aerosols, due to missing natural mineral dust emissions in the DEHM model, we estimated the contribution of natural aerosols (mineral dust and sea-salt) only with the SILAM and WRF-Chem models.
Contribution of mineral dust and sea-salt to domain-mean PM2.5 mass accounts for around 27% in SILAM (Fig. 4: top left panel) and around 37% in WRF-Chem (Fig. 4: top right panel) in the present day. The contributions in 2015 over the continental Europe are upwards of 20% in SILAM, largest around the coastal areas in the north and western regions due to sea-salt aerosols, and in the Mediterranean also due to mineral dust (Fig. 4, lower left panel). Same pattern is modeled by the WRF-Chem model (Fig. 4, lower right panel), however with the contributions up to 50%, particularly over Scandinavia and the northwestern coast. Differences are linked to the different dust and sea-salt parameterizations in the two models (see Methods Section “Air Pollution Downscaling”). These contributions are comparable with available literature, reporting up to 16% natural contribution in southern Europe18,19. Gu et al.20 attributed up to 20% of PM2.5-related premature mortality in Europe during 2005–2015 to natural sources. Im et al.21 estimated more than 30% of sea-salt contribution to surface PM2.5 in the Nordic region. Both models predict that the relative contribution due to natural sources increases in the future, and the rate of increase depends on how significantly the anthropogenic PM2.5 is mitigated; SSP1-2.6 leads to the largest increase in the natural contribution while SSP3-7.0 leads to the smallest increase. This large contribution, which can be spatially up to 50% in SILAM and 70% in WRF-Chem, shows the challenge in parts of Europe to reach the WHO target value of 5 µg m−3 in the future. This contribution can grow even larger if other natural contributions, such as biogenic secondary organic aerosols, are singled out from secondary aerosols. Figure 4 also shows that in 2015, surface PM2.5 concentrations over the continental Europe, except for northern Scandinavia, are above 5 µg m−3. Regions with PM2.5 concentrations above 5 µg m−3 decrease in the future, largest in the SSP1-2.6 scenario (Fig. S4). The exceedances remain in all scenarios over regions, which are largely affected by natural PM2.5; in particular over the coastal areas, as well as over southern Europe, which is largely affected by dust transport.
Fig. 4: Primary natural (mineral dust and sea-salt) contribution (%) to domain-mean PM2.5 mass over Europe in SILAM (upper left panel) and WRF-Chem (upper right panel) under different SSP scenarios (shaded areas represent the spatial variability).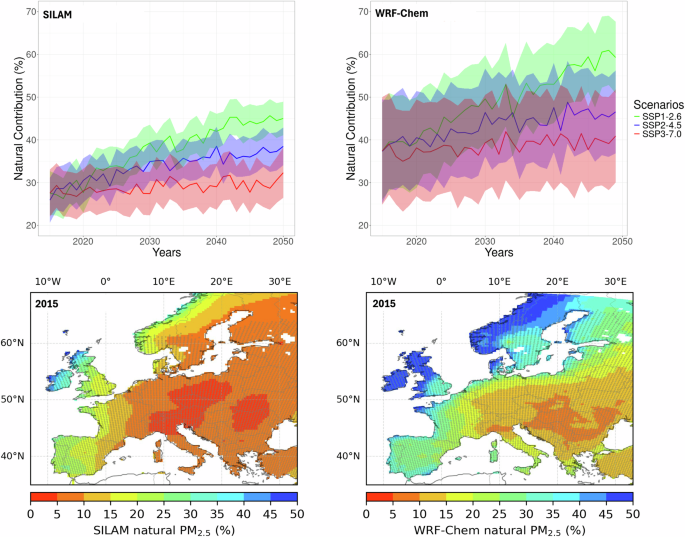
Lower panels show 2015 annual mean of the dust + sea-salt contribution (%) to PM2.5 under SSP2-4.5 scenario for SILAM (left) and WRF-Chem (right). The dot-shaded regions are where PM2.5 concentrations are above 5 µg m−3.
Compliance to WHO O3 interim and limit values
Peak season DMAX8hrO3 averaged over the EU countries as simulated by the MMM are presented in Fig. 5, along with the WHO target value of 60 µg m−3. The bias correction is not applied over the simulated O3 concentrations, as the normalized mean bias (NMB) is only about 6% for the MMM [-1% to 13% across the models] (Table 1). Fig. 5 (top) shows that the peak seasonal DMAX8hrO3 projections change slightly within the simulation period, with interannual variability often exceeding the systematic trends. Under SSP1-2.6, the peak season concentrations decrease by 17 µg m−3 (-20%) from 90 µg m−3 in 2015-2025 to 72 µg m−3 in 2041-2050, while under SSP2-4.5, the decrease is 4 µg m−3 (-3%). On the other hand, under SSP3-7.0, there is a slight increase of 2 µg m−3 (+2%). Under SSP1-2.6, where there is an overall decrease across the domain, O3 concentrations increase slightly over the Benelux region and Po valley, which are the known hot spots (Fig. 2, lower panel). The largest increases are projected to take place over central Europe under SSP2-4.5, and over most of the study domain under SSP3-7.0. EU countries on average are not projected to comply with the WHO guideline target value of 60 µg m−3 by 2050 under any of the emission scenarios. On the other hand, the first interim target of 100 µg m−3 can be achieved after 2035.
Fig. 5: Top panel: Peak season surface daily maximum 8 h O3 (DMAX8hrO3); bottom panel: annual 99th percentile of DMAX8hrO3 concentrations as simulated by the ensemble mean in 2015–2050, averaged over EU member countries under different emission scenarios.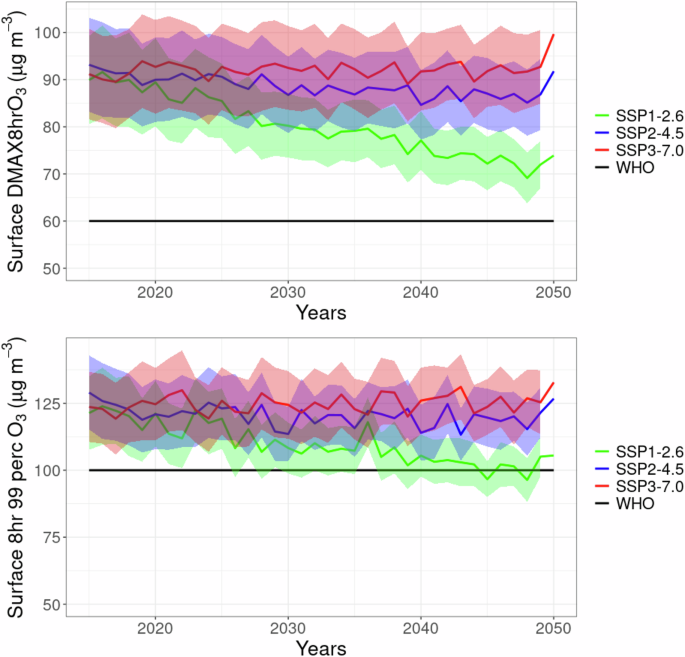
The black lines show the WHO guidelines target values of 60 µg m−3 and 100 µg m−3, respectively. Shaded areas show the standard deviation between the individual models.
While the models suggest that achieving the peak seasonal target value for long-term exposure to O3 will not be possible by 2050, the annual 99th percentile target value of 100 µg m−3 (short-term exposure) might be achieved by some countries under the SSP1-2.6 scenario, according to some models (Fig. 5 bottom).
Compliance with the WHO guidelines in the individual EU countries are presented in Fig. 6. As seen in the figure, the ensemble-mean projects no compliance to the target long-term exposure value of 60 µg m−3 among the EU countries under any of the emission scenarios, with only 9 countries projected to reach the target after 2040 under the minimum model simulations. On the other hand, the interim 1 value of 100 µg m−3 is achieved in SSP2-4.5 in all countries. The interim 2 value of 70 µg m−3 is achieved in 21 countries in SSP1-2.6, and in 15 western and northern European countries in SSP2-4.5. On the other hand, Finland and Sweden will be able to comply with the short-term exposure value of 100 µg m−3 under SSP2-4.5, while more than half of the countries will comply with this threshold under the SSP1-2.6 scenario. These results imply that the short term O3 exposure (8-hour) can be mitigated by emission reductions, particularly with ambitious reductions, whereas the long-term exposure will be more challenging for Europe. Particularly under the worst case scenario (SSP3-7.0), compliance to the new WHO target, and interim values are not possible in any European country. Similar to the compliance to PM2.5, meeting the O3 target and interim values will be particularly challenging in southern European countries due to much higher O3 levels because of higher photochemical activity, UV radiation, and precursor sources22.
Fig. 6: WHO guidelines interim and target values (color coded) for long-term exposure (top panel) and short-term exposure (bottom panel) to O3 concentrations along with the compliance across the EU member countries under SSP1-2.6 (right panel), SSP2-4.5 (middle panel), and SSP3-7.0 (left panel).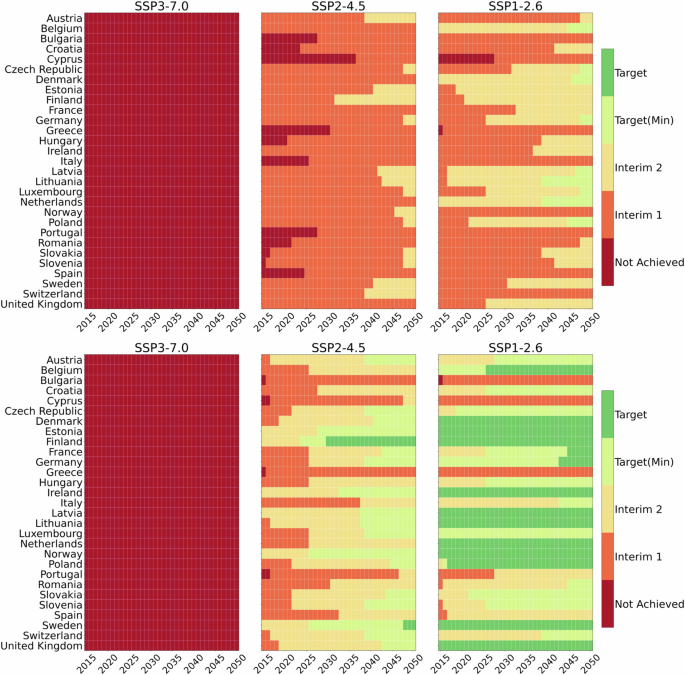
Target (Min) is based on the minimum values from three models, and all the rest are based on the MMM.
In conclusion, complying with the new WHO air quality guidelines for PM2.5 and O3 will be challenging for several European countries in the near-term future until 2050. Our multi-model ensemble of state-of-the-art regional atmospheric chemistry-transport models, using several emission scenarios, and bias-correction for PM2.5, shows that it requires ambitious emission mitigations (e.g. SSP1-2.6) to achieve the WHO target value. Under moderate mitigation scenarios (e.g. SSP2-4.5), only a few countries, and mainly only after the 2030 s, can comply with the PM2.5 target value. This challenge is partly associated with the fact that the natural contribution from mineral dust and sea-salt can comprise up to 70% of the PM2.5, which cannot be mitigated. It should be noted that while there are indications from epidemiological and experimental studies that desert dust can aggravate respiratory and potentially also cardiovascular health, its effects may differ in magnitude and mechanism from those of urban PM2.523,24. Our analyses show that the O3 target value is practically unreachable before 2050.