Which London boroughs have higher levels of poverty? How does the picture of inequality differ across boroughs?
One in four Londoners are in poverty. This makes London the city with the highest poverty levels in England.
But even within the city, there is huge inequality – some of the wealthiest parts of the country, alongside some of the poorest.
Working out poverty rates for individual boroughs is difficult, because of small sample sizes. This means that exact individual poverty rates for boroughs are difficult to pinpoint.
But what we can say with more certainty is which boroughs have broadly higher – and lower – levels of poverty.
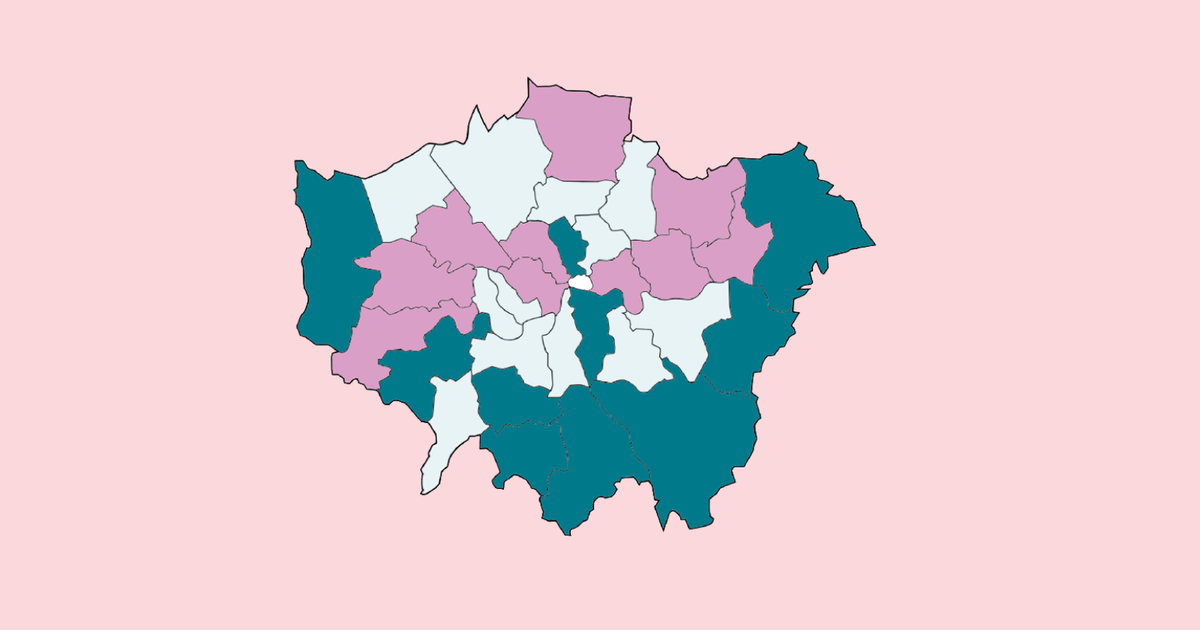
Which London boroughs have the highest level of poverty

Camden, Westminster, Tower Hamlets, Newham, Hounslow, Redbridge, Brent, Barking and Dagenham, Enfield, and Ealing all have poverty rates higher than the London average
Bromley, Richmond upon Thames, Merton, Sutton, Havering, Islington, Bexley, Southwark, Hillingdon and Croydon all have poverty rates lower than the London average.
Boroughs with higher levels of poverty are largely north of the river – especially in Inner and East London. Lower levels of poverty are more often in London’s outer boroughs – particularly in the Southern edges of the city.
This illustrates how, in London, wealth and poverty sit side by side. Richmond, one of the most affluent parts of the city, borders with Hounslow, which has higher levels of poverty.
This will play out within boroughs, too, with deep inequality often on the same street.
Get the latest data, analysis & research on poverty in London delivered straight to your inbox. Sign up to London’s Poverty Profile – monthly briefing.
How does this compare to the rest of the country?
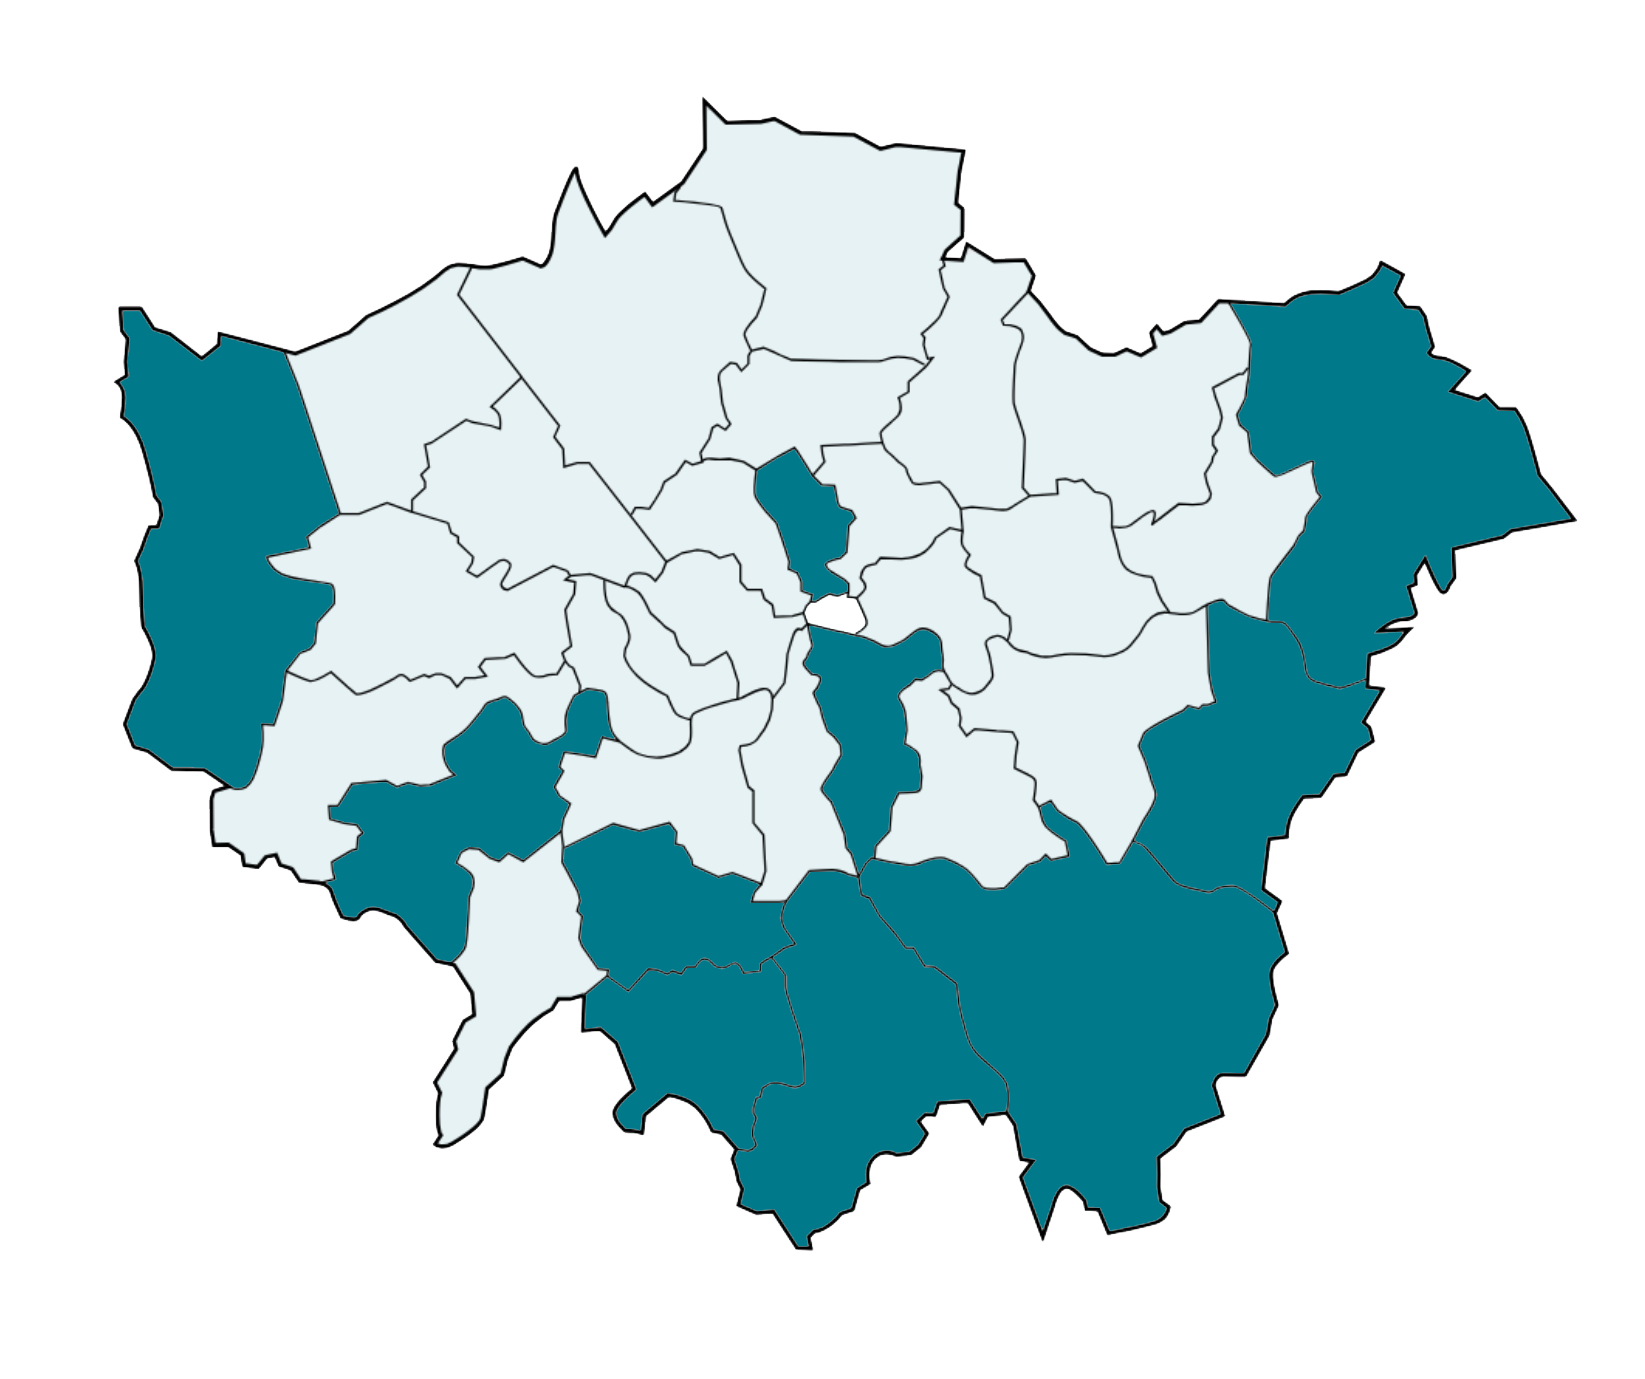
London has the highest poverty rate of all regions of England. One in four Londoners living in poverty. Although poverty varies across the city, more than half of boroughs also have higher levels of poverty than England as a whole.
In total, 20 out of 32 have higher levels of poverty than the England average. Only two have lower – Merton and Richmond.
Camden, Westminster, Tower Hamlets, Newham, Hounslow, Redbridge, Brent, Barking and Dagenham, Enfield, Ealing, Kensington and Chelsea, Lewisham, Greenwich, Hackney, Haringey, Kingston upon Thames, Wandsworth, Barnet, Harrow and Waltham Forest all have significantly higher levels of poverty compared to England as a whole.
Bromley and Richmond have below average levels of poverty compared to England as a whole.
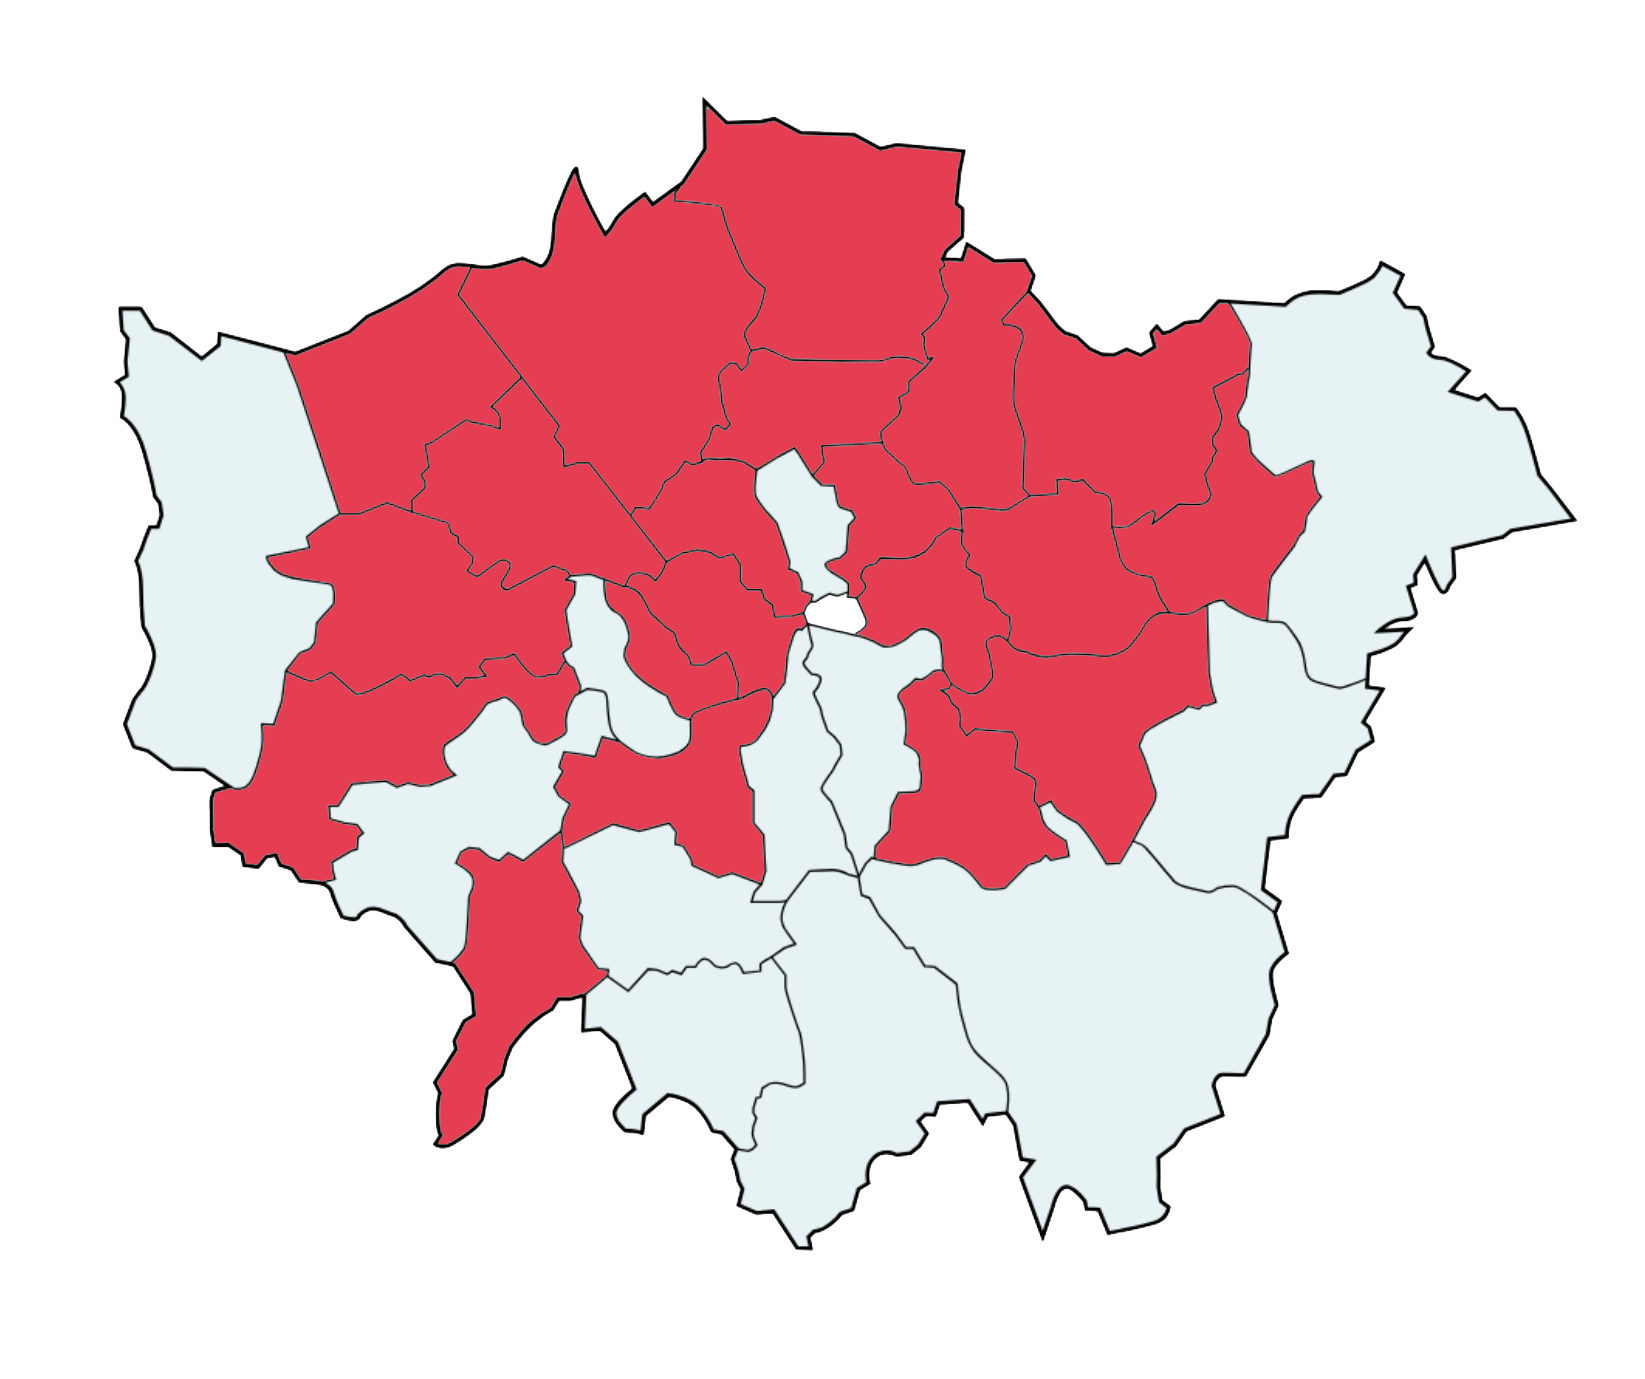
Child poverty by London borough
Child poverty rate (AHC) (2023/24)
Data source and notes
- Note
-
After housing costs figures are not avaliable for City of London, and please note before housing costs count is 208 children in 2023/24 Map categories are based on the London average, with pink indicating a value worse than the London average, green indicating a value better than the London average, and yellow indicating statistically the same as the average.
- Data source
-
Local indicators of child poverty, Centre for Research in Social Policy, Loughborough University for End Child Poverty; Children in low income families: local area statistics, DWP
- Chart source
-
London’s Poverty Profile 2024
https://trustforlondon.org.uk/news/borough-level-poverty-2025/#chart-1365
/data/dataset/1365/settings/
We see a similar trend when we look at child poverty by London borough.
The four boroughs with the highest levels of child poverty are all in Inner and East London – Hackney, Islington, Tower Hamlets and Newham. In these boroughs, more than 40% of children are in poverty.
Children born in these boroughs are more than twice as likely to be growing up in poverty than those in wealthier boroughs such as Richmond or Kingston.
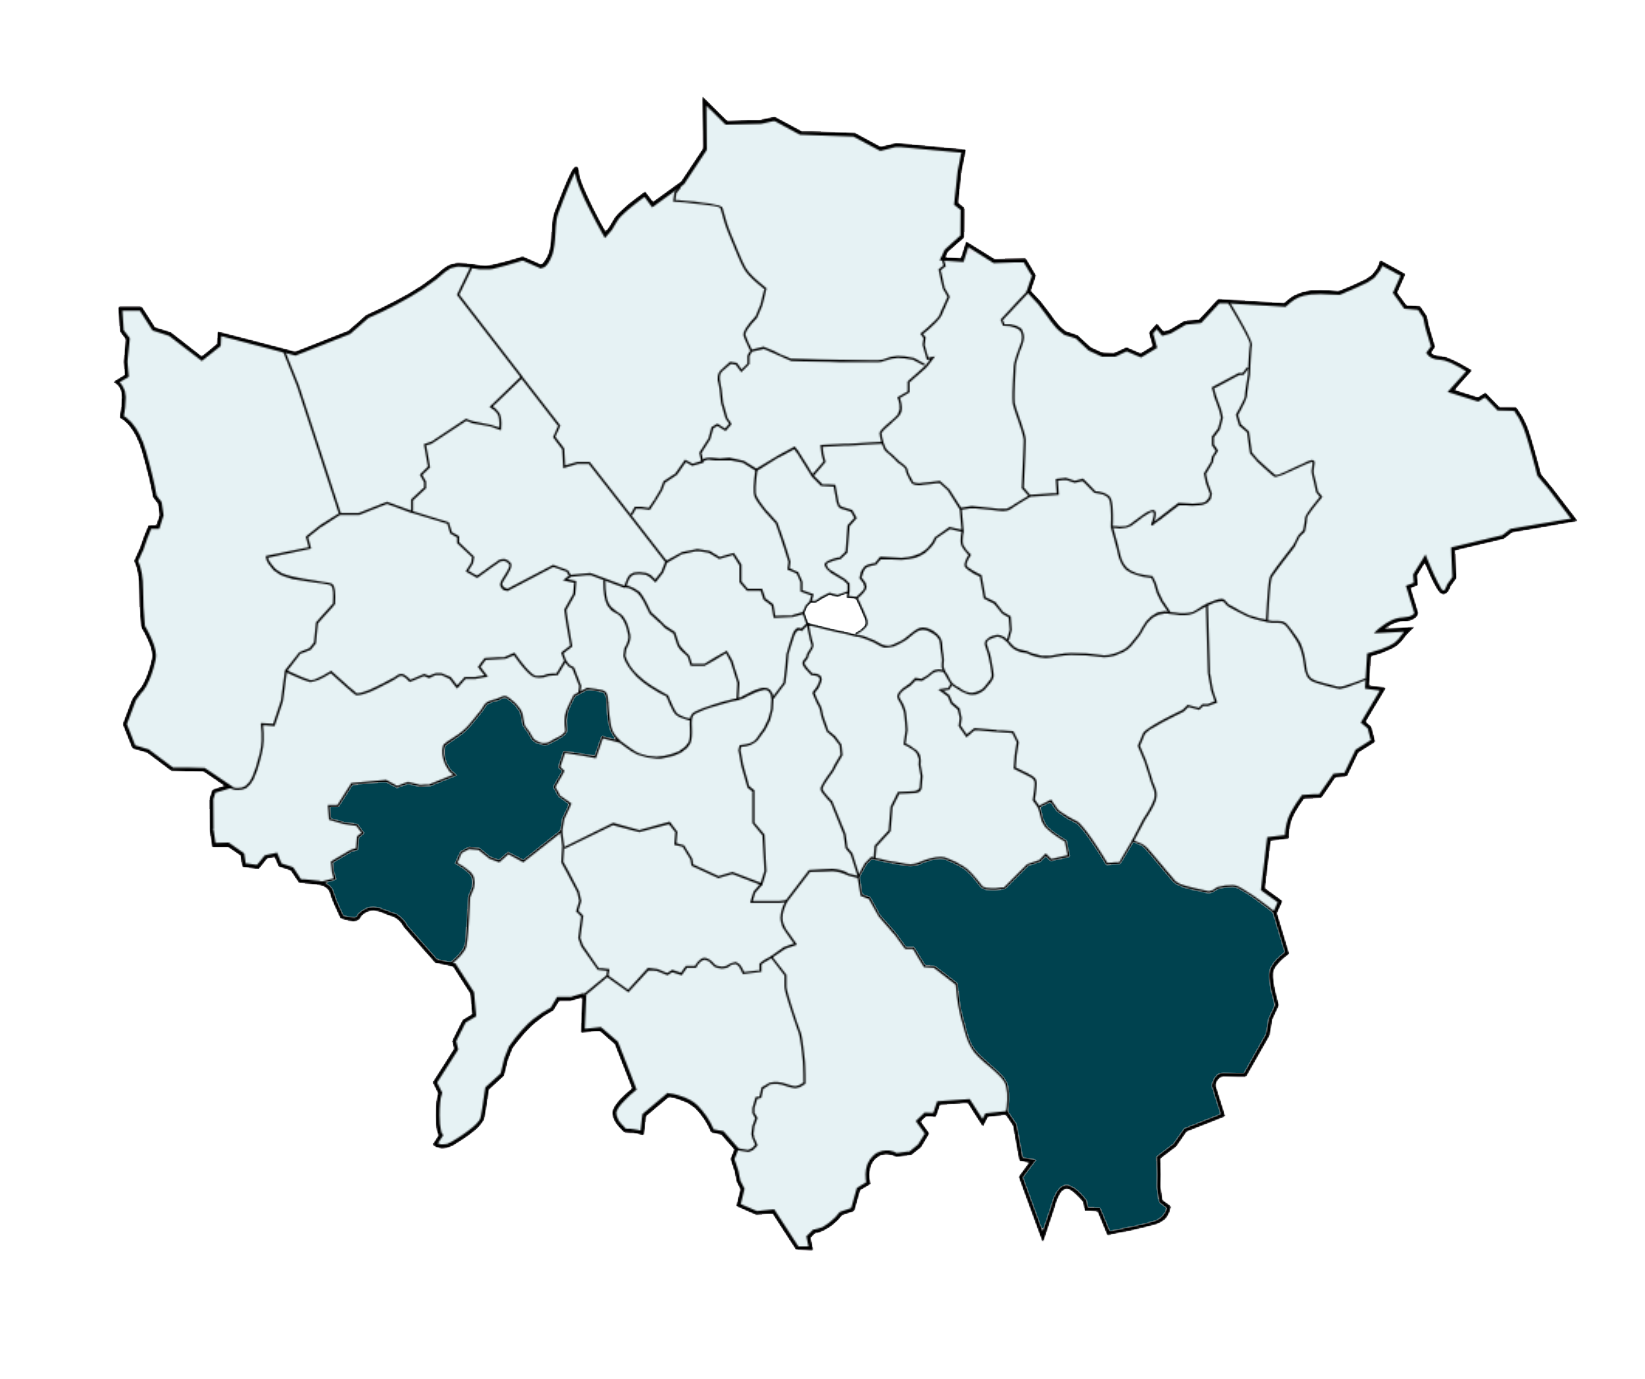
Each borough also has different dimensions to consider when looking at inequality.
Explore poverty and inequality for all of London’s boroughs.