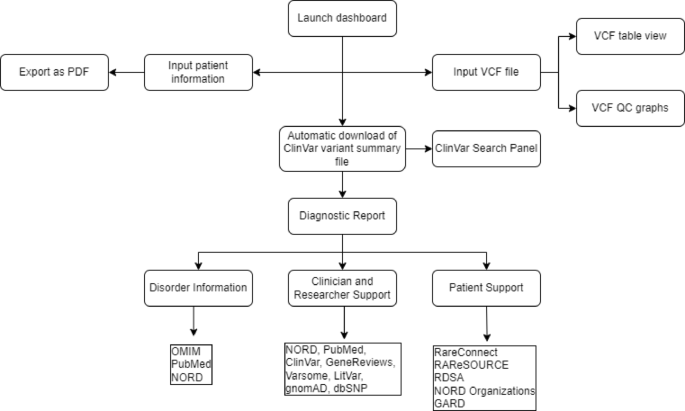
RareInsight is an interactive dashboard designed to support the dissemination and interpretation of genetic test results for clinicians, researchers, and patients, including their caregivers. The dashboard provides tailored educational content, variant visualization, and curated dynamic links to enhance patient understanding and clinical communication of genetic test results. By integrating clinical genetics with patient support pathways, RareInsight reduces the need for time-consuming independent searches and empowers users to better understand and disseminate genetic test results.
Dashboard features and functionality
The dashboard comprises four main pages: Home, Tutorial, Services, and Acknowledgements. The Home page (Fig. 2) outlines the aims and background of the RareInsight project. It features a video demonstration that guides new users through the dashboard’s functions. Upon launching, the dashboard automatically downloads and unzips the latest ClinVar variant summary file (~ 2 GB), a process that can take up to five minutes. If the file is already present locally, this step is skipped in subsequent launches. An alert message appears upon launching. Users must select between clinician/researcher and patient/caregiver. If the latter is selected, an additional alert will appear requiring the user to click on a checkbox stating the dashboard’s educational use only before the pop-up disappears.
Fig. 2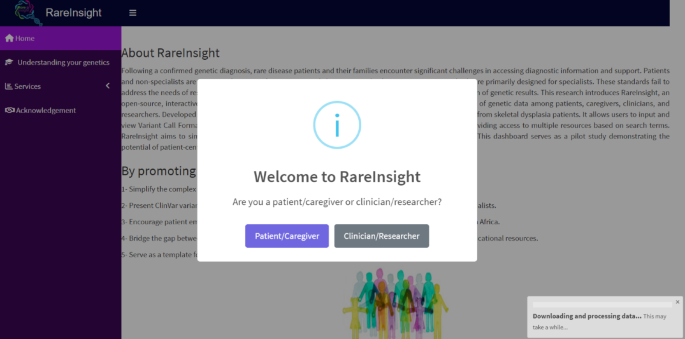
The layout and homepage of RareInsight. This is the first page that users will see when the dashboard is launched. It contains information about the project and what it aims to achieve. There is also a video demonstration of the dashboard in use. A pop-up indicates if the ClinVar variant summary file is being downloaded and unzipped.
The Understanding Your Genetics panel (Fig. 3) addresses a critical need for educational resources tailored to non-specialists. It aims to help users with no clinical or genetic background understand the basics behind genetics and what it means to have a rare disease. It includes three tabs:
Fig. 3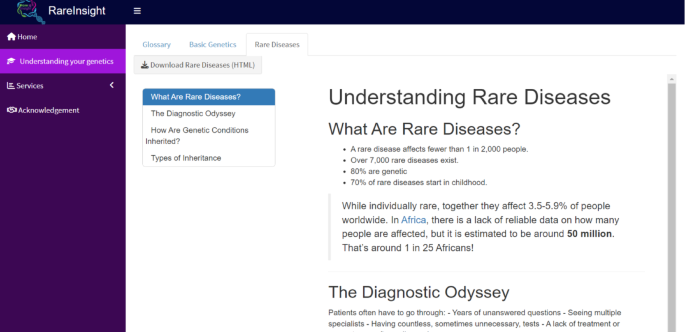
Understanding your genetics. This tutorial is divided into three tabs to give non-specialist users a basic overview of genetics and rare diseases.
Users can download each tab’s information as an HTML file, facilitating seamless sharing of information and knowledge beyond RareInsight’s users.
The Services panel contains four main functional components. Input User Information (Fig. 4) allows users to input relevant phenotypic and diagnostic information. General information can also be added, such as name, surname, ethnicity, date of birth, and the type of genetic test that was performed. These inputs can be exported as a PDF.
Fig. 4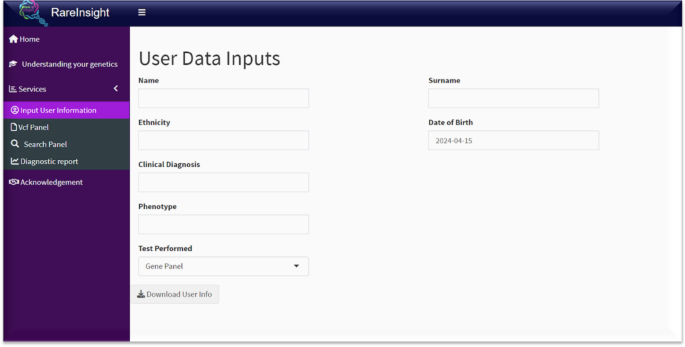
Input user information. This tab allows users to input relevant information about the patient’s diagnosis and phenotype.
The VCF Panel (Fig. 5) enables users to upload, view and filter VCF files in a table format, with accompanying quality control plots. This function was validated using the WES results from 25 diagnosed cases of fetal skeletal dysplasia. The causative variants were identified by filtering a patient’s VCF file. Currently, this panel can take unannotated and annotated VCF files from Annovar, Variant Effect Predictor (VEP), and SnpEff. In theory, the dashboard would be able to use both whole exome sequencing (WES) and whole genome sequencing (WGS) data as its input; however, this was not assessed in the present study. It is important to note that since patients typically do not get access to their VCF file, the VCF panel will likely be used by a clinician or researcher to easily view and filter the file. Additional unannotated VCF files have been made available for testing and can be accessed from the GitHub repository (https://github.com/omicscodeathon/rareinsight).
Fig. 5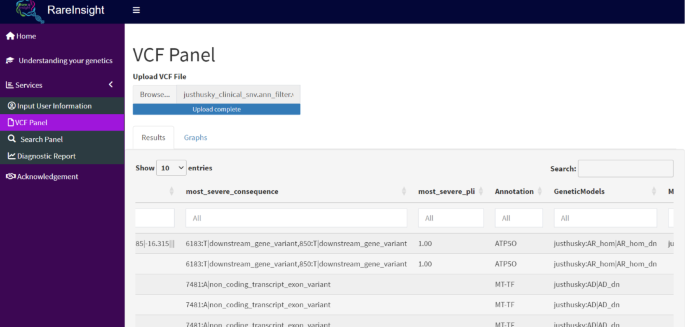
VCF panel view. The Results tab shows a visual representation of the input VCF file in a tabular format. The Graphs tab displays quality control metric for the VCF file.
The Search Panel (Fig. 6) facilitates targeted searches of the ClinVar variant database using gene names, variants, disorders, dbSNP or ClinVar accessions. Users can filter further based on pathogenicity, variant type, and clinical significance. These searches create dynamic links which are made available in the Diagnostic Report panel.
Fig. 6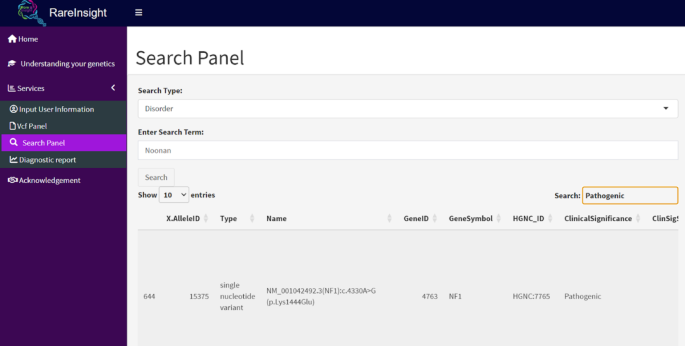
Search panel. This is a view of the ClinVar variant summary file where users can search for variants, disorders, genes, or accessions relevant to a patient’s diagnosis.
The Diagnostic Report panel (Fig. 7) generates dynamic links to external resources (e.g., PubMed, GeneReviews, OMIM, LitVar etc.) based on the search term used in the Search Panel. Each resource is contextualized with descriptions and usage instructions to enhance user experience (see Supplementary Table S2 online). The panel was assessed and validated using the skeletal dysplasia case results by searching for the causative gene, variant, disorder, and ClinVar accession in the Search Panel. Each dynamic link was individually accessed, demonstrating full functionality for known pathogenic and likely pathogenic variants.
Fig. 7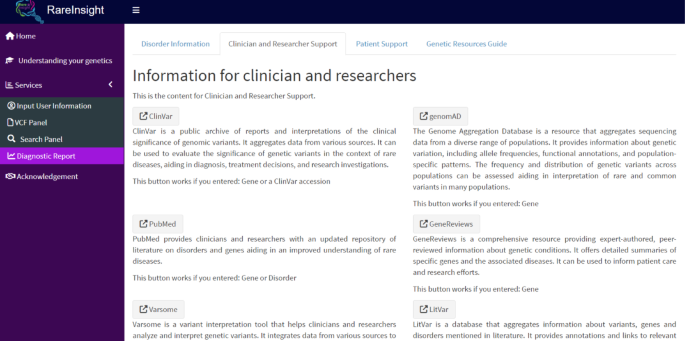
Diagnostic report. This panel allows users to search for links based on the Search Panel’s input. Links are divided by relevance to the user (Clinician and Researcher vs. Patient and caregiver).
To enhance accessibility, an additional tab was included to describe each available resource, with complex concepts simplified for non-specialist users such as patients and caregivers. Similar to the understanding your genetics panel, this tab’s information can be exported as an HTML file.
A tab named, Genetic Resources Guide (Fig. 8) was added. This simplifies the access to resources made available in the Diagnostic Report panel.
Fig. 8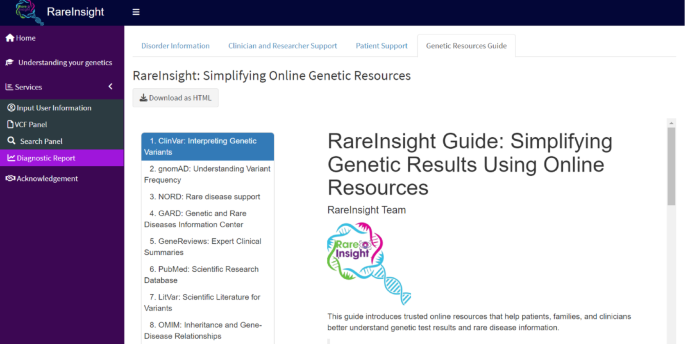 Unique features and impact
While several variant interpretation dashboards exist, RareInsight distinguishes itself by emphasizing patient and caregiver accessibility15 as well as emphasizing genetic variation as opposed to differential gene expression16,17,18,19,20. Most available tools cater exclusively to clinical or research professionals, often overlooking the needs of non-specialists21. RareInsight addresses this by integrating clinical data with patient advocacy, offering dynamic links to disease-specific resources and support organizations (see Supplementary Table S3 online). This places it in a unique position to empower patients and their support networks to interpret genetic findings more confidently and make informed decisions. While tools like Franklin and ClinGen are designed with clinicians in mind, RareInsight fills a critical gap by providing personalized support for those affected by rare diseases, particularly in under-resourced regions22,23,24,25.
This research highlighted a distinct lack of informational resources and support for patients residing in Sub-Saharan Africa where drug development for complex diseases is generally challenging26,27,28,29. An interesting initiative that has recently been developed to alleviate this issue is the South African Rare Diseases Access Initiative (RDAI)30. Their work aims to prioritize and improve diagnosis, access to treatments and services, data collection and management, coordinated care, and collaborative research. This initiative is important since the lack of data and resources on rare disease research has a direct negative impact on diagnosis, patient care, support and improving outcomes to name a few. A goal for RDAI therefore calls for a national framework that connects patients with relevant patient support organizations. This is of great interest to us as RareInsight aligns closely with the goals of RDAI by offering an open-access tool that can facilitate patient empowerment and information access.
Limitations and future directions
While the current version of RareInsight provides a meaningful step toward patient-focused variant interpretation, several limitations remain. Currently, it only focuses on known variants annotated in ClinVar and related databases. Consequently, novel or poorly annotated variants may yield limited results, particularly in under-represented populations. The current implementation of RareInsight requires users to run the dashboard locally in RStudio, which may present barriers for non-technical users. Funding would be required to deploy the dashboard on a server such as Posit Connect or shinyapps.io as these options are not freely available for long-term use. RareInsight acknowledges the risk of misinterpretation when non-experts engage with complex genomic data. To address this, the dashboard features a basic tutorial to explain key concepts in rare diseases along with a link to more in-depth information. Additionally, a disclaimer appears when launching the dashboard to remind users that it is for educational purposes only.
The present study focused only on the development of the dashboard; however, we recommend that future iterations conduct a Knowledge-Attitude-Practices (KAP) survey with potential users (clinicians, researchers, patients and caregivers) before and after using RareInsight (see Supplementary Table S4 online). This will allow for a structured assessment of how the dashboard influences the users’ understanding of rare diseases and variant interpretation, their confidence in engaging with genetic information, and their behaviour in seeking further information or support. Incorporating a KAP framework will provide quantitative and qualitative insights into the platform’s real-world impact and guide further user-centered improvements31. Further implementations could also focus on incorporating multilingual support and enabling fully customizable and exportable reports.