System under study: mono- and bilayer WSe2 quantum emitters
We begin our study by preparing highly-polarized single-photon emitters out of WSe2 flakes through a combination of deterministic strain and defect engineering as illustrated in Fig. 1(a). Based on the process presented in our previous work in Ref. 40, mechanically exfoliated mono- and bilayer WSe2 flakes were transferred onto a thermally oxidized silicon substrate (\({{{{\rm{d}}}}}_{{{{{\rm{SiO}}}}}_{{{{\rm{2}}}}}}\) = 110 nm) featuring an array of star-shaped nanostructures (dpillars = 150 nm). The long and sharp tips of the three-pointed star geometries induce strain on the material, generating spatially isolated nanowrinkles. Moreover, this type of geometry can host multiple nanowrinkles per site, increasing the number of available quantum emitters. The localized one-dimensional strain alters the energy bands leading to the efficient migration of free charge carriers to the area13, while the orientation of the strain dictates the directionality of the linear polarization. Subsequently, deterministically introducing defects to the sample via e-beam irradiation has previously been shown to increase the quantum emitter yield in this platform15,40. The “Methods” section provides further details on the fabrication process. To investigate the optical properties of the fabricated samples, we mounted them in an optical cryostat operating at 4 K. The cryostat is equipped with nanopositioners and a low-temperature objective lens (NA = 0.81, 60×). Initially, a low-temperature photoluminescence (PL) image of the sample was acquired under 470 nm light-emitting diode (LED) excitation. A 700 nm long-pass optical filter was employed to eliminate reflected signals from the excitation. As depicted in the inset of Fig. 1(b), the PL image reveals bright spots originating from the nanowrinkles in mono- and bilayer WSe2, which are distinctly contrasted against the emission signal from the planar, unstrained flakes.
Fig. 1: Quantum emitters in mono- and bilayer WSe2.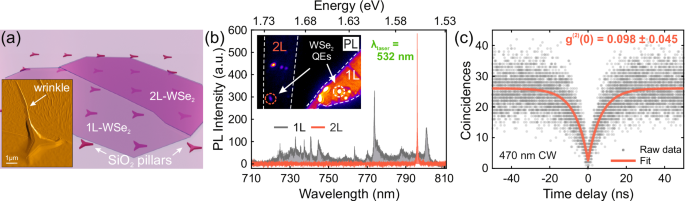
a Sketch of mono- (1L) and bilayer (2L) flake deposited on top of star-shaped nanostructures leading to the formation of nanowrinkles nearby their vertex. The nanowrinkles host the quantum emitters. Inset: atomic force microscopy (AFM) image of a star-shaped nanostructure covered by a bilayer flake with the visible presence of a nanowrinkle originating from the top vertex. b μ PL spectra under 532 nm pulsed laser excitation of the two bright spots in 1L WSe2 (gray) and 2L WSe2 (red) encircled in the inset image, integrated over 1 s. They show typical emission imprints of the two different thicknesses’ flakes. Inset: color-coded PL image of the sample taken at T = 4 K under CW LED excitation at 470 nm. The white dashed lines highlight the contours of the 1L and 2L flakes. The full widefield PL image of the sample is reported in Fig. S1. c Second-order correlation measurement of emitter Q1 from the bilayer spot (red dashed circle in inset in (b)). The fit reveals a g(2)(0) value of 0.098 ± 0.045.
For a quantitative comparison between the mono and bilayer emitters, we measured the PL spectra of the individual bright spot regions of each under a 532 nm pulsed excitation (pulse duration 150 fs, repetition rate 80 MHz) using a spectrometer (f = 550 mm, 1200 grooves/mm grating). Figure 1b shows the emission spectra obtained from two exemplary mono- and bilayer regions, circled with red and white lines in the inset, respectively, hosting strain-engineered quantum emitters (refer to Supplementary Fig. S1 for the full raw PL image in grayscale). The monolayer emission spectrum exhibits numerous intense and narrow emission lines spreading across a broad spectral range of 720–810 nm on top of a broad, weak emission background from the planar monolayer. The observed narrow lines are attributed to single-photon emission from several different emitters8,9,12, while the broad background is ascribed to the emission from the planar monolayer region around the emitter, present in the measurement due to the diffraction-limited collection spot. On the other hand, the bilayer quantum emitter presents a single isolated narrow emission line (with a full-width half-maximum (FWHM) of 0.14 nm) without any noticeable background, due to the indirect nature of the bandgap in pristine bilayer41. Surprisingly, despite the bilayer WSe2 host being an indirect bandgap, the intensities of the emission lines are comparable to those observed in the monolayer under identical experimental conditions (more exemplary spectra in Fig. S2 of the Supplementary Information). These considerations make WSe2 bilayer a preferable platform over monolayer for our scopes. We will focus on bilayer QEs in the following.
We measured the single-photon purity of bilayer WSe2 emitters by measuring the second-order correlation of a representative emission line (Q1) under CW excitation at 470 nm. A 750 nm long-pass filter helps suppress the emitted light from the laser light. The measurement is performed with a Hanbury Brown-Twiss (HBT) setup, which includes a 50:50 fiber beam splitter and a pair of superconducting nanowire single-photon detectors (SNSPDs). In Fig. 1c, we show the obtained correlation histogram as a function of delay, which exhibits a strong antibunching behavior. The suppressed coincidence counts at zero time delay establish the clear single-photon nature of the emission with extracted single-photon purity of g(2)(0) = 0.098 ± 0.045.
Above-band vs. near-resonant optical excitation
To systematically compare the effect of the above-band and the near-resonant excitation schemes on the bilayer quantum emitters, we conducted an investigation of the optical properties of two emitters (Q1 and Q2). Our study includes high-resolution emission spectra, lifetime, and purity. We analyze the differences to find the most effective approach for optimal performance.
Above-band optical excitation
Here, we used a 532 nm pulsed laser excitation. Figure 2(a) shows the μ PL spectrum obtained from Q1 at 4 K (see Fig. S5 of the Supplementary Information for the temperature-dependent series up to 40 K), revealing a narrow zero-phonon line (ZPL) at 800.5 nm and a visible broad phonon side-band (PSB). By fitting the ZPL and to the PSB with a Lorentzian and a Gaussian function, respectively, we qualitatively extract a width of 0.108 nm (0.209 meV) for the ZPL and 0.782 nm (1.513 meV) for the PSB, and a Debye-Waller factor DWF = IZPL/(IZPL + IPSB) of 0.551 (Fig. 2(a)). This suggests a strong exciton-phonon coupling, which is in good agreement with previous reports39,42,43. The ZPL is orders of magnitude broader than its Fourier-limited value of 57.0 × 10⁻⁶ nm (0.11 μeV), considering the decay time of 16.65 ns (see next paragraph). This suggests that the pure dephasing and charge noise contributions to the total linewidth is substantial, consequently resulting in lower indistinguishability31. Additionally, we observe that the width of the emission line gets broader when increasing the laser excitation power, almost doubling its value at the saturation level, as shown in Fig. S3 of the Supplementary Information.
Fig. 2: Above-band and near-resonant excitations.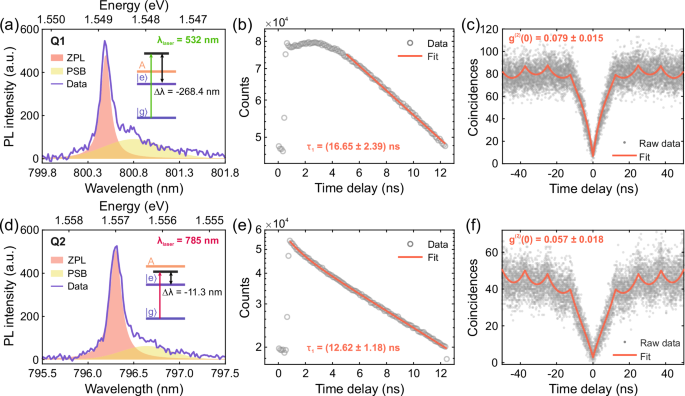
Emission spectra of emitter Q1 under pulsed above-band excitation at 532 nm (a) and emitter Q2 under near-resonant pulsed excitation at 785 nm (d). The graphs present fittings to the raw data (solid purple line) with a sum of a Lorentzian (red area) and a Gaussian (yellow area) accounting for the contribution from the ZPL and the PSB, respectively. The inset schemes on the right side show a simplified band diagram of the emitters as a two-level system (\(| g\left.\right\rangle\) and \(| e\left.\right\rangle\)) with the respective pumping energy, while A represents the energy level of the planar WSe2 A-exciton. b Semi-logarithmic plot of the time-resolved PL measurement from Q1 (grey circles) with relative single decay exponential fitting function (red line) with a constant τ1 = (16.65 ± 2.39) ns. c Second-order intensity correlation measurement (g(2)(τ)) of Q1 under above-band pulsed excitation. From the double exponential fit (red line), we extract an antibunching value of g(2)(0) = 0.079 ± 0.015. e Semi-logarithmic plot of the time-resolved PL measurement from Q2 (grey circles) with relative double decay exponential fitting function (red line). The two extracted time constants are τ1 = (12.62 ± 1.18) ns and τ2 = (1.14 ± 0.21) ns, accounting for 96.5% and 3.5% of the fit curve, respectively. f Second-order intensity correlation measurement of Q2 under near-resonant excitation. The g(2)(0) value extracted is 0.057 ± 0.018. The measurements in b and e are integrated over 3 minutes, while those in c and f over 8 hours.
For the characterization of the dynamic behavior of an individual quantum emitter under above-band excitation, we carried out a time-resolved PL (TRPL) measurement. As shown in Fig. 2(b), we observe a relatively fast decay at shorter time delays (≤0.5 ns), after which the curve rises again and reaches its maximum at around 3 ns. We attribute this to trapped states involved in the population of the excited state44,45. At longer delay times, the decay is fitted with a single exponential (red line), revealing a decay time of τ1 = (16.65 ± 2.39) ns (uncertainty given as standard error). Such value is in good agreement with previous observations on TMD single-photon sources40,46,47. The second-order correlation measurement under pulsed above-band excitation, shown in Fig. 2(c), reveals a g(2)(0) of 0.079 ± 0.015. The extracted value is consistent with the one in Fig. 1(c) under CW operation, indicating a good single-photon purity also under triggered excitation.
Near-resonant optical excitation
To perform near-resonant excitation, the wavelength of the pulsed laser was varied from 730 nm to 790 nm, corresponding to a detuning Δλ = λlaser − λX from −66.3 nm to −6.3 nm with respect to the quantum emitter (λX = 796.3 nm), in steps of 10 nm. The energy corresponding to this pumping wavelength is below the energy of the A-exciton of planar WSe248, but above the excitonic transition energy considered (\(| g\left.\right\rangle \to | e\left.\right\rangle\)) (cf. the band diagram scheme in the inset of Fig. 2d), thus, we refer to such a range of detuning as near-resonant. We observed that the quantum emitter could be excited over a large range of detunings (see Supplementary Note 4 for more details). This behavior has been previously reported in WSe29,49 based on photoluminescence excitation spectroscopy measurement. In our case, the maximum emission intensity occurred when the laser was detuned Δλ = −11.3 nm (9.1 meV) from the emission line, with results reported in Fig. 2d–f. At this detuning, the zero-phonon line and phonon sideband linewidths corresponding to emitter Q2 are found to be 0.124 nm and 0.760 nm, respectively. From this we compute the Debye-Waller factor as DWF = 0.538. (Fig. 2d). Additionally, under near-resonant excitation, we achieved a g(2)(0) value of 0.057 ± 0.018 (Fig. 2f). These results are similar to those obtained under the above-band excitation and suggest that the emission spectrum and single-photon purity of these particular quantum emitters may not be heavily dependent on the excitation scheme.
However, an evident dissimilarity between the two excitation schemes arises from the time-resolved measurement. As shown in Fig. 2e, the lifetime histogram obtained under near-resonant excitation exhibits a predominant single exponential decay contribution with a time constant of τ1 = (12.62 ± 1.18) ns. This particular contrast in decay dynamics under near-resonant excitation as compared to the above-band measurement presented in Fig. 2b can be attributed to the quantum emitter being optically excited near its bandgap. These experimental results suggest that directly populating a bilayer quantum emitter with a proper excitation scheme is essential to avoid unnecessary internal relaxation processes and the creation of additional unwanted photo-induced charge carriers, resulting in simpler dynamics and reduced lifetime.
Phonon-assisted excitationTheory: signatures of exciton-phonon coupling in the population inversion of bilayer WSe2 QEs
We now consider a laser excitation closer to resonance mediated by phonon-assisted relaxation, with a detuning of only a few nanometers or sub-nanometer. To support our experimental results, we first develop a theory of phonon-coupled QEs in bilayer WSe2 and calculate the population inversion under pulsed laser excitation. Earlier experimental and theoretical reports have shown evidence of strong exciton-phonon coupling in WSe2. While low-energy phonon coupling in monolayer WSe2 is mainly due to 2D LA phonons28,39,49, bilayer structures have a richer phonon landscape including interlayer vibrational modes50,51.
First, the phonon bandstructure of pristine mono- and bilayer WSe2 is calculated with Density Functional Theory (DFT) and shown in Fig. 3a, see the “Methods” section for the details. In the low-energy sector around Γ, monolayer WSe2 supports three acoustic phonon branches with vanishing energy at Γ, corresponding to out-of-plane, transverse, and longitudinal modes respectively. In contrast, bilayer WSe2 has two additional shear modes (SMs), involving lateral sliding between layers, and one breathing mode (BM), characterized by the out-of-plane compression and expansion of layers. Their energies at the Γ point of the Brillouin zone are 1.9 meV and 3.2 meV, respectively. Both SMs and the BM are inherently absent in monolayers.
Fig. 3: DFT-based phonon signatures on the population inversion for mono- and bilayer WSe2.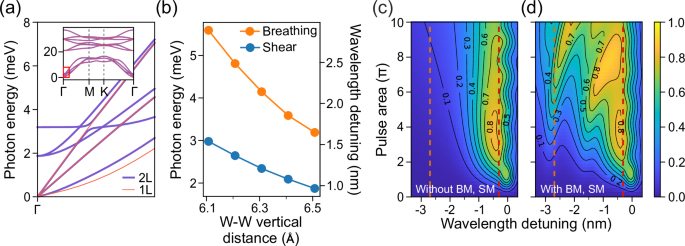
a Calculated phonon dispersion in mono- and bilayer WSe2 around the Γ point. For the bilayer, the equilibrium value dW-W = 6.5 Å is used for the vertical distance between W atoms in different layers. The inset shows the phonon dispersion across the full Brillouin zone. b Energy of interlayer SMs and BM at Γ as a function of the interlayer W-W distance dW-W. c Calculated population inversion in the presence of LA phonon coupling, as a function of wavelength detuning λlaser − λX from the exciton and pulse area Θ. The laser pulse has a FWHM of 0.30 nm (tp = 2.65 ps in our notation). d Same as in (c), including also the coupling to SMs and BM. Here, we use dW-W = 6.1 Å for the interlayer W-W distance, and the dimensionless BM coupling weight is set to ξBM = 5 (see the “Methods” section). Dashed orange and red lines are placed at detunings of −2.7 nm and −0.3 nm, respectively.
Additionally, SMs and BM are sensitive to the interlayer distance, which is likely modified in the strain-engineered nanowrinkle. As shown in Fig. 3b, the energy of SM and BM phonon modes increases to 3.0 meV and 5.6 meV, respectively, when the distance dW-W between W atomic planes is compressed from the equilibrium value of 6.5 Å to 6.1 Å. This indicates that the optical signature of SM (BM) phonons moves from a detuning of −0.97 nm (−1.65 nm) with respect to the emission line to −1.54 nm (−2.89 nm) under a small relative compression of 6% in the out-of-plane direction. Larger compression shifts the SM and BM further towards higher energy.
Next, we calculate the population inversion under pulsed laser excitation for emitter Q1 and for wavelength detuning up to Δλ = −3.4 nm. We calculate the excited state population after a Gaussian electric field pulse \(\Omega (t)=\frac{\Theta }{\sqrt{\pi }{t}_{p}}{e}^{-{(t/{t}_{p})}^{2}}\), with \(\Theta =\int_{-\infty }^{+\infty }{{{\rm{d}}}}t\Omega (t)\) the pulse area. The model includes the influence of the phonon environment with a numerically exact process tensor formalism (see the “Methods” section). The calculation includes a suitable spectral broadening to reproduce the experimental spectrum. In Fig. 3c, we consider only the coupling to LA phonons, which occurs in both mono- and bilayer structures. A sizeable population >0.8 is observed at detuning Δλ ≈ −0.4 nm and for a moderate pulse area of 3–5π (for the population inversion results at different laser parameters, see Supplementary Note 7). The signal decreases monotonically for larger detuning. We interpret these results as a signature of LA phonon-assisted excitation, where a laser pulse with a shorter wavelength than the exciton is able to populate the excited state by exciting additional phonon modes. The optimal detuning corresponds indeed to the maximum of the LA phonon spectral density. Closer to resonance (∣Δλ∣ λ ≈ 0 (see Supplementary Note 7).
The inclusion of SM and BM phonon coupling changes the scenario drastically. As seen in Fig. 3d, the exciton population after the laser pulse evolves non-monotonically as a function of the wavelength detuning. For Θ π, a first peak is observed at Δλ ≈ −2.8 nm and corresponds to phonon-assisted pumping via the BM. A second peak occurs around Δλ≈−1.5 nm and is caused by coupling to SM phonons. Finally, LA phonon-assisted excitation emerges at a shorter detuning. For larger pulse areas, the signature of BM and SM phonons shifts closer to the exciton and tends to merge with the LA band.
It should be noted that the spectral density of SM and BM coupling has been calculated under the assumption that the emitter-phonon coupling mechanism is the same as for LA modes, however, the contribution of the BM coupling in Fig. 3d has been magnified by a factor ξBM = 5 to obtain qualitative agreement with the subsequent experiment. Optical signatures of BM phonons in the population inversion are also visible at ξBM = 1, as reported in Supplementary Note 7 and Figure S8. A detailed study of the BM and SM coupling mechanism deserves further investigation in a separate work.
Longitudinal acoustic modes and spectral diffusion
To experimentally demonstrate phonon-assisted excitation on bilayer WSe2 quantum emitters, first, we identified a single isolated emission line (λ = 808.2 nm) under the above-band excitation of a 532 nm pulsed laser. Then we performed a photoluminescence excitation (PLE) measurement with smaller laser detuning to the emission line scanning a constant power pulsed laser, ranging from Δλ = −2.2 nm to Δλ = +0.5 nm (Fig. 4(a)). The obtained coarse PLE measurement reveals two maxima. Fitting the data points, the two maxima appear to be centered at Δλ = −1.7 nm and Δλ = −0.3 nm respectively, in qualitative agreement with the theoretical prediction for SM and LA modes. The signal goes down to negligibly small values at positive detuning, after crossing the ZPL. The power-series measurement in Fig. 4b at Δλ = −1.4 nm detuning shows a saturation behavior of the peak emission intensity, which could be interpreted as a signature of exciton preparation through incoherent processes37,52. While carrying out the PLE measurement close to the resonance condition, the emission line under LA phonon-assisted excitation clearly appears to be more stable and narrower in contrast to the emitter excited under the above-band excitation.
Fig. 4: Longitudinal acoustic phonon-assisted excitation and spectral diffusion.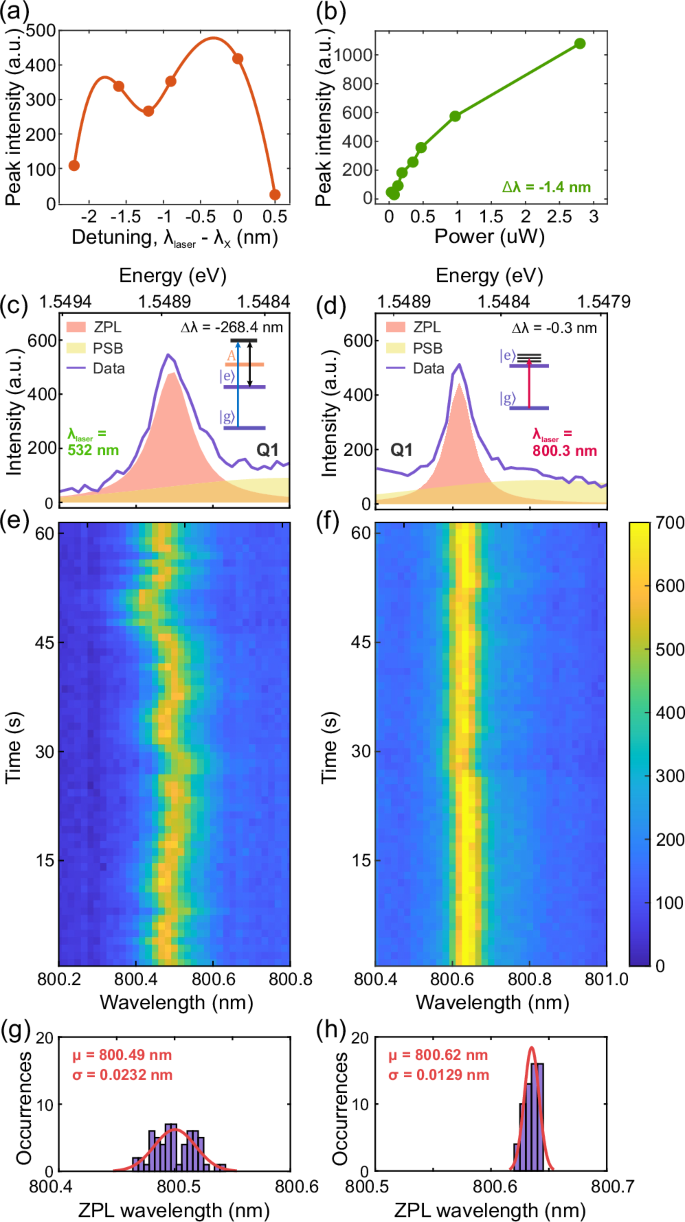
a Coarse PLE spectrum of the quantum emitter, showing two absorption maxima centered at detuning Δλ = −1.7 nm and Δλ = −0.3 nm, respectively. b Power dependence of the peak intensity evaluated at a detuning Δλ = −1.4 nm. High-resolution PL spectra at time 1 s (c) and (d) and their time evolution (e) and (f) for above-band excitation and phonon-assisted excitation, respectively. g, h show the statistical analysis of the central wavelength of the ZPL as extracted from the fitting of each line in the map. The red curves are Gaussian fittings of the obtained distributions. The mean value and the standard deviation in (g) are μZPL = 800.49 nm and σZPL = 0.0232 nm, respectively. At the same time, their values for (h) are μZPL = 800.62 nm and σZPL = 0.0129 nm.
To quantitatively evaluate and compare the line broadening and the spectral diffusion under different excitation schemes, we performed μ PL time evolution measurements from the same emitter Q1 under phonon-assisted and above-band excitation. For the phonon-assisted measurements, the excitation laser detuning was fixed at Δλ = −0.3 nm. On the other hand, for the above-band excitation measurement, a 532 nm pulsed laser (Δλ = −268.4 nm) was used to excite the emitter Q1, as in Fig. 2a–c. The emission line excited via the acoustic phonons (Fig. 4c) exhibits a FWHM of the fitted μ PL spectrum of 0.074 nm (151 μeV). This value is close to the nominal resolution of our spectrometer (0.05 nm), which might, thus, not allow us to resolve the true linewidth of the emission. Anyhow, the obtained value is 1.5 times narrower than the FWHM of 0.108 nm from the spectrum under the below-saturation above-band excitation (Fig. 4d).
The broadening of the peak’s linewidth provides an indication of energy shift of the quantum emitter energy in timescales faster than the experimental acquisition time, which is one of the main impediments to indistinguishable photon generation. On the other hand, spectral diffusion of the order of 1Hz can be traced over the measurement timescale. In this regard, we then recorded the emission signal as a function of time under both excitation schemes, as shown in Fig. 4e, f. The spectral diffusion at a timescale slower than the experimental acquisition time is also drastically reduced under acoustic phonon-assisted excitation. In both maps, each horizontal frame corresponds to 1 second of measurement, during which the PL emission is integrated over 0.7 s. By fitting each spectrum with a Lorentzian function, we can extract the resonance of the ZPL as a function of time. The histogram plots in Fig. 4g, h show the number of occurrences in the wavelength range of emission, grouped up in 0.005 nm-broad bins. Fitting the histograms with a Gaussian function allows us to extract a mean value of μZPL = 800.49 nm and a standard deviation of σZPL = 0.0232 nm for the distribution of the peaks’ central position under above-band excitation, with μZPL = 800.62 nm and σZPL = 0.0129 nm under acoustic phonon-assisted excitation.
This suggests that a more stable charge environment is achieved under phonon-assisted excitation thanks to the reduced creation of additional photo-induced charges compared to above-band excitation, resulting in lower spectral diffusion. Both the inhomogeneous broadening of the ZPL and its spectral diffusion, here mitigated, are critical obstacles to single-photon indistinguishability, which requires a lifetime-limited linewidth, identical emission energy, and well-defined polarization. Improved reduction of inhomogeneous broadening and spectral wandering of the emission peak could be achieved by combining the current pulsed excitation scheme with a more beneficial substrate material choice30.
Despite the efficacy of excitation via acoustic phonons, the laser leakage into the ZPL of the emission line under such a small detuning deteriorates the single-photon purity. Filtering out the laser leakage is a practical challenge that arises when the detuning is in the order of the sub-nanometer. As a consequence, in the following, we aim to perform excitation through BM absorption, as suggested from Fig. 3d. As mentioned before, the BM mode is a unique feature of bilayer structures, and its appearance at higher spectral detuning from the ZPL compared to the LA modes makes it more practically feasible to perform efficient excitation of bilayer QEs for high-purity single-photon generation with uncomplicated spectral filtering to suppress the pump laser.
Breathing mode and single-photon characterization
To exploit the BM phonon for the exciton preparation of bilayer quantum emitters, we tuned the laser at wavelength λlaser = 805.5 nm, which corresponds to a detuning of Δλ ≈ 2.7 nm (5.1 meV) from the Q3 line, centered at 808.2 nm (Fig. 5a). By coarsely scanning the laser wavelength, we experimentally observed that the emission intensity is rather sensitive to laser spectral shift, completely disappearing for detunings deviating ±0.2 nm from the optimal condition of Δλ = −2.7 nm. It is worth mentioning that such larger laser detuning (−2.7 nm) of the BM excitation compared to the excitation via LA phonons makes spectral filtering of the laser light from the single-photon emission more straightforward. The extracted FWHM with a Lorentzian fit is 0.174 nm (0.33 meV), approximately 40% larger compared to Q1 and Q2 under above-band and near-resonant excitation. Note that the Debye-Waller factor under this excitation has increased to 0.712. The broader ZPL compared to those in Fig. 2a, d under above-band and near-resonant excitations, respectively, can be attributed to the fact that pulsed excitation at a detuning of −2.7 nm (5.1 meV) requires high excitation power, potentially resulting in additional line broadening. The second-order autocorrelation measurement (see Fig. 5b) shows a g(2)(0) of 0.053 ± 0.079, establishing highly pure single-photon emission similar to those under above-band and near-resonant excitations. This testifies to the success of using the BM to perform excitation of the bilayer quantum emitter and obtain high single photon purity thanks to easier spectral filtering.
Fig. 5: Phonon-assisted excitation.
a PL spectrum of emitter Q3 under pulsed excitation at detuning of −2.7 nm from the quantum emitter. The fit function on the raw data (purple) is a sum of a Lorentzian (red area) and a Gaussian (yellow area) accounting for the contribution from the ZPL and the PSB, respectively. The inset shows a simplified band diagram of an emitter as a two-level system highlighting the pumping energy detuning. b Second-order autocorrelation measurement of Q3. From the double exponential fit (red line), we extract an antibunching value of g(2)(0) = 0.053 ± 0.079. c Time-resolved PL measurement from Q3 in a semilogarithmic plot with relative double exponential fitting function with extracted time constants of τ1 = (1.33 ± 0.04) ns (80.4%) and τ2 = (8.31 ± 6.29) ns (19.6%). d Zoom-in of g(2)(τ) in (c) for time delays up to ±50 ns.
However, the most remarkable observation is the shortened decay time of the emission under phonon-assisted excitation. The double exponential fit on the time-resolved PL data presented in Fig. 5c suggests that 80.4% of the contribution to the emitted light has a decay time of (1.33 ± 0.04) ns. This is five times shorter than the minimum decay time recorded under above-band excitation in mono- and bilayer WSe2 from the flake at issue, and among the shortest decay times reported in the literature of WSe2-based quantum emitters on a dielectric substrate without any cavity (see Supplementary Note 8 and Fig. S11). Therefore, the lifetime measurement under phonon-assisted excitation can confidently be attributed to the employed excitation mechanism rather than to variability among different quantum emitters. We attribute this reduction of about one order of magnitude as compared to the above-band excitation to the fact that exciting near the resonance of the emitter via the efficient acoustic phonons avoids additional relaxation processes before populating the system. The relevance of this result lies in the fact that faster exciton recombination paves the way for a deterministically triggered source at a higher rate for future quantum computing devices based on WSe2 quantum emitters. Besides that, the additional low contribution (below 20% of the total integrated counts) of longer decay time τ2 = (8.31 ± 6.29) ns can be attributed to additional slow carrier recombination processes within the bilayer quantum emitter. A previous report on monolayer WSe2 quantum emitter shows CW excitation at a detuning of 5.07 meV33, corresponding to − 2.5 nm, where coupling to a blue-shifted exciton (BS-X) resonance is identified. The energy detuning is very similar to the energy of the breathing mode here considered. However, the work in Ref. 33 is fully conducted on monolayer WSe2, which does not support interlayer SM and BM phonons. Even though we cannot rule out the possibility of absorption from an additional charged or dark exciton state, the predictions from our theoretical model in the presence of SM and BM coupling are consistent with our experimental observation.