Authors: Petras Katinas, Luke Wickenden & Vaibhav Raghunandan
Russian quarterly fossil fuel revenues drop to lowest figures since invasion — with gas deliveries via Turkstream falling by 16% in the second quarter of the year
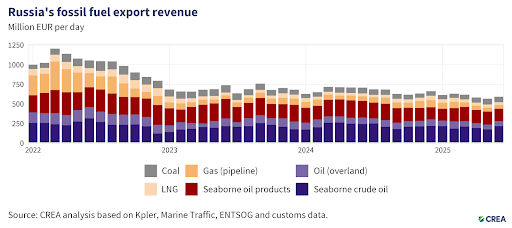
- Russian fossil fuel revenues in the second quarter of 2025 dropped by 18% year-on-year — the lowest in a quarter since the invasion of Ukraine. This occurred despite an 8% increase in volumes exported in Q2 compared to Q1 of 2025.
- In Q2 2025, Russian fossil gas exports to Europe continued to decline, deepening the downturn that began in Q1 following the end of gas transit through Ukraine. Total monthly exports fell from 3.32 bcm in April to just 3.01 bcm in June, representing a 9.4% drop quarter-on-quarter.
- In June, Belgium’s purchases of Russian LNG rose by 12% in volume terms month-on-month totalling EUR 300 mn.
- Over half of Russian seaborne oil exports were transported on G7+ tankers in June, a 6 percentage point increase from May. Since January, the G7+ share in Russian oil transport has increased from 36% to 56%.
- Since introducing sanctions until the end of June 2025, thorough enforcement of the price cap would have cut Russia’s export revenues by 11% (EUR 39.51 bn). In June alone, full enforcement of the price cap would have reduced revenues by 5% (approximately EUR 0.55 bn).
- The EU Commission recently proposed lowering the oil price cap to USD 45 per barrel, considering current global oil prices. CREA analysis suggests that a USD 45 per barrel price cap would have cut Russian revenues by 28% (EUR 3.1 bn) in June alone.

- In June 2025, Russia’s monthly fossil fuel export revenues saw a 4% month-on-month rise to EUR 593 mn per day. The rise in revenue was due in part to a 2% month-on-month increase in their export volumes and rebound in the price of oil.
- Russian revenues in the second quarter of 2025 dropped by 18% year-on-year — the lowest in a quarter since the invasion of Ukraine. This occurred despite an 8% increase in volumes exported in Q2 when compared to Q1 of 2025.
- In June, Russian revenues from seaborne crude oil saw a sharp 25% month-on-month increase to EUR 218 mn per day — the highest this year. Seaborne export volumes also rose by 15% month-on-month to their highest levels in 2025.
- Russian revenues from crude oil via pipeline increased by 6% month-on-month in June, to EUR 65 mn per day. Volumes saw a relatively lower increase of 2%.
- Russian liquefied natural gas (LNG) revenues dropped by 6% to EUR 38 mn per day, corresponding to a similar 6% drop in volumes exported.
- Revenues from pipeline gas decreased by 4% to EUR 47 mn per day, and the volume of pipeline gas exports also dropped by 3%.
- Russian revenues from seaborne oil products dropped by 7% to EUR 155 mn per day in June.
- Russian revenues from coal saw an 8% month-on-month drop to EUR 69 mn per day while volumes dropped by 5%.
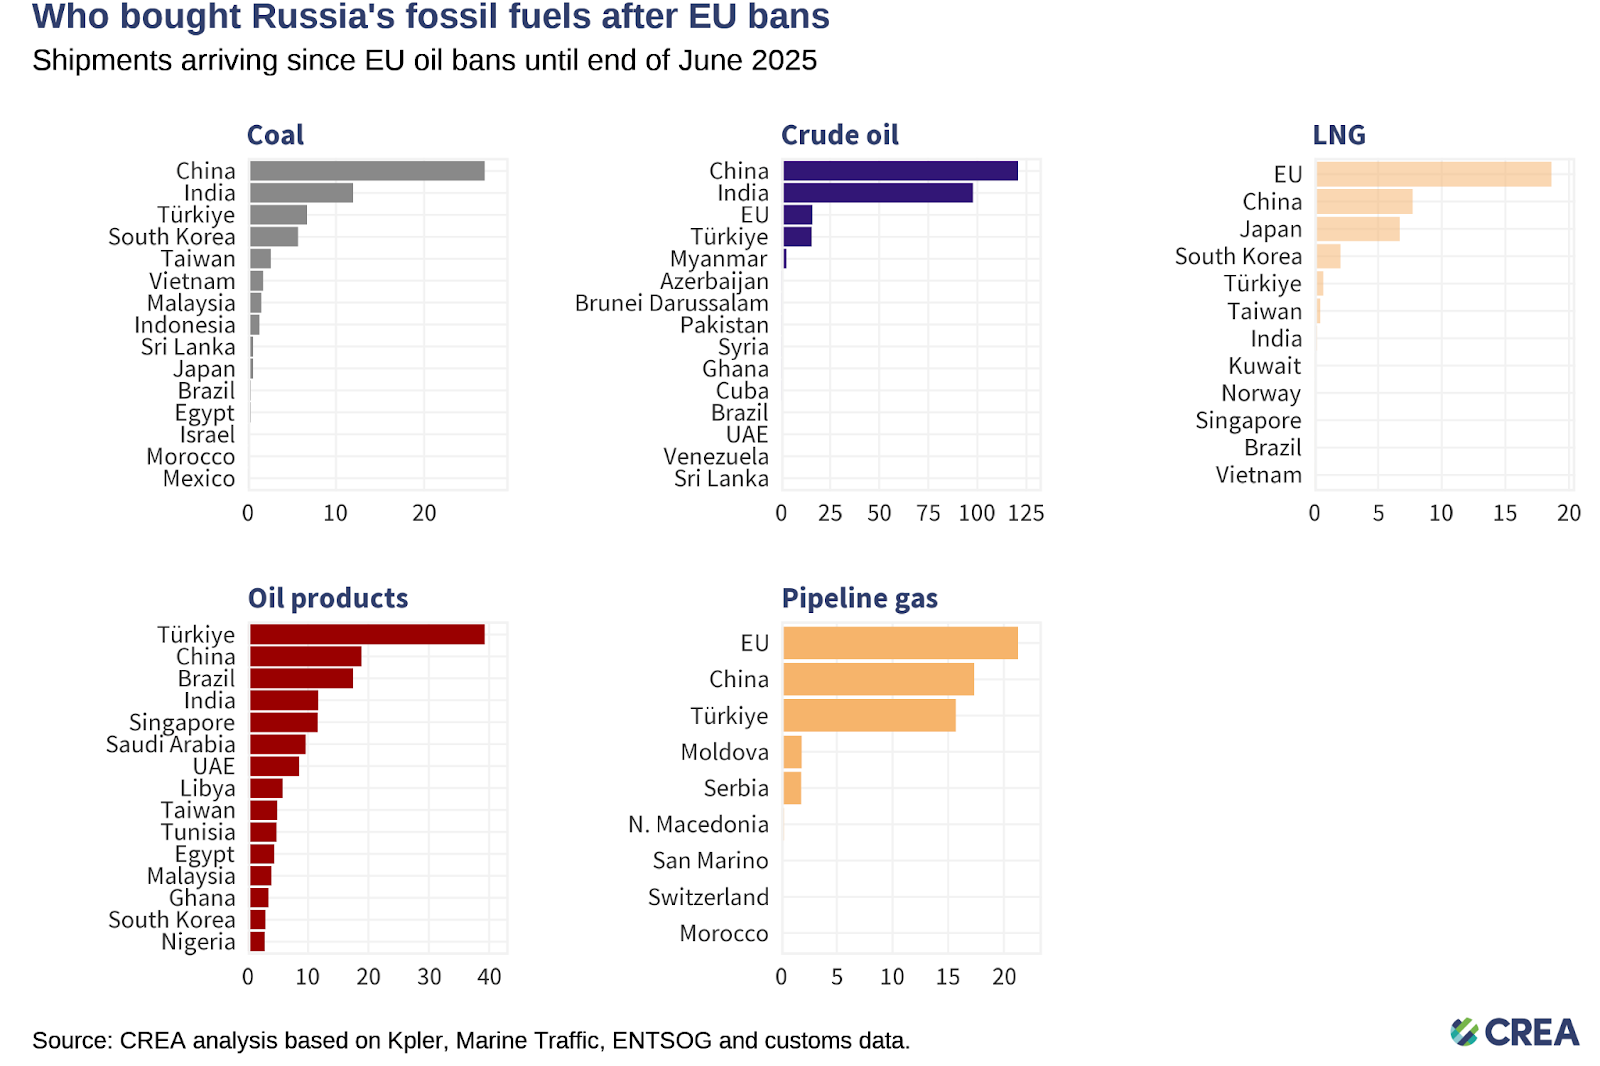
- Coal: From 5 December 2022 until the end of June 2025, China purchased 44% of all of Russia’s coal exports. India (19%), Turkiye (11%), South Korea (9%), and Taiwan (4%) round off the top five buyers list.
- Crude oil: China has bought 47% of Russia’s crude exports, followed by India (38%), the EU (6%), and Turkiye (6%).
- Oil products: Turkiye, the largest buyer, has purchased 26% of Russia’s oil product exports, followed by China (13%) and Brazil (12%).
- LNG: The EU was the largest buyer, purchasing 51% of Russia’s LNG exports, followed by China (21%) and Japan (18%).
- Pipeline gas: The EU was the largest buyer, purchasing 37% of Russia’s pipeline gas, followed by China (30%) and Turkiye (27%).
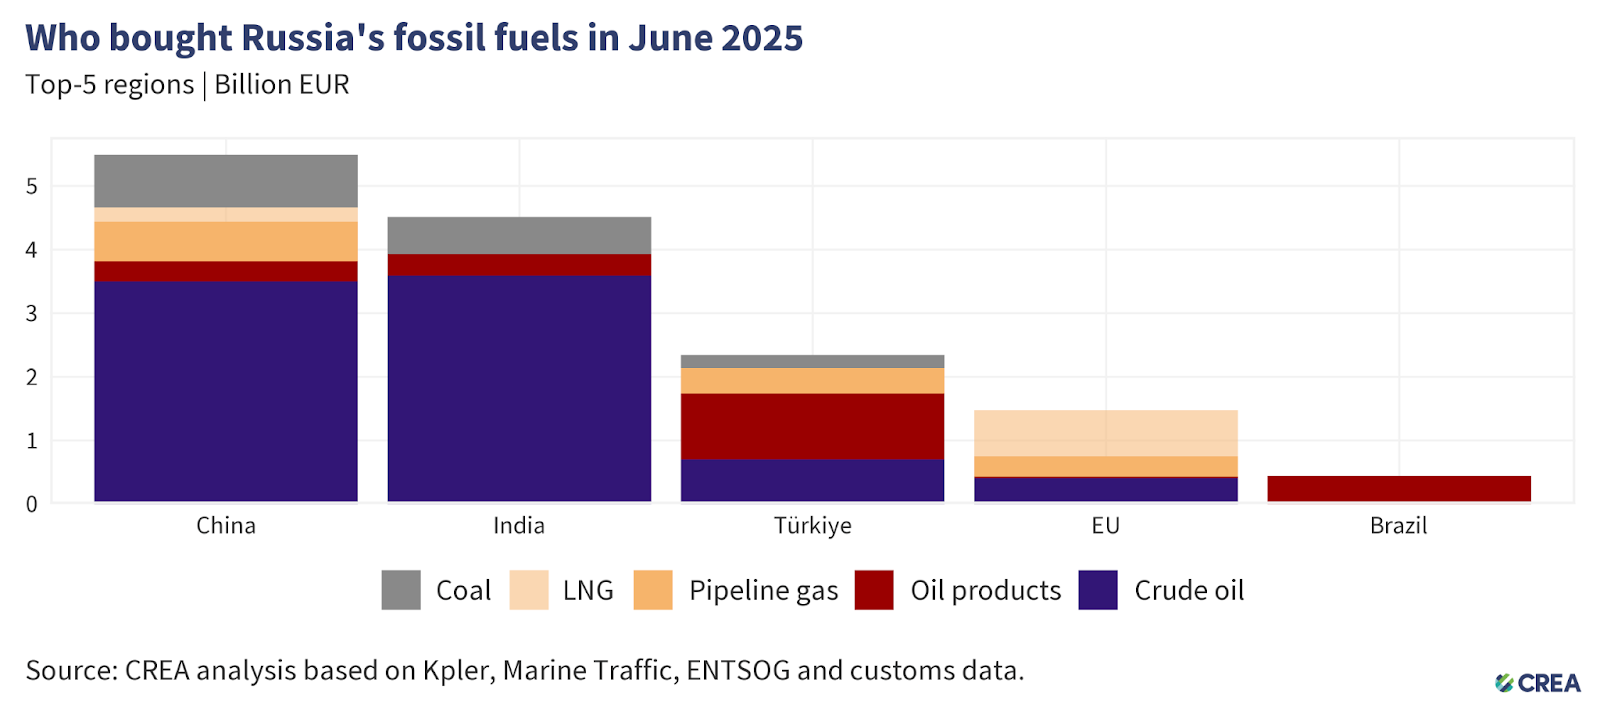
- China remained the largest global buyer of Russian fossil fuels in June 2025. Their imports accounted for 38% (EUR 5.4 bn) of Russia’s monthly export earnings from the top five importers. Crude oil comprised 64% (EUR 3.5 bn) of China’s imports from Russia.
- China’s imports of seaborne crude rose by 5% month-on-month in June. Russian crude imports though only saw a marginal 2% rise, consisting of 11% of the total.
- In June, India remained the second-largest purchaser of Russian fossil fuels, importing fossil fuels worth EUR 4.5 bn. Crude oil accounted for 80% (EUR 3.6 bn) of these imports.
- While India’s global imports of crude oil dropped by 6% in June, Russian volumes saw an 8% month-on-month rise — to their highest levels since July 2024. More than half of these imports from Russia were made by three refineries in India which also export refined products to G7+ countries.
- Turkiye was Russia’s third-largest importer of fossil fuels, contributing 16% (EUR 2.3 bn) of the total export earnings from its top five importers. Forty four percent of Turkiye’s imports from Russia consisted of oil products valued at EUR 1 bn.
- Turkiye’s imports of oil products dropped by7% month-on-month in June. Russian oil products suffered a more significant 13% reduction.
- The port of Ceyhan in Turkiye increased imports of refined oil products by 33% in June. Russian products constituted 88% of the total and saw a 40% month-on-month increase. The terminal has previously been suspected of re-exporting Russian oil products to the EU.
- The EU was the fourth-largest buyer of Russian fossil fuels, with its imports accounting for 10% (EUR 1.47 bn) of the top five purchasers. Almost half of these imports were Russian LNG, valued at EUR 728 mn.
- Brazil bought EUR 443 mn of Russian fossil fuels in June, the entirety of which were oil products.
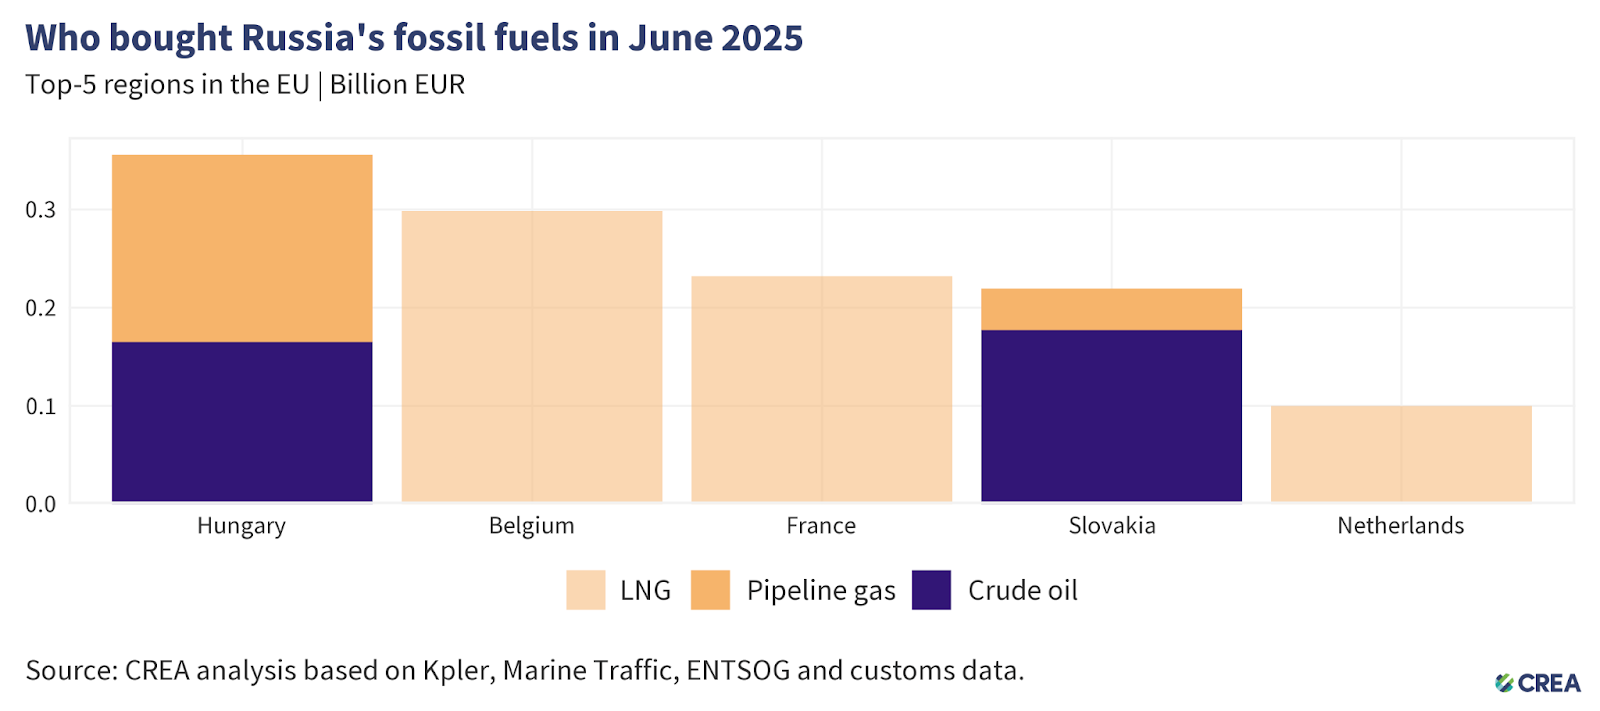
- In June 2025, the five largest EU importers of Russian fossil fuels paid a total of EUR 1.2 bn. The EU does not sanction natural gas, which accounts for over 72% of these imports and is mainly delivered by pipeline or as liquefied gas. The rest was mostly crude oil, which continues to flow to Hungary and Slovakia via the southern branch of the Druzhba pipeline under an EU exemption.
- Hungary was the largest importer, purchasing EUR 356 mn of Russian fossil fuels in June. These included crude oil (EUR 165 mn) and gas via pipeline (EUR 191 mn).
- Belgium was the second-largest importer of Russian fossil fuels in June, with their purchases totaling EUR 300 mn. The entirety of their imports consisted of Russian LNG. Belgium’s imports of LNG from Russia rose by 12% month-on-month, in line with a 12% increase in total LNG imports in June.
- France, the third-largest buyer within the EU, imported Russian fossil fuels worth EUR 232 mn, all of which was LNG. However, the fact that this gas is imported via France does not necessarily mean it is consumed there. A recent study indicates that some Russian LNG entering France through the Dunkerque terminal is delivered to Germany.
- Slovakia was the fourth-largest importer of Russian fossil fuels within the EU. Almost 81% of Slovakia’s imports consisted of crude oil via the Druzhba, valued at EUR 178 mn. The derogation allowing Russian crude oil to be refined into oil products and re-exported to Czechia has now expired as of June 5th.
- While Czechia has indicated it does not need to import oil products from Slovakia, this trade remains important for the latter. According to Eurostat, Slovakia exported oil products worth EUR 59 mn per month to Czechia on average in Q1 2025 — accounting for 40% of its total monthly exports. Going ahead, to maintain this trade with Czechia, Slovakia must prove that the oil products have not been refined from Russian crude.
- CREA & CSD’s recently published report highlighted how Hungary and Slovakia have exploited this derogation and not reduced reliance on Russian fossil fuels since the invasion. A week after its publication, Hungary’s oil and gas major MOL Group announced a new agreement that could ‘increase the volume of alternative crude oil processed in its refineries by up to 160 thousand tonnes per year’. While masquerading as progress, in reality, this move would reduce both countries’ overall Russian oil reliance by a mere 1%.
- The Netherlands exclusively imported LNG valued at EUR 99 mn from Russia in June.
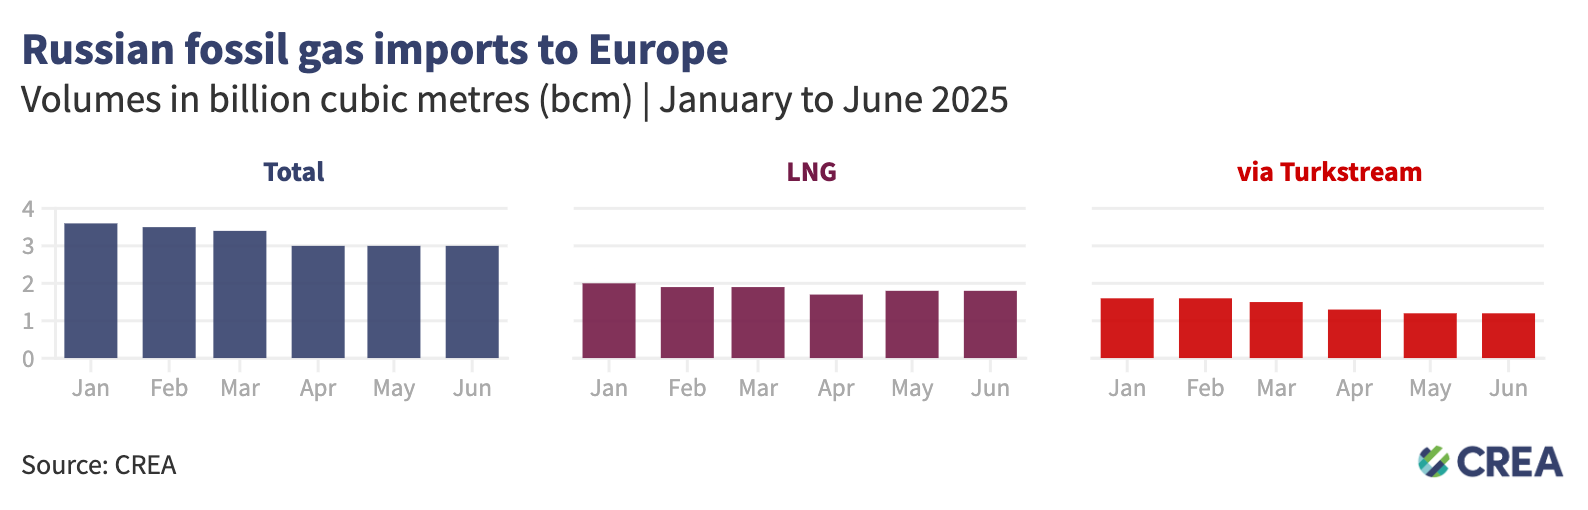
In Q2 2025, Russian fossil gas exports to Europe — including LNG and gas delivered via the TurkStream pipeline — continued to decline, deepening the downturn that began in Q1 following the end of gas transit through Ukraine. Total monthly exports fell from 3.32 bcm in April to just 3.01 bcm in June, representing a further 9.4% drop quarter-on-quarter. The data confirms that Russia is struggling to redirect flows efficiently via alternative routes, and European buyers are accelerating diversification efforts.
LNG exports remained relatively stable during the quarter, hovering around 1.81 bcm in April and ending at 1.81 bcm in June, showing only marginal fluctuation. This suggests Russia is maintaining seaborne export capacity despite logistical and sanction-related constraints. However, TurkStream pipeline flows dropped significantly — from 1.51 bcm in April to 1.19 bcm in June, a steep 21% decline. Flows via Turkstream witnessed a 16% quarter-on-quarter decline in the first half of 2025. This sharp contraction is particularly notable as TurkStream remains the only major direct pipeline route still operational between Russia and the EU.
Overall, Russian gas exports to the European Union are clearly in retreat, with Q2 marking a continuation of the structural downturn that began in late 2024. EU imports from Russia via pipeline are shrinking, and LNG volumes — while more resilient — are not expanding fast enough to offset the loss.
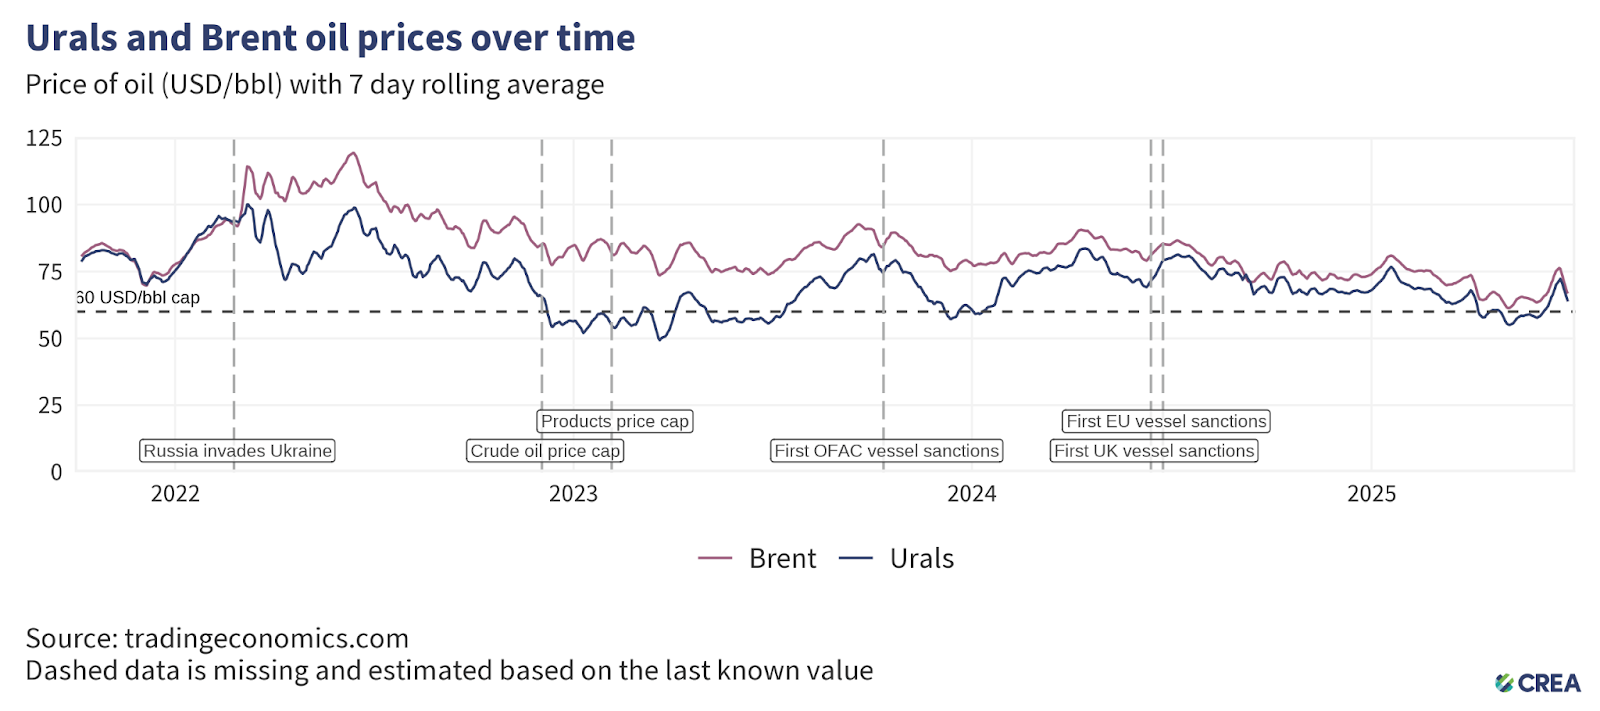
- In June 2025, the average Urals spot price rose sharply by 14% and was trading above the price cap, at USD 65.1 per barrel.
- The monthly average price of Sokol blend of Russian crude oil also rose by 8% to USD 64.5 per barrel.
- These rises in Russian oil prices were matched with market movements globally. The benchmark Brent crude also saw a 9% month-on-month increase in June.
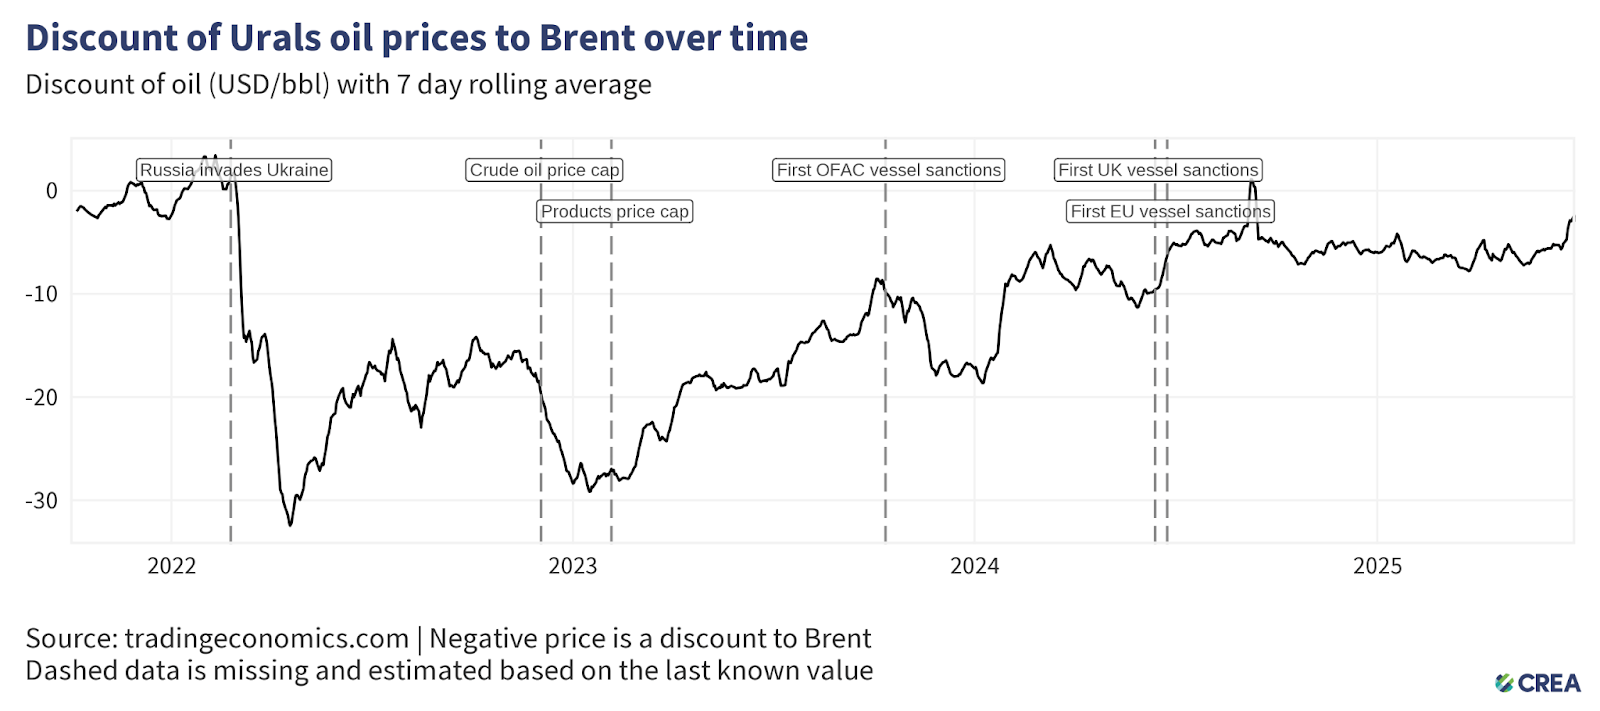
- In June, the discount on Urals-grade crude oil dropped by a massive 26% month-on-month to an average of USD 4.7 per barrel compared to Brent crude oil. The discount on the Sokol, meanwhile, rose by 25% to USD 5.18 per barrel.
- Throughout this period, vessels owned or insured by G7+ countries continued to load Russian oil in all Russian port regions, where average exported crude oil prices remained above the price cap level. These cases call for further investigation by enforcement agencies into breaches of sanctions.
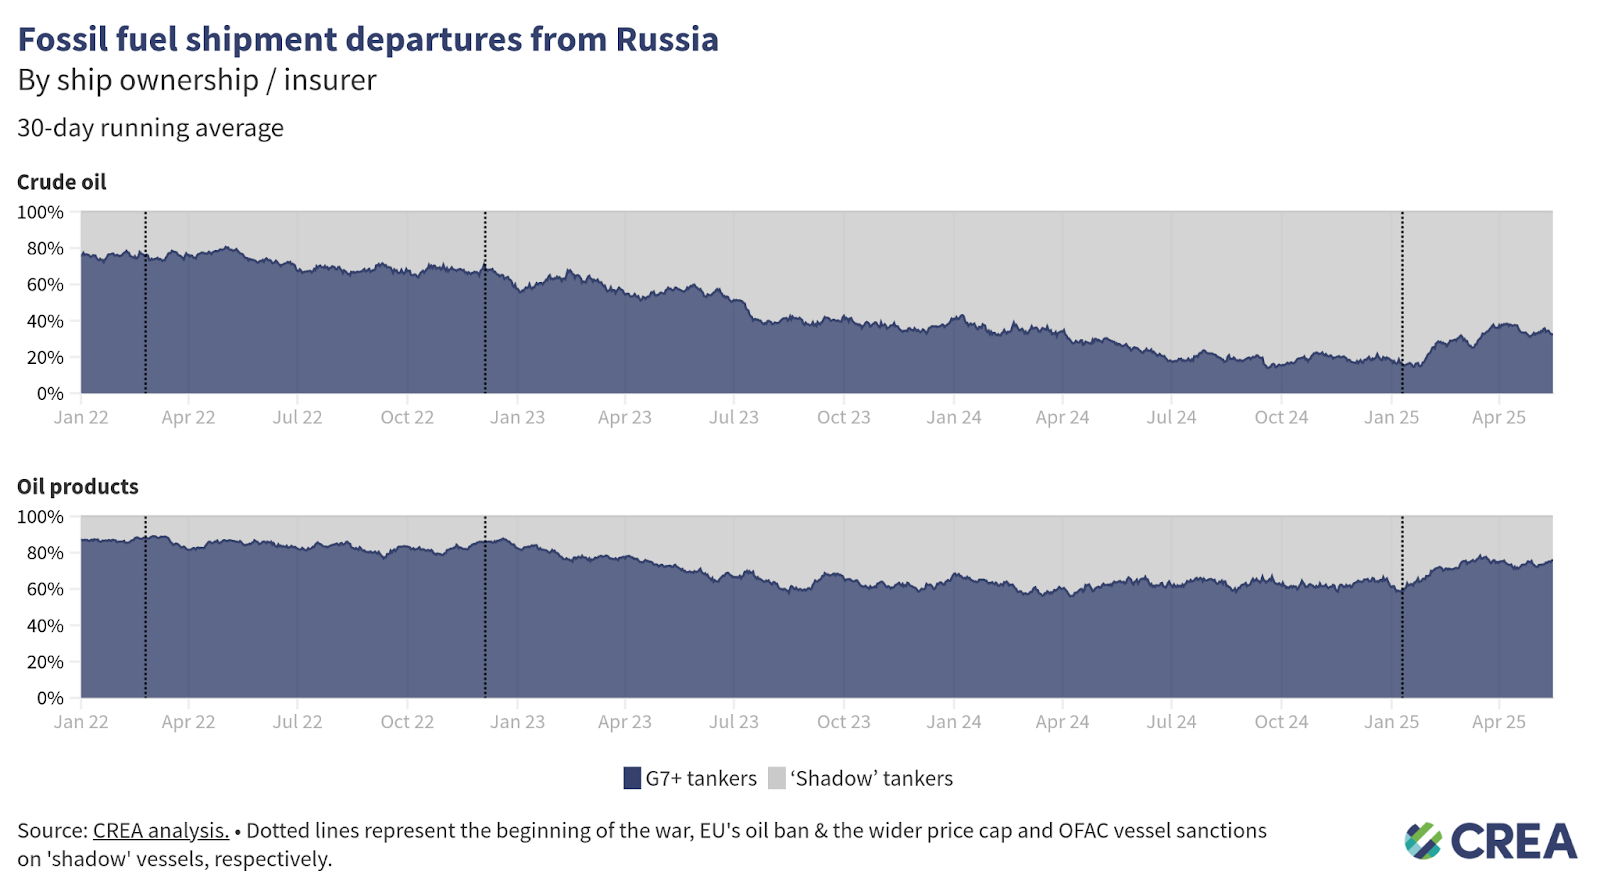
- In June 2025, Russia exported 24.8 mn tonnes of oil by sea — a 5% month-on-month decline. Over half (56%) of these oil exports were transported on G7+ tankers, a 6 percentage point increase from May. Since January, the G7+ share in Russian oil transport has increased from 36% to 56%.
- Russia’s seaborne crude oil exports dropped by 5% month-on-month. G7+ tankers handled 41% of crude oil shipments in June, up from just 17% in January. ‘Shadow’ tanker use for crude oil fell from 83% in January to 59% in June.
- The transport of Russian oil products has generally been less reliant on ‘shadow’ tankers. In June, G7+ tankers accounted for 80% of oil product exports, up from 75% in May.
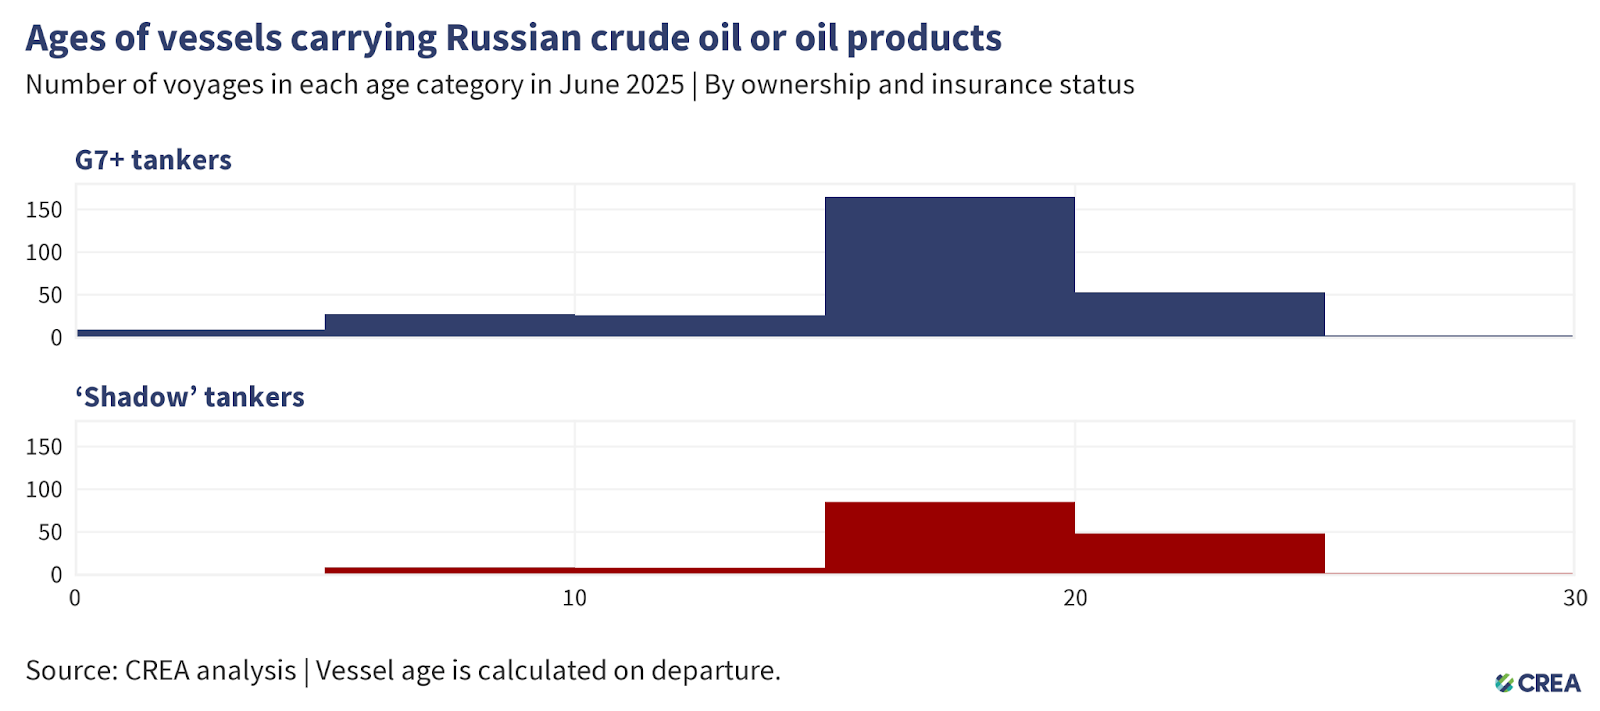
- In June 2025, 435 vessels exported Russian crude oil and oil products, of which 153 were ‘shadow’ tankers. A third of these ‘shadow’ tankers were at least 20 years or older.
- Older ‘shadow’ tankers transporting Russian oil and petroleum products across EU Member States’ exclusive economic zones, territorial waters, or maritime straits raise environmental and financial concerns due to their age, questionable maintenance records, and insurance coverage. Their insurance potentially lacks sufficient protection & indemnity (P&I) coverage to cover the cost in the event of an oil spill or other catastrophe. In the event of accidents, coastal countries may bear the financial burden of cleanup, as well as the repercussions of damage to their marine ecosystems.
- The cost of cleanup and compensation resulting from an oil spill from tankers with dubious insurance could amount to over EUR 1 bn for coastal country’s taxpayers.
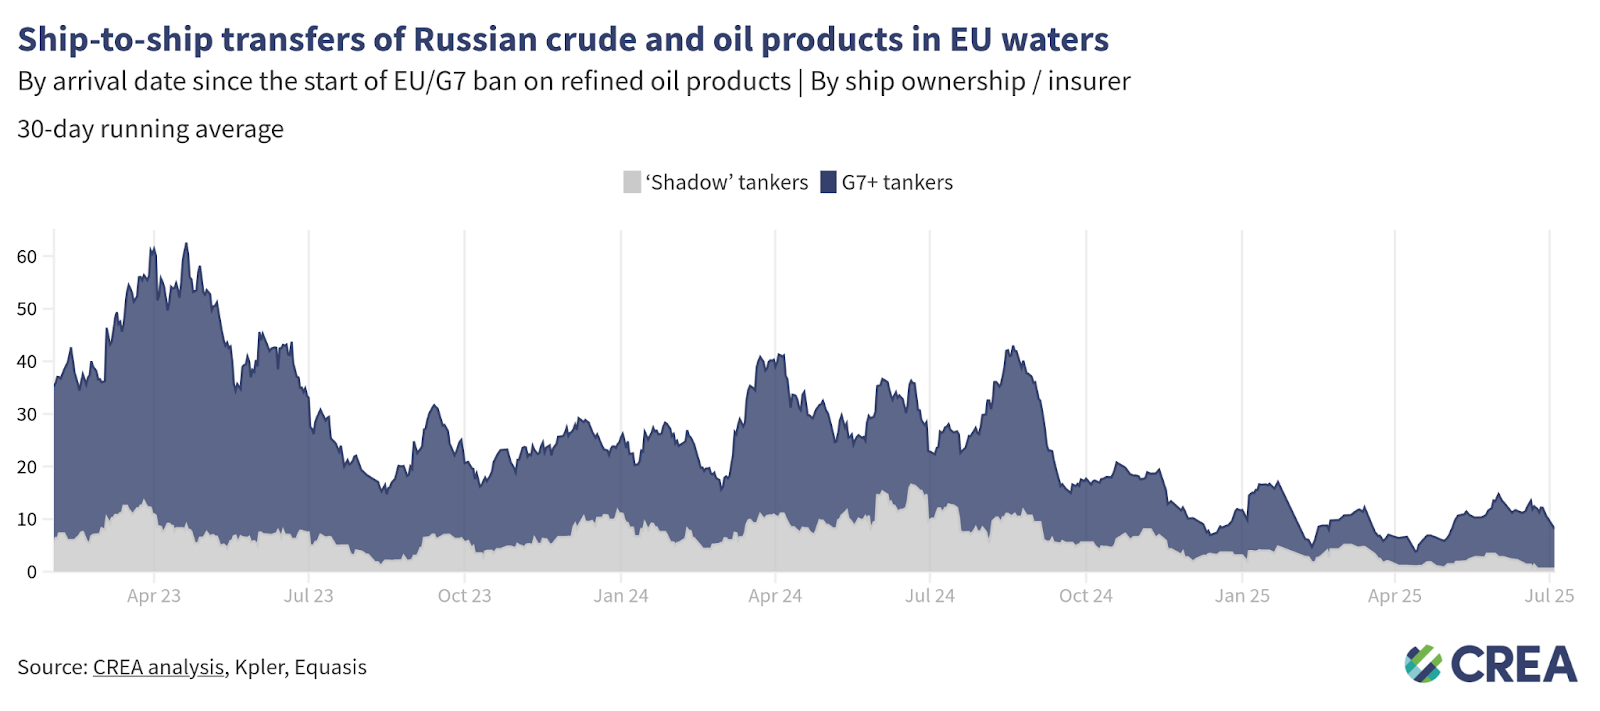
- In June 2025, an estimated EUR 218 mn worth of Russian oil was transferred daily via ship-to-ship (STS) operations in EU waters — a 6% increase from the previous month. G7+ tankers conducted 87% of these transfers, while the rest involved ‘shadow’ vessels, which are often uninsured or registered under flags of convenience.
- This shift reflects growing pressure from Western sanctions and enforcement measures. The EU’s 16th and 17th sanctions packages ban port access for any vessel involved in unauthorized STS of Russian oil and require a 48-hour advance notice for planned STS in EU waters. These policies target risky operations and reduce opportunities for non-compliant activity.
- Panama has also joined in tightening oversight. In May, its maritime authority mandated that Panama-flagged tankers — many of which belong to the ‘shadow’ fleet — submit detailed STS plans 48 hours in advance. Combined, these international measures are pushing STS operations toward compliant, G7-aligned vessels.
Russia’s fossil fuel export revenues have fallen since the sanctions were implemented, subsequently constricting Putin’s ability to fund the war. However, much more should be done to limit Russia’s export earnings and constrict the funding of the Kremlin’s war chest. This includes lowering the oil price cap, increasing monitoring and enforcement of sanctions, and banning unsanctioned fossil fuels such as LNG and pipeline fuels that are legally allowed into the EU.
Lowering the oil price cap
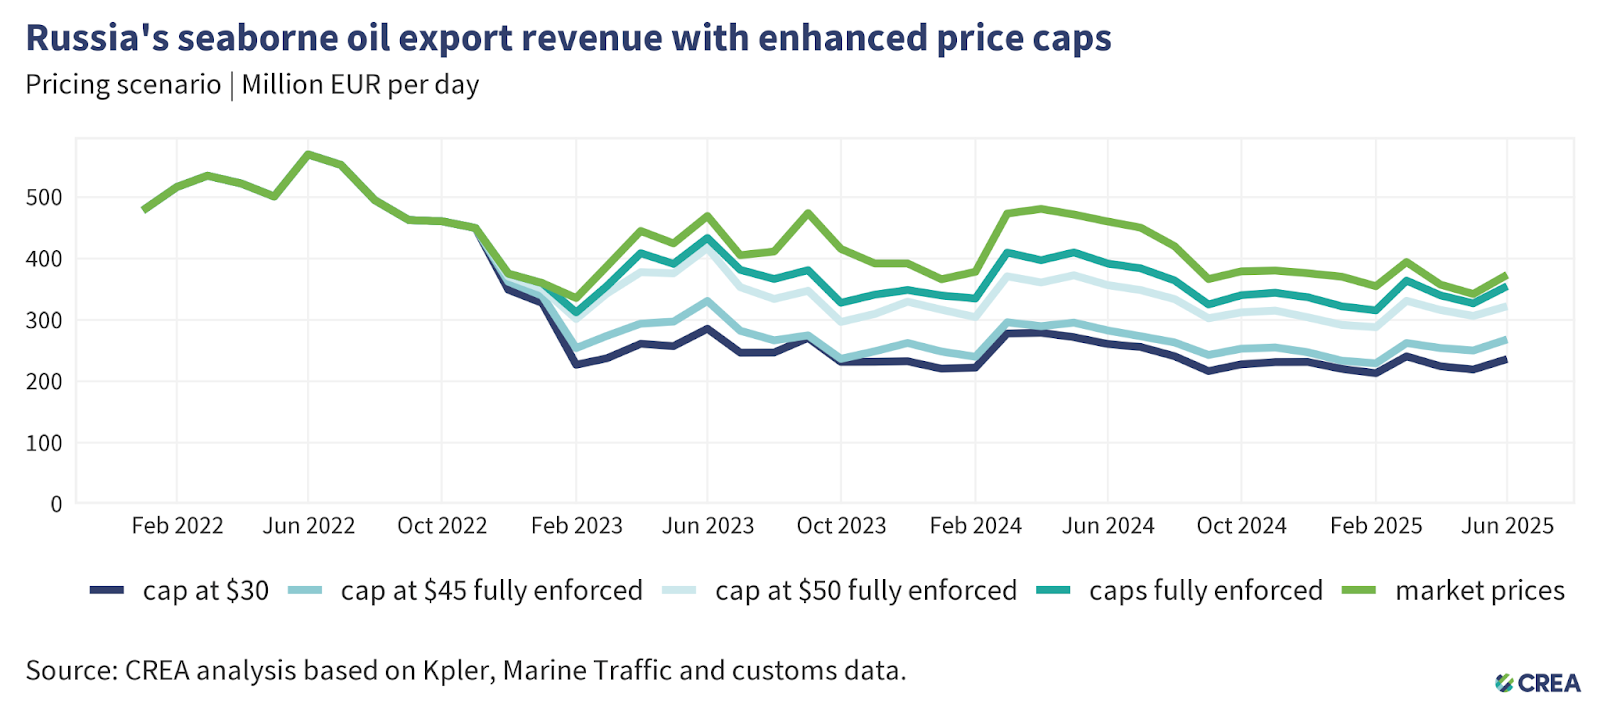
- A lower price cap of USD 30 per barrel (still well above Russia’s production cost, which averages USD 15 per barrel) would have slashed Russia’s oil export revenue by 40% (EUR 146 bn) from the start of the EU sanctions in December 2022 until the end of June 2025. In June alone, a USD 30 per barrel price cap would have slashed Russian revenues by 37% (EUR 4.12 bn).
- Lowering the price cap would be deflationary, reducing Russia’s oil export prices and inducing more production from Russia to make up for the drop in revenue.
- Since introducing sanctions until the end of June 2025, thorough enforcement of the price cap would have cut Russia’s export revenues by 11% (EUR 39.51 bn). In June 2025 alone, full enforcement of the price cap would have reduced revenues by 5% (approximately EUR 0.55 bn).
- The EU Commission recently proposed lowering the oil price cap to USD 45 per barrel, considering current global oil prices. CREA analysis suggests that a USD 45 per barrel price cap would have cut Russian revenues by 28% (EUR 3.1 bn) in June alone. But this calculation is based on strong and full enforcement of the cap — which even now leaves much to be desired.
Restrict the growth of ‘shadow’ tankers & plug the refining loophole
- Russia’s reliance on tankers owned or insured in G7+ countries has fallen due to the growth of ‘shadow’ tankers. This subsequently impacts the coalition’s leverage to lower the price cap and hit Russia’s oil export revenues. Sanctioning countries must prevent Russia’s growth in ‘shadow’ tankers that are immune to the oil price cap policy.
- G7+ countries must also plug the widening refining loophole by banning the importation of oil products produced from Russian crude oil. This would enhance the impact of the sanctions by disincentivising third countries from importing large amounts of Russian crude and helping cut Russian export revenues. Banning the imports of oil products from refineries that process Russian crude oil would also lower the price of Russian oil, as they would struggle to find buyers or expand their market.
Stronger enforcement & monitoring
- Enforcement agencies overseeing the sanctions must take proactive measures against violating entities, including insurers registered in price cap coalition countries, shippers, and vessel owners.
- Despite clear evidence of violations, agencies must do more to enforce penalties against shippers, insurers, or vessel owners. This information must be shared widely in the public domain. Penalties against violating entities increase the perceived risk of being caught and serve as a deterrent.
- Penalties for violating the price cap must be significantly harsher. Current penalties include a 90-day ban on vessels from securing maritime services after violating the price cap, a mere slap on the wrist. If found guilty of violating sanctions, vessels should be fined and banned in perpetuity.
- Sanctions enforcement bodies must continue to sanction ‘shadow’ tankers as doing so hinders Russia’s ability to transport its oil above the price cap. CREA estimates that the Office of Foreign Assets Control (OFAC)’s initial sanctioning of ‘shadow’ tankers widened the discount that Russia offered buyers of its oil and cut Russia’s crude oil export revenues by 5% (EUR 512 mn per month).
- The lack of proper monitoring and enforcement along with rising oil prices have increased Russia’s export revenues to fund its war against Ukraine.
- The G7+ countries should ban STS transfers of Russian oil in G7+ waters. STS transfers undertaken by old ‘shadow’ tankers with questionable maintenance records and insurance pose environmental and financial risks to coastal states and support Russia logistically in exporting high volumes of crude oil. Coastal states should require oil tankers suspected of being ‘shadow’ tankers transporting Russian oil through their territorial waters to provide documentation showing adequate maritime insurance. Upon failing to do so, having been identified as a ‘shadow’ tanker, they should be added to the OFAC, UK, and European sanctions list. This policy could limit Russia’s ability to transport its oil on ‘shadow’ tankers, which are not required to comply with the oil price cap policy.
Relevant reports:
This monthly report uses CREA’s fossil shipment tracker methodology.
The data used for this monthly report is taken as a snapshot at the end of each month. The data provider revises and verifies data on trades and oil shipments throughout the month. We subsequently update this verified data each month to ensure accuracy. This might mean that figures for the previous month change in our updated subsequent monthly reports. For consistency, we do not amend the previous month’s report; instead, we treat the latest one as the most accurate data for revenues and volumes.
Russia’s daily revenues for commodities used in this report are derived as an average, using CREA’s pricing methodology.
CREA’s estimates of the impact of a revised and lowered price cap have been updated since February 2025. These numbers are a more accurate representation of the revenue losses Russia would incur. Our earlier numbers severely underestimated the impact of a lower price cap due to a bug that we identified that mislabelled commodities in our model.