Acquisition of data and identification of instrumental variables
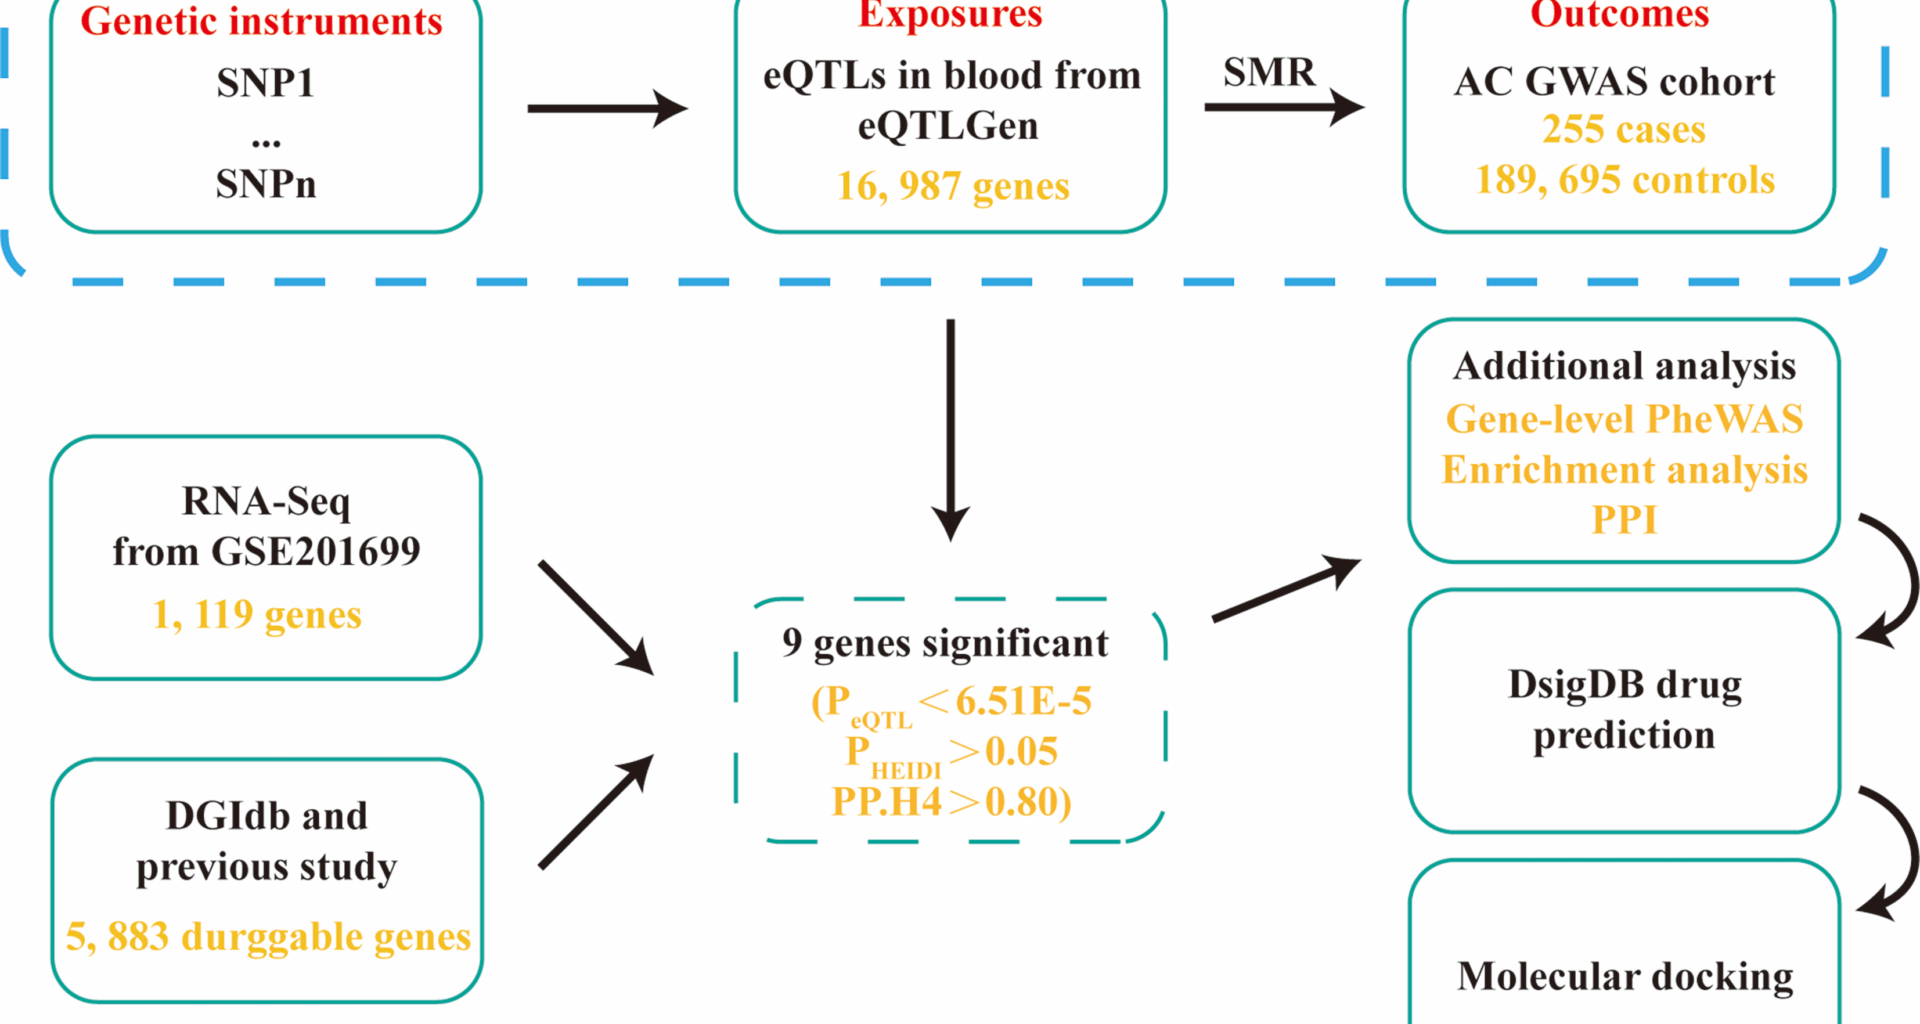
To identify common single nucleotide polymorphisms (SNPs, population minor allele frequency > 1%) associated with the expression of potential drug target genes in AC, we extracted publicly available eQTL data (both sexes) from eQTLGen (https://www.eqtlgen.org/). The consortium contains 37 datasets with a total of 31,684 individuals of both sexes reporting 16,987 genes expressed in whole blood. GWAS pooled data for AC were obtained from the Finngen database (https://www.finngen.fi/en) and included a total of 255 cases and 189, 695 controls containing 16,380,373 SNPs.
The RNA-seq results were obtained from the GSE201699 dataset of the Gene Expression Omnibus (GEO) database (https://www.ncbi.nlm.nih.gov/geo/), which consisted of proximal esophageal and distal esophageal mucosal biopsy specimens from 8 cases of the control group and 14 cases of the AC group. Among them, the AC group included 5 cases of type 1 AC and 9 cases of type 2 AC.
The eQTL SNPs for this analysis were from cis-regulatory regions (1 MB on each side of the gene) and had a default p-value of 5.0e-8. We used the F-statistic to assess the strength of the instrumental SNPs. The F-statistic for each SNP was calculated by the following equation:
$$F = {R^2}(N – 2)/(1 – {R^2})$$
where N is the sample size and R [2] is the genetic variance, and R [2] was calculated by the following equation:
$$\:{R}^{2}=\frac{{{\upbeta\:}}^{2}}{{\beta\:}^{2}+{SE}^{2}\times\:N}$$
MR analysis between target gene expression in blood and AC
We performed Summary-data Based Mendelian Randomization (SMR) analysis to assess the association between changes in target gene expression (using whole blood eQTL) and AC risk (using GWAS). HEIDI testing was also performed by default using the SMR, with the methodology fully referenced to the manual on the SMR webpage (https://yanglab.westlake.edu.cn/software/smr/). Due to multiple testing, a Bonferroni correction was used to determine significant associations. The Bonferroni correction was applied to determine the adjusted significance threshold for multiple testing, taking into account the false positives caused by multiple testing.
Differential gene expression
In order to further screen potential drug target genes, we performed differential gene analysis based on the RNA-seq data of AC for different sites (proximal and distal) and different fractions (type 1 and type 2), respectively, and took the intersection with potential drug target genes to obtain histologically different drug target genes.
Druggable genome
We obtained 5,883 unique druggable genes from previous studies for subsequent analysis [10]. This gene set includes 3,953 druggable genes obtained from DGIdb (https://www.dgidb.org/) and 4,463 druggable genes that have been reported in the review [8].
Colocalization analysis
Sometimes, a single SNP is located in the regions of two or more genes. In such cases, its impact on a disease (here, AC) is influenced by a mix of different genes. Colocalization analysis was used to confirm the potential shared causal genetic variations in physical location between AC and eQTLs. We separately filtered SNPs located within ± 1000 kb from each migraine risk gene’s transcriptional start site (TSS) from AC GWAS data, blood eQTL data. The probability that a given SNP is associated with AC is denoted as P1, the probability that a given SNP is a significant eQTL is denoted as P2, and the probability that a given SNP is both associated with AC and is an eQTL result is denoted as P12. All probabilities were set to default values (P1 = 1 × 10 − 4, P2 = 1 × 10 − 4, and P12 = 1 × 10 − 5) [11]. We used posterior probabilities (PP) to quantify the support for all hypotheses, which are identified as PPH0 through PPH4: PPH0, not associated with any trait; PPH1, related to gene expression but not associated with AC risk; PPH2, associated with migraine risk but not related to gene expression; PPH3, associated with both AC risk and gene expression, with clear causal variation; and PPH4, associated with both AC risk and gene expression, with a common causal variant. Given the limited capacity of colocalization analysis, we restricted our subsequent analyses to genes where PPH4 was greater than or equal to 0.8. Colocalization analysis was conducted using the R package ’coloc’ (version 5.2.3).
Phenotype-wide association analysis
To further assess the horizontal pleiotropy and possible side effects of potential drug targets, a phenotype-wide association study (PheWAS) was performed on the AstraZeneca PheWAS Portal (https://azphewas.com/)12. The original study used data from ~ 15.5 K binary and ~ 1.5 K continuous phenotypes from a subset of ~ 450,000 exome sequencing participants published by the UK Biobank. The full method of construction can be found in the original article [12]. We performed multiple corrections and set a threshold of 2E − 9 (as the default program for AstraZeneca PheWAS Portal) to account for potential false positives.
PPI (protein-protein interaction) networks and enrichment analysis
Ten drug target genes were input into GeneMANIA (https://genemania.org/) for the construction of PPI networks, and the co-expression, co-localization, and role of related genes as well as functional enrichment of these drug targets were observed [13].
Candidate drug prediction and molecular Docking
Evaluating protein-drug interactions is important to understand whether a target gene can be used as an actual drug target. In this study, we will utilize the Drug Signature Database (DSigDB, https://dsigdb.tanlab.org/DSigDBv1.0/) in the Enrichr database (https://maayanlab.cloud/Enrichr/enrich/) to predict small molecule drugs that may act on drug target genes [14]. And in principle, our screening conditions are adjusted P-value
Molecular docking simulations allow us to analyze the binding affinity and interaction patterns between ligands and drug targets. By identifying ligands with high binding affinity and favorable interaction patterns, it facilitates the next step of experimental validation and optimizes the design of potential drug candidates. In this study, Autodock Vina 1.1.2 (http://autodock.scripps.edu/), a computerized protein-ligand docking software for molecular docking of small molecule drugs and proteins encoded by the corresponding target genes, was used [15]. Drug structure data were obtained from PubChem Compound Database (https://pubchem.ncbi.nlm.nih.gov/), and protein structure data were downloaded from PDB (Protein Data Bank, https://www.rcsb.org/). Proteins not retrieved in the PDB database had their structures obtained from AlphaFold Protein Structure Database (https://alphafold.com/). First, water molecules are first removed from the protein and ligand, then polar hydrogen atoms are added, and subsequently, the protein is wrapped in a grid box. After the docking was completed, the best bound conformation was selected for presentation in Pymol 3.0 (https://pymol.org/).